
Natural Scientific 991 manual · Chapter 12 of 18
Statistics and regression
Enter data in the editor, then get one-variable statistics, regression lines and curves.
12.1Open Statistics and pick a type#
Press MENU then 6. A menu asks for the type of data.
| Number | Type | Use it for |
|---|---|---|
| 1 | 1-Variable | One list of values (mean, spread, quartiles). |
| 2 | y=a+bx | Straight-line regression. |
| 3 | y=a+bx+cx² | Quadratic regression. |
| 4 | y=a+b·ln(x) | Logarithmic regression. |
| 5 | y=a·e^(bx) | Exponential regression. |
| 6 | y=a·b^x | Another exponential form. |
| 7 | y=a·x^b | Power regression. |
| 8 | y=a+b/x | Reciprocal regression. |
The type menu
MENU 6.
MENU6
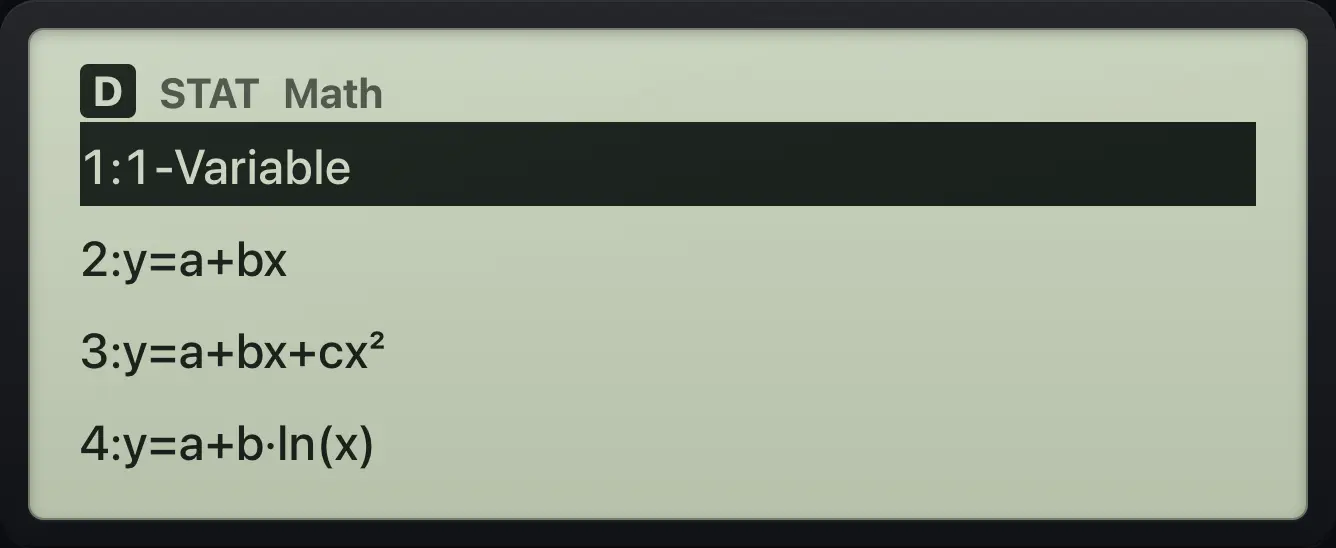
1:1-Variable 2:y=a+bx12.2Enter and edit data#
The editor is a table with an x column (and y for two-variable types). Type a number and press = to store it and move to the next row. Use ▲, ▼, ◀ and ▶ to move around, type over a value to change it, and DEL to delete the row. Press AC to leave the editor; OPTN brings up the statistics menu from the editor.
Enter four values
Open Statistics, choose 1-Variable, and type 1, 2, 3, 4.
MENU611=2=3=4=
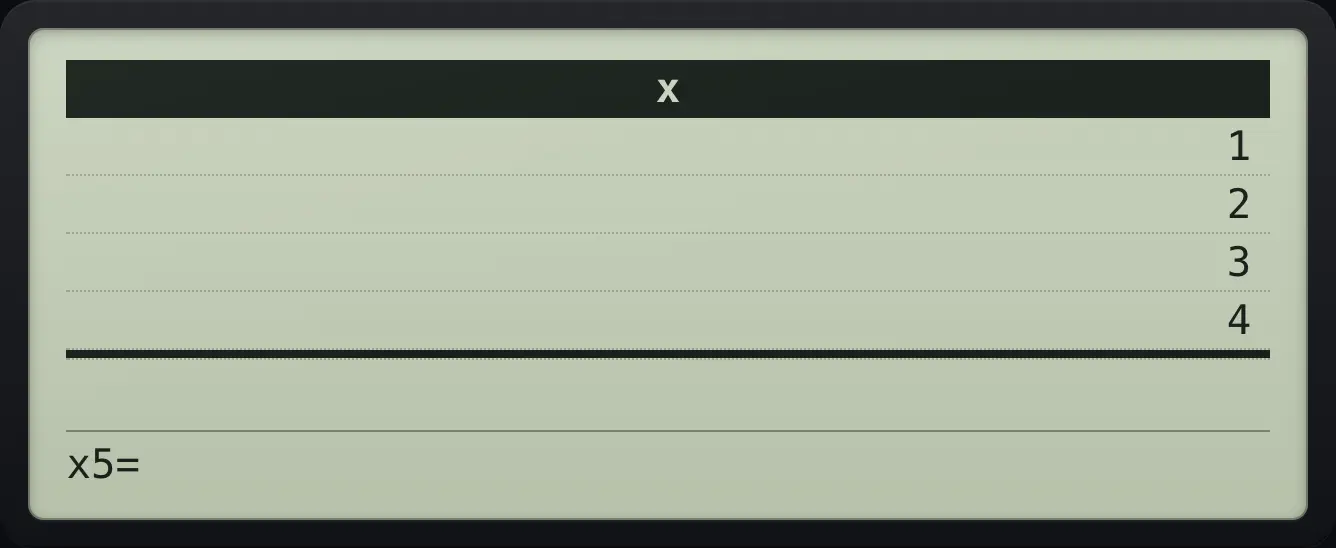
x5=Delete a row
Enter 1, 2, then go up and delete the second row.
MENU611=2=▲DEL
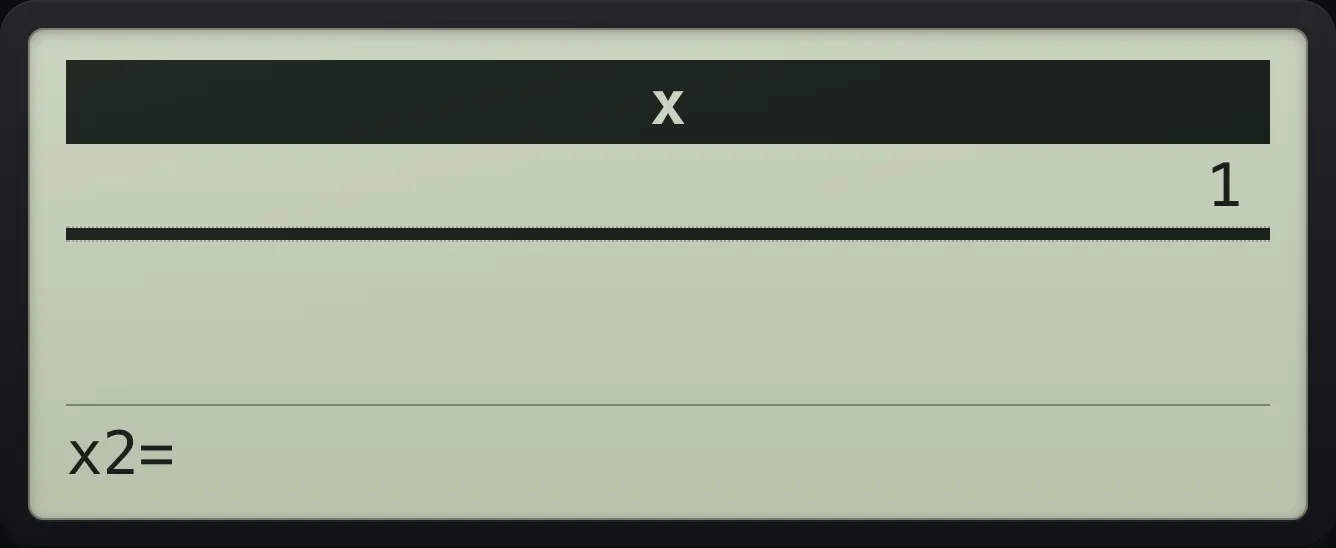
x2=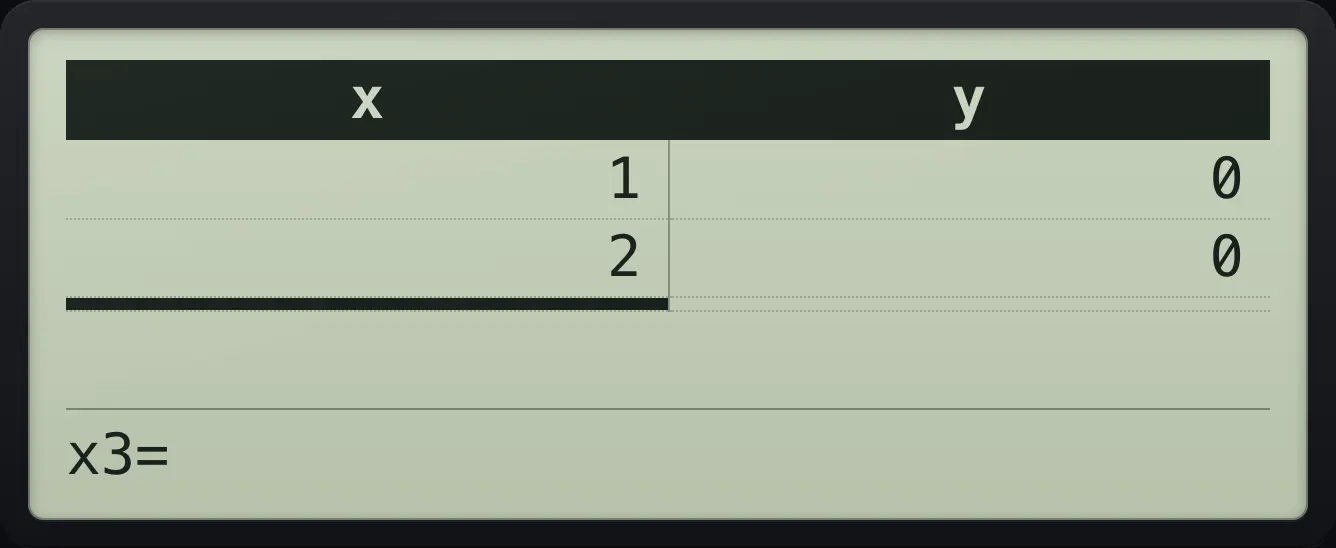
12.3Find the mean and standard deviation#
Press OPTN then 3 (1-Variable Calc). The results list shows: x̄, Σx, Σx², σ²x, σx, s²x, sx, n, min(x), Q1, Med, Q3, max(x). Scroll with ▼. σ is the population standard deviation and s is the sample standard deviation. Press AC to go back to the editor.
Mean and sums
Enter 1, 2, 3, 4, then OPTN 3.
MENU611=2=3=4=OPTN3
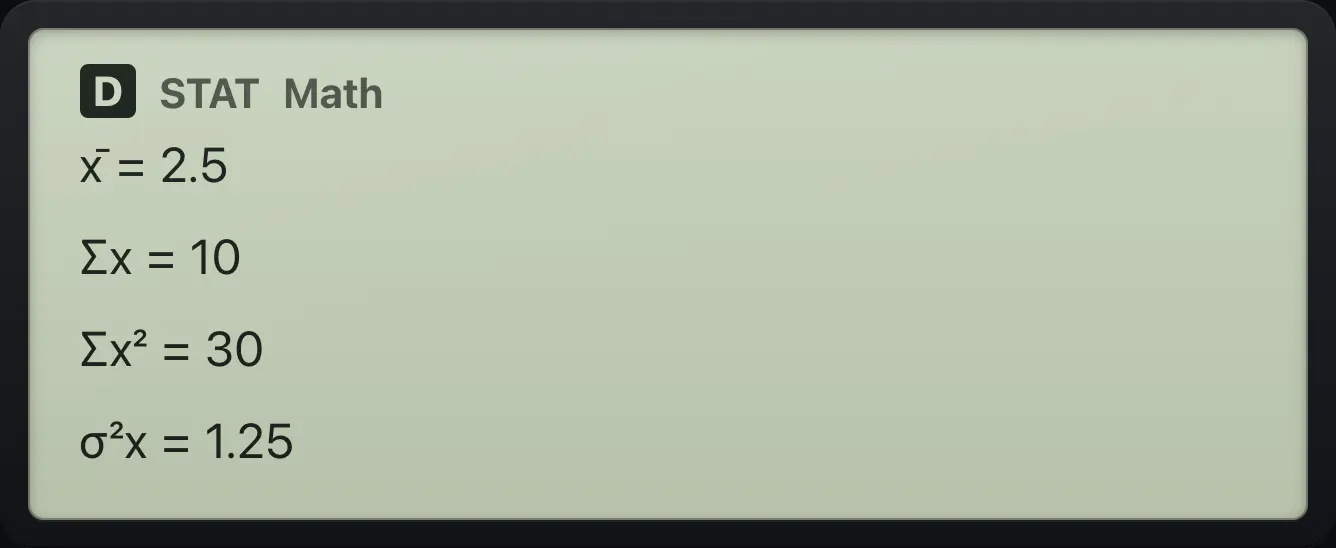
x̄=2.5 Σx=10 Σx²=30 σ²x=1.25Sample deviation
Scroll down six lines.
MENU611=2=3=4=OPTN3▼▼▼▼▼▼
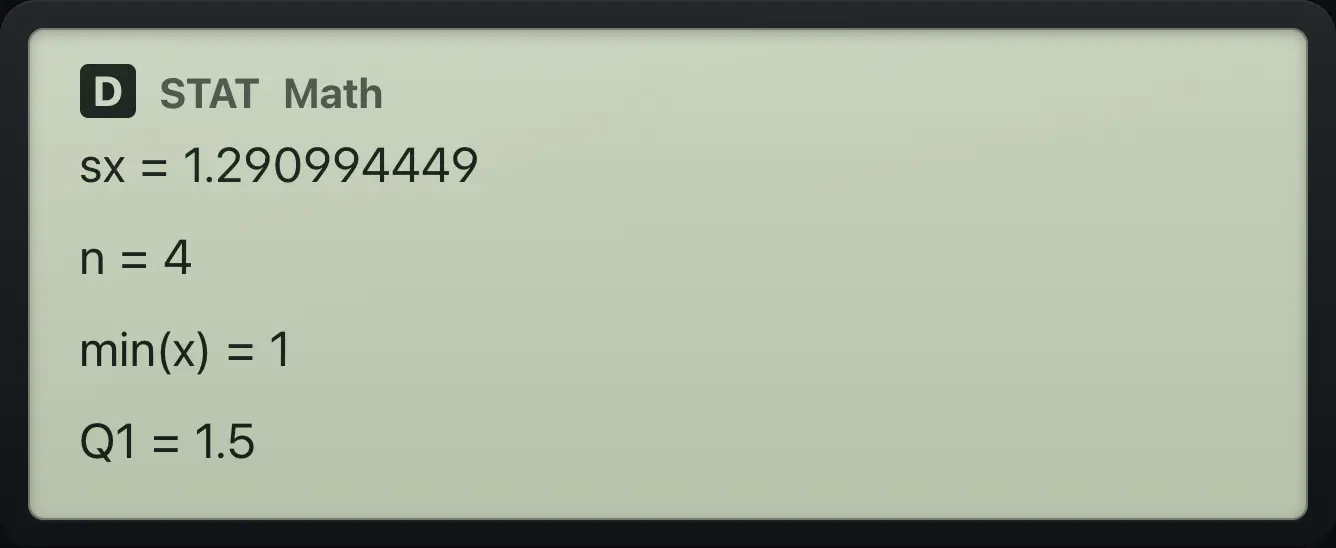
sx=1.290994449 n=4Quartiles and median
Scroll to the end of the list.
MENU611=2=3=4=OPTN3▼▼▼▼▼▼▼▼▼
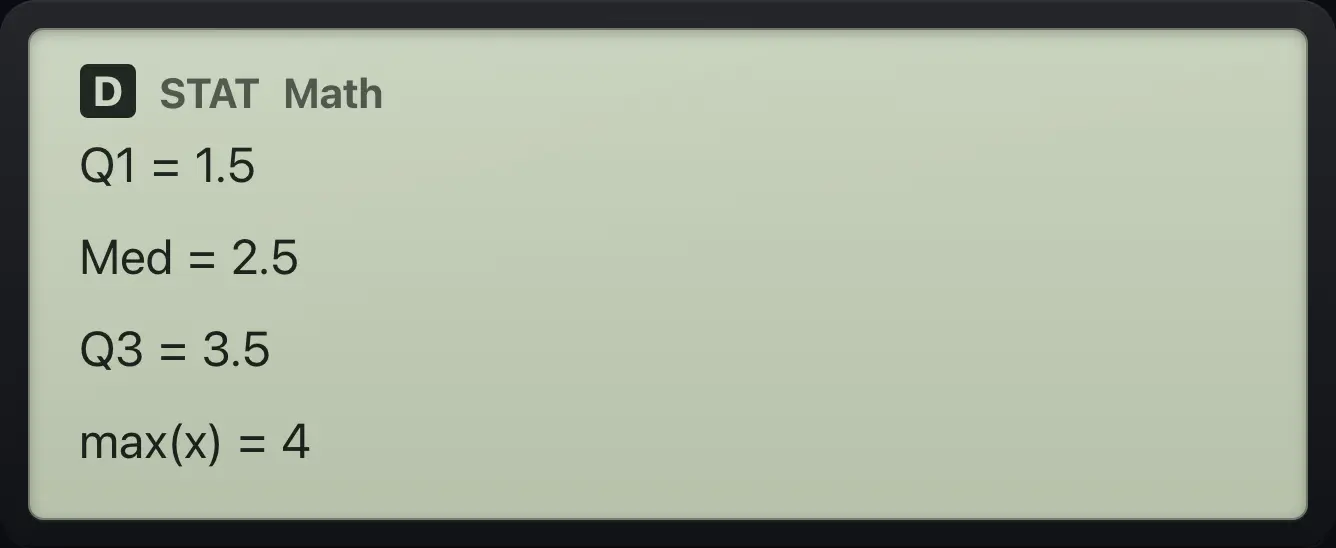
Q1=1.5 Med=2.5 Q3=3.5 max(x)=412.4Use a frequency column#
Turn on Frequency in SETUP (SETUP, 6, 1) before choosing the type. The editor gets a Freq column. Enter your values first, then go back up and right to fill in how many times each value occurs. A blank Freq counts as 1.
Weighted mean
Frequency On, then 1-Variable.
SHIFTSETUPMENU61MENU61Enter 1, 2, 3, then go to the top of the Freq column.
1=2=3=▲▲▲▶Freq 4 for x = 1, then 1 for x = 2. Calculate.
4=1=OPTN3
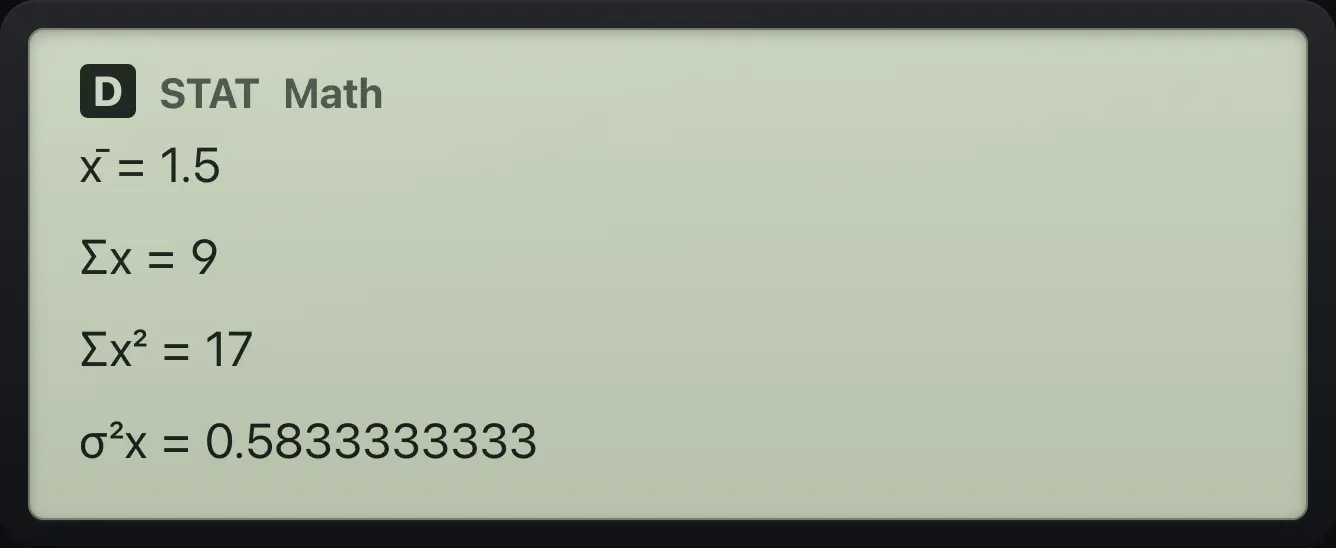
x̄=1.5 Σx=912.5Fit a straight line (linear regression)#
Choose type 2 (y=a+bx). Enter all the x values, then go up and right to the y column and enter the y values, then press OPTN and 3 (Regression Calc). The results show a, b and the correlation coefficient r.
A perfect line
Choose y=a+bx and type x = 1, 2, 3.
MENU621=2=3=Go to the top of the y column and type 2, 4, 6. Calculate.
▶▲▲▲2=4=6=OPTN3
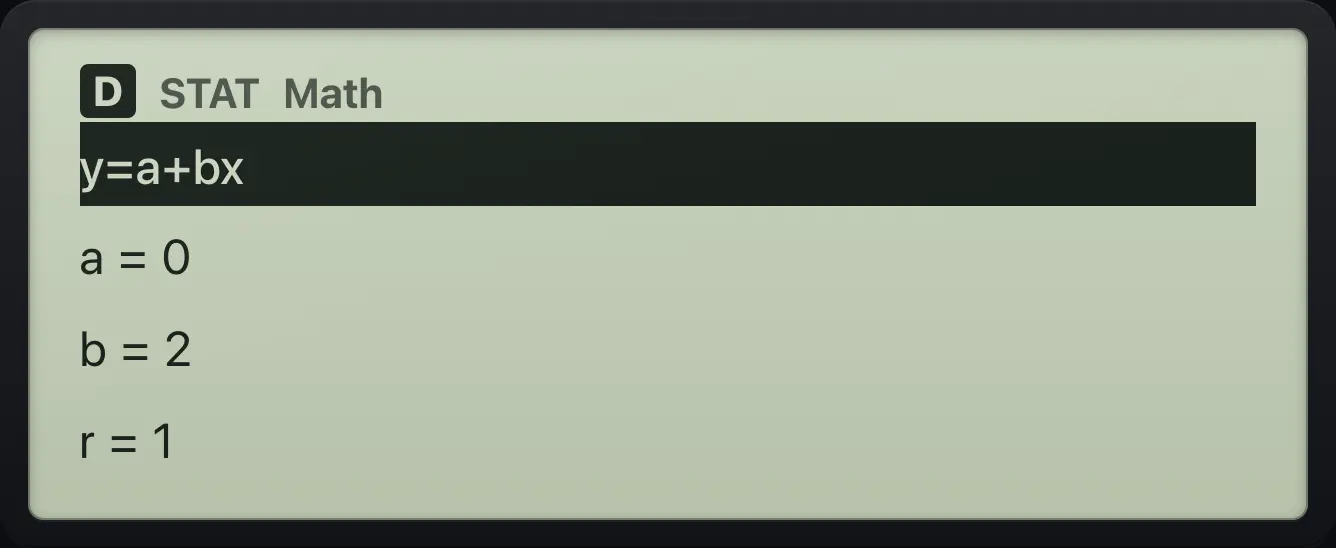
a=0 b=2 r=1A rough line
x = 1, 2, 3 and y = 2, 4, 7.
MENU621=2=3=▶▲▲▲2=4=7=OPTN3
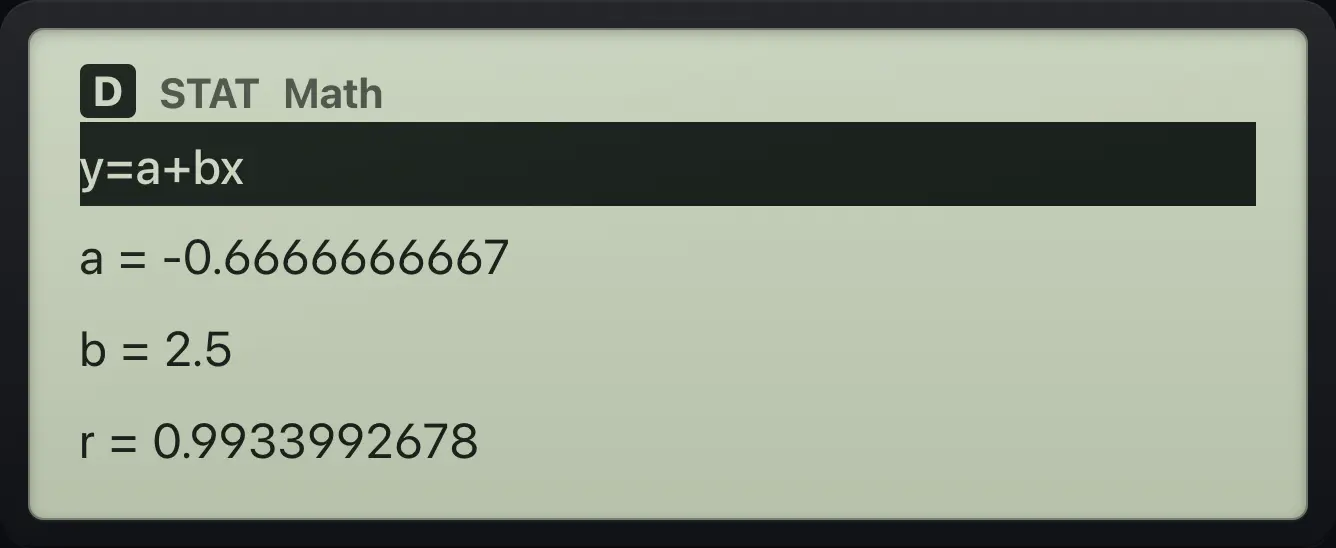
b=2.5 r=0.993399267812.6Quadratic, exponential and other fits#
Types 3 to 8 work the same way. The results give a, b and (for the quadratic) c, with r for the others. For y=a+b/x, the x values cannot be zero. The a·e^(bx) type reports b as the exponent; the a·b^x type reports b as the base.
Quadratic through three points
Type 3 (quadratic). x = 1, 2, 3 and y = 2, 4, 7.
MENU631=2=3=▶▲▲▲2=4=7=OPTN3
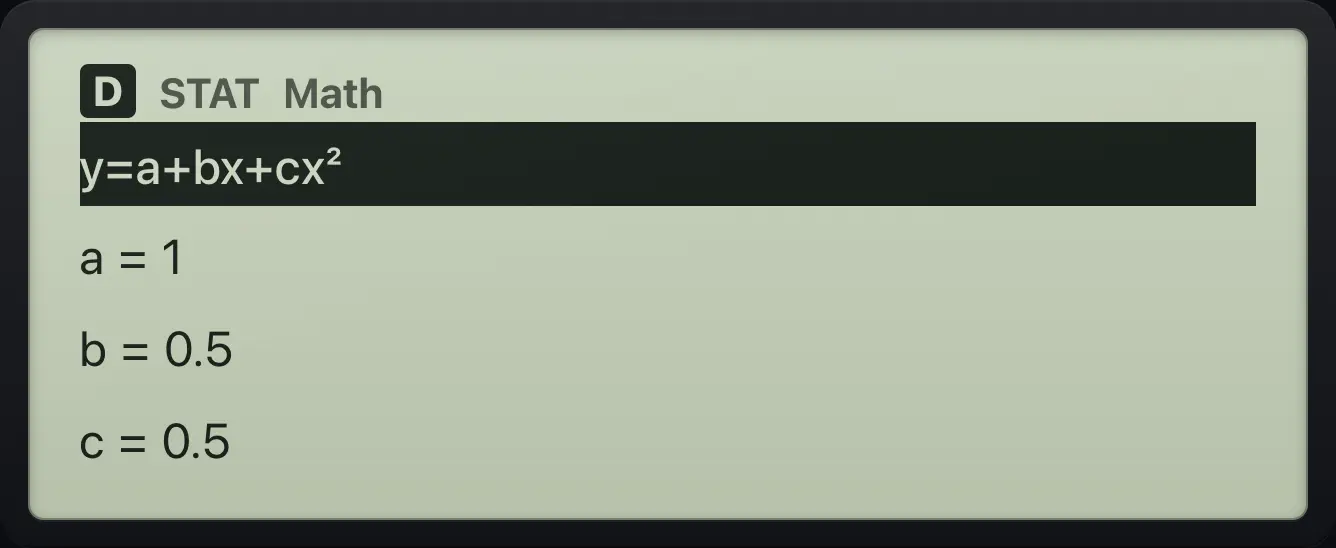
a=1 b=0.5 c=0.5Exponential y = a·b^x
Type 6. x = 0, 1, 2 and y = 3, 6, 12.
MENU660=1=2=▶▲▲▲3=6=12=OPTN3
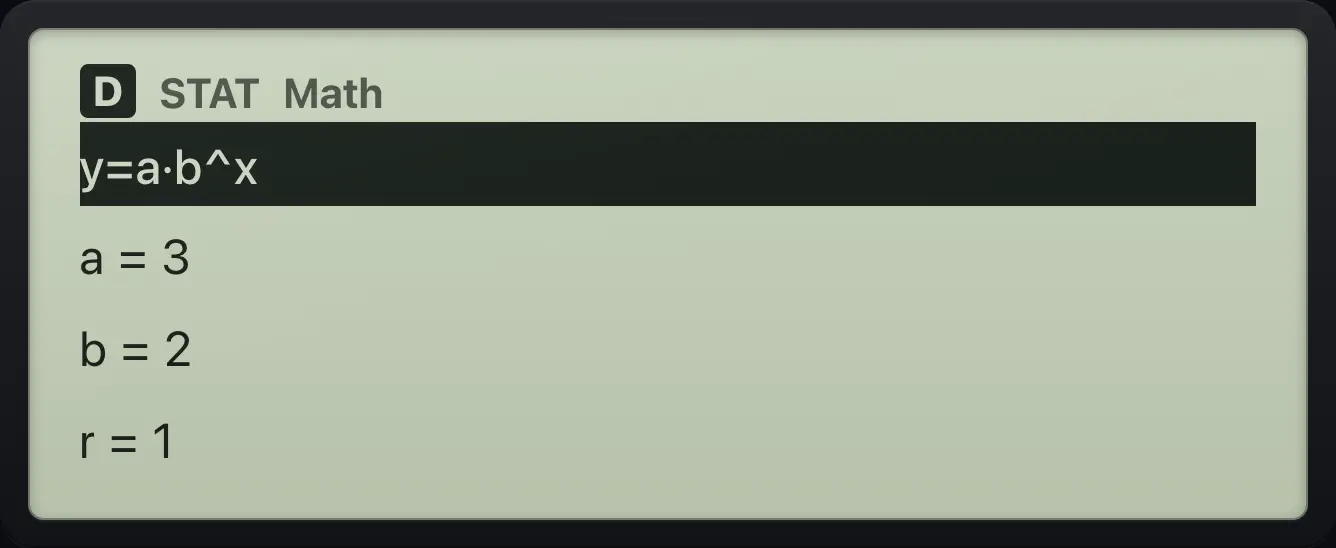
a=3 b=212.7The statistics OPTN menu#
| OPTN number | Item | What it does |
|---|---|---|
| 1 | Select Type | Choose a different statistics type. |
| 2 | Editor | Go to the data editor. |
| 3 | 1-Variable Calc / Regression Calc | Show the results for the current type. |
| 4 | Delete All | Erase all the data and start a fresh editor. |
The OPTN list in Statistics
Enter a value and press OPTN.
MENU611=OPTN
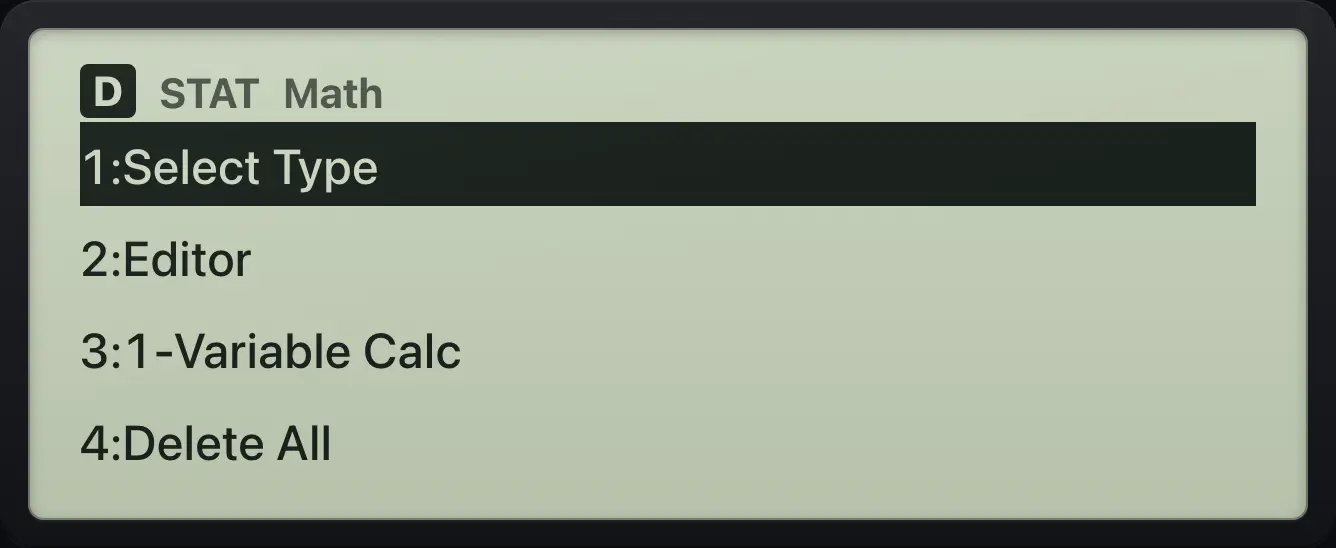
1:Select Type 2:Editor 3:1-Variable Calc 4:Delete AllDelete All data
Enter 1, 2, then OPTN 4 (Delete All), then OPTN 2 to reopen the editor.
MENU611=2=OPTN4OPTN2
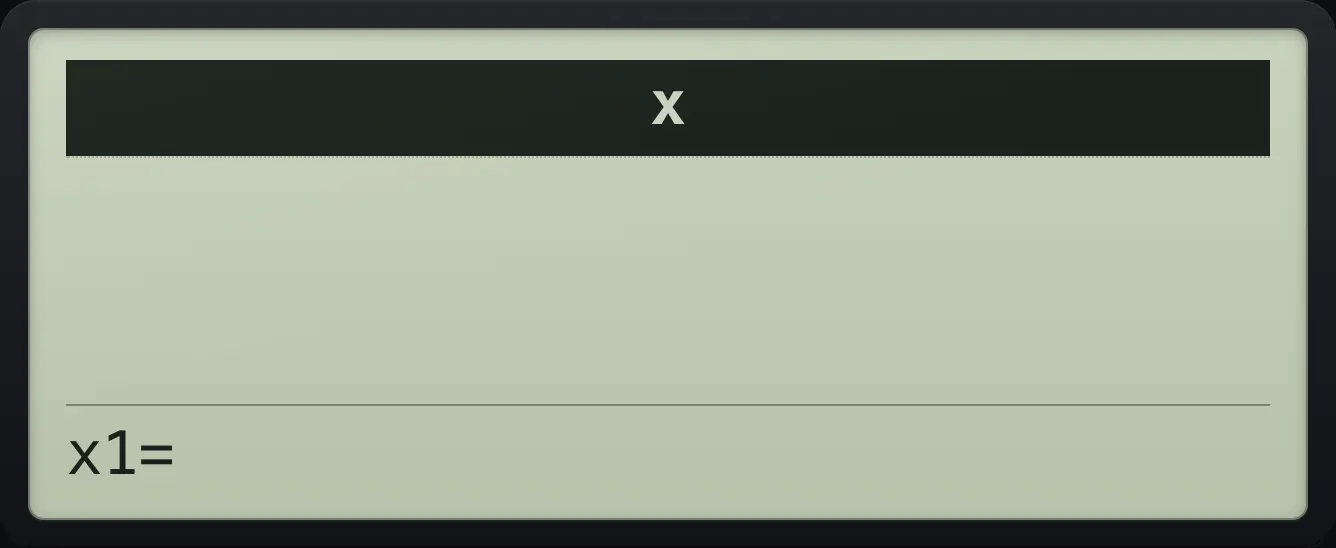
x1=fx-991EX ClassWiz is a trademark of Casio Computer Co., Ltd.. Trident Calculator is an independent product by South View Studios and is not affiliated with, sponsored by or endorsed by Casio. The name is used only to describe the kind of calculator this model resembles; Trident's names, keys, display, fonts and software are its own clean-room design.