
RPN Financial 12 manual · Chapter 13 of 16
Statistics
Enter data with Σ+, then find means, standard deviations, a fitted line, estimates, correlation and a weighted mean.
13.1Enter data with Σ+#
Statistics collect data into registers R1 to R6: R1 holds the count n, R2 the sum of x, R3 the sum of x², R4 the sum of y, R5 the sum of y² and R6 the sum of xy.
For a data point with two values, key in y, press ENTER, key in x and press Σ+ (Σ+). The display shows n, the number of points so far. For one variable, simply key in x and press Σ+. Start a new data set with fΣSST (CLEAR Σ).
- y
- ENTER
- x
- Σ+
- n is shown
| Register | Holds |
|---|---|
| R1 | , the number of points |
| R2 | |
| R3 | |
| R4 | |
| R5 | |
| R6 |
Enter four data points
Enter (x, y) = (1, 2), (2, 4), (3, 5), (4, 8), each as y, ENTER, x, Σ+.
2ENTER1Σ+4ENTER2Σ+5ENTER3Σ+8ENTER4Σ+
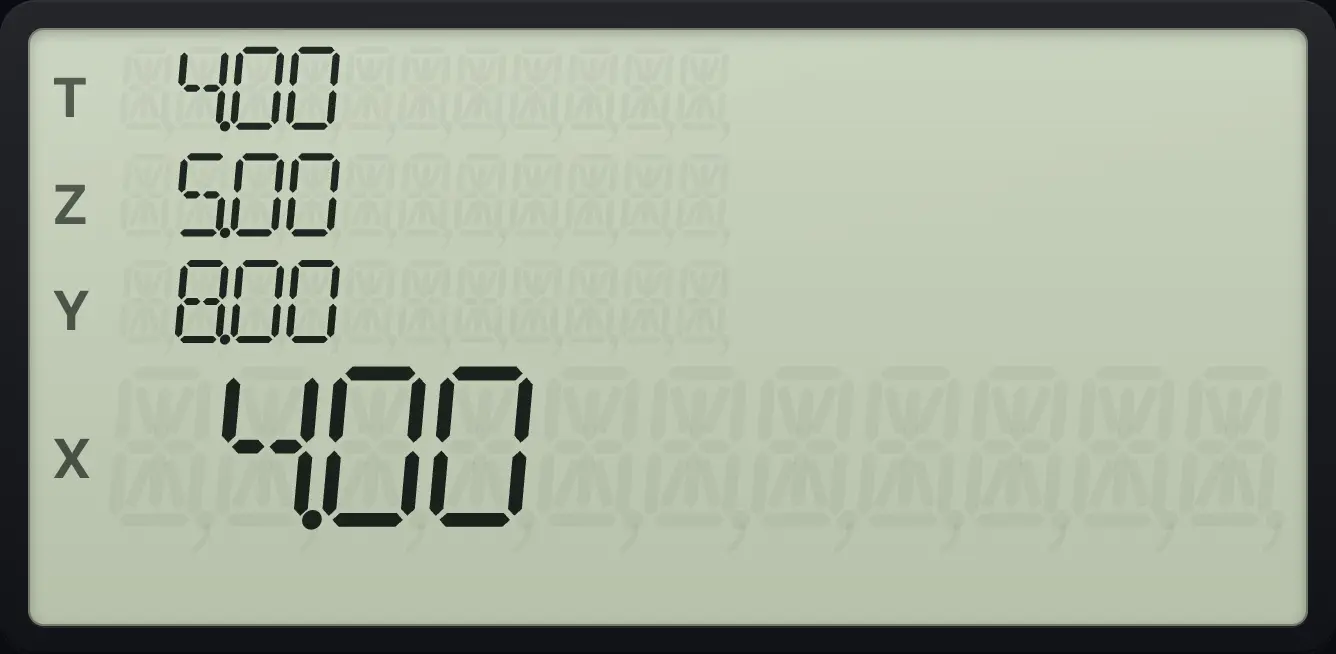
The display shows n = 4.00.13.2Find the mean and standard deviation#
gx̄0 (x̄) gives the mean of x in X and the mean of y in Y. gs. (s) gives the sample standard deviation: s of x in X and s of y in Y. The mean needs one point. The standard deviation needs at least two.
Mean of x and y
Enter the data, then press g, x̄.
2ENTER1Σ+4ENTER2Σ+5ENTER3Σ+8ENTER4Σ+gx̄0
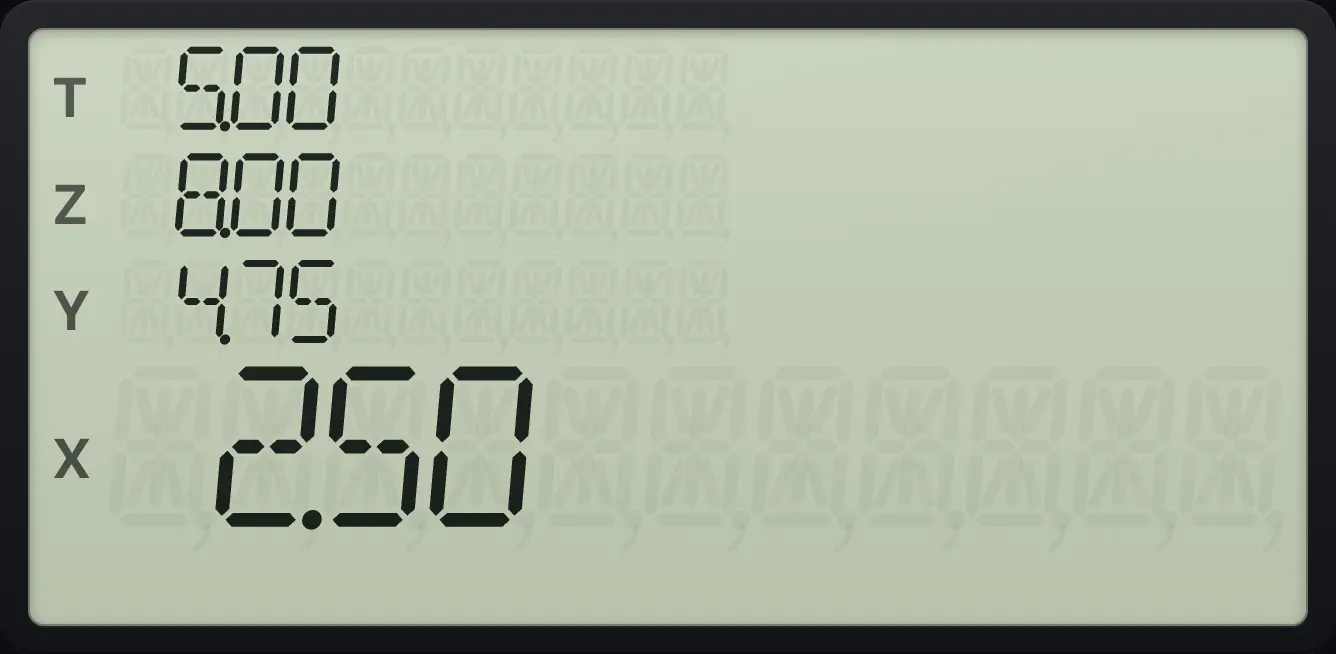
x̄ = 2.50 in X, ȳ = 4.75 in Y.Standard deviation
Enter the data, then press g, s and show four decimals.
2ENTER1Σ+4ENTER2Σ+5ENTER3Σ+8ENTER4Σ+gs.f4
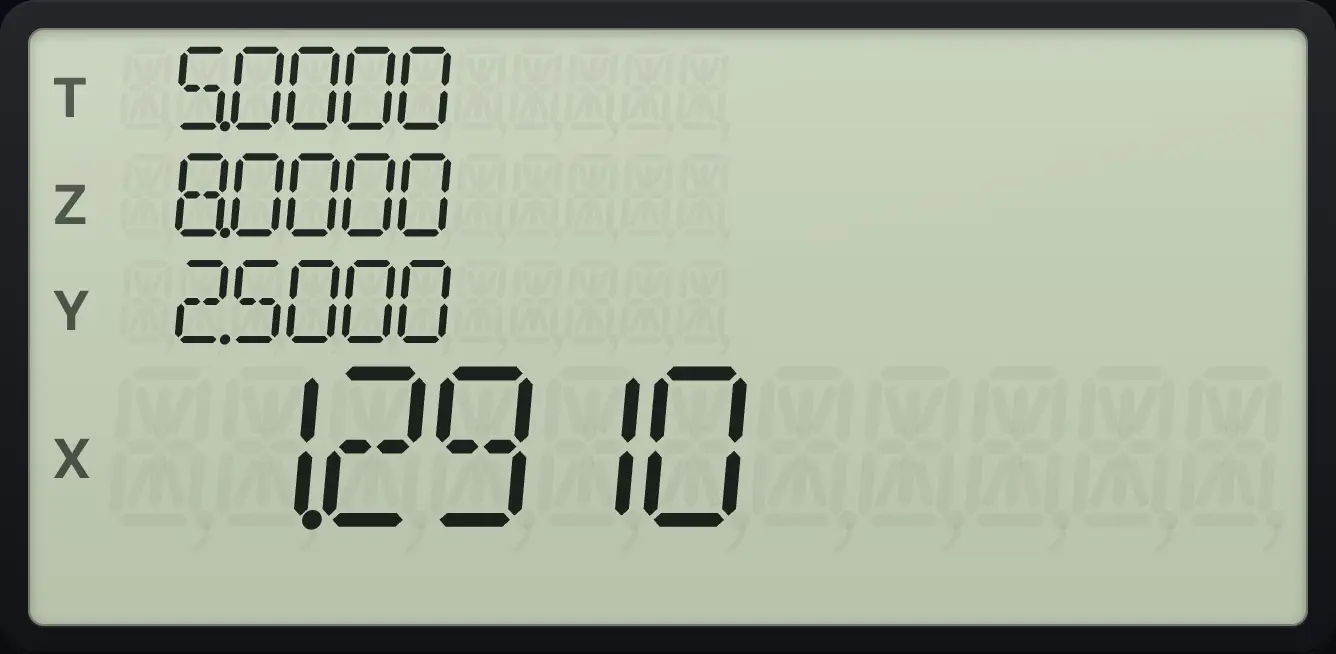
s of x is 1.2910 (in X).No data is an error
Press g, x̄ before entering anything.
gx̄0
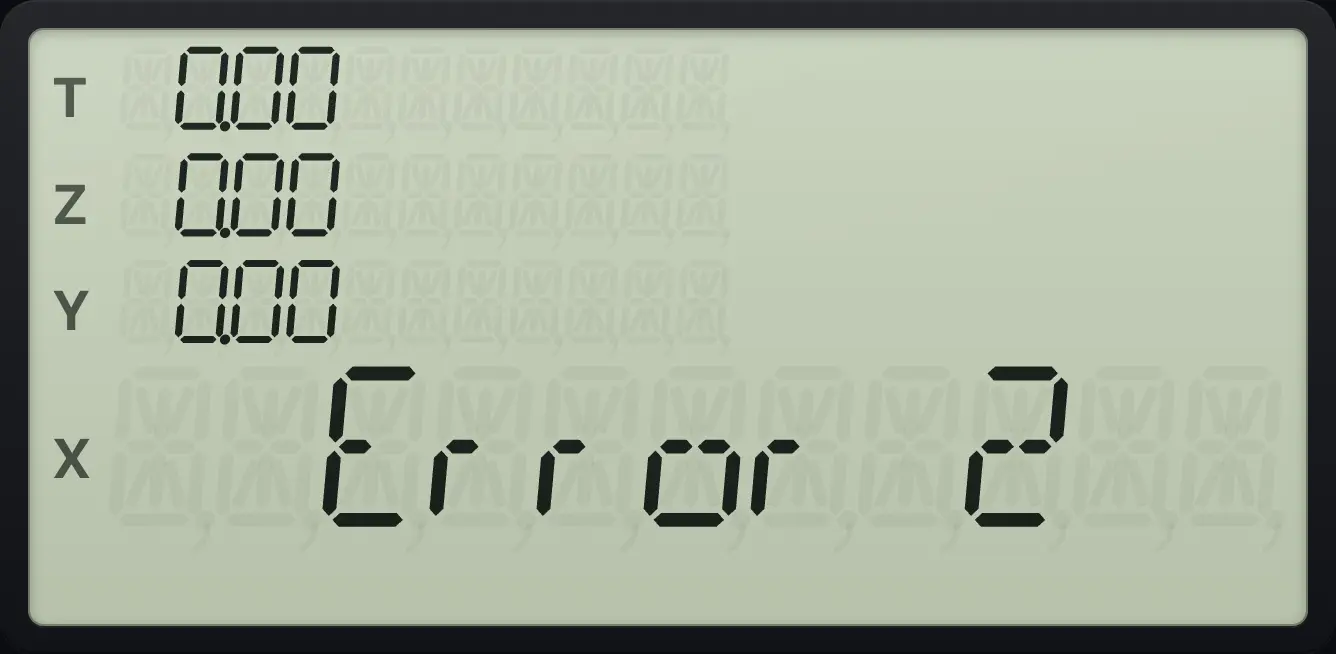
Error 213.3Estimate y from x and x from y#
Key in an x value and press gŷ,r2 (ŷ,r) to estimate y from the fitted line. Key in a y value and press gx̂,r1 (x̂,r) to estimate x. In both cases the estimate appears in X and the correlation coefficient r in Y.
Estimate y when x is 5
Enter the data. Key in 5 and press g, ŷ,r.
2ENTER1Σ+4ENTER2Σ+5ENTER3Σ+8ENTER4Σ+5gŷ,r2
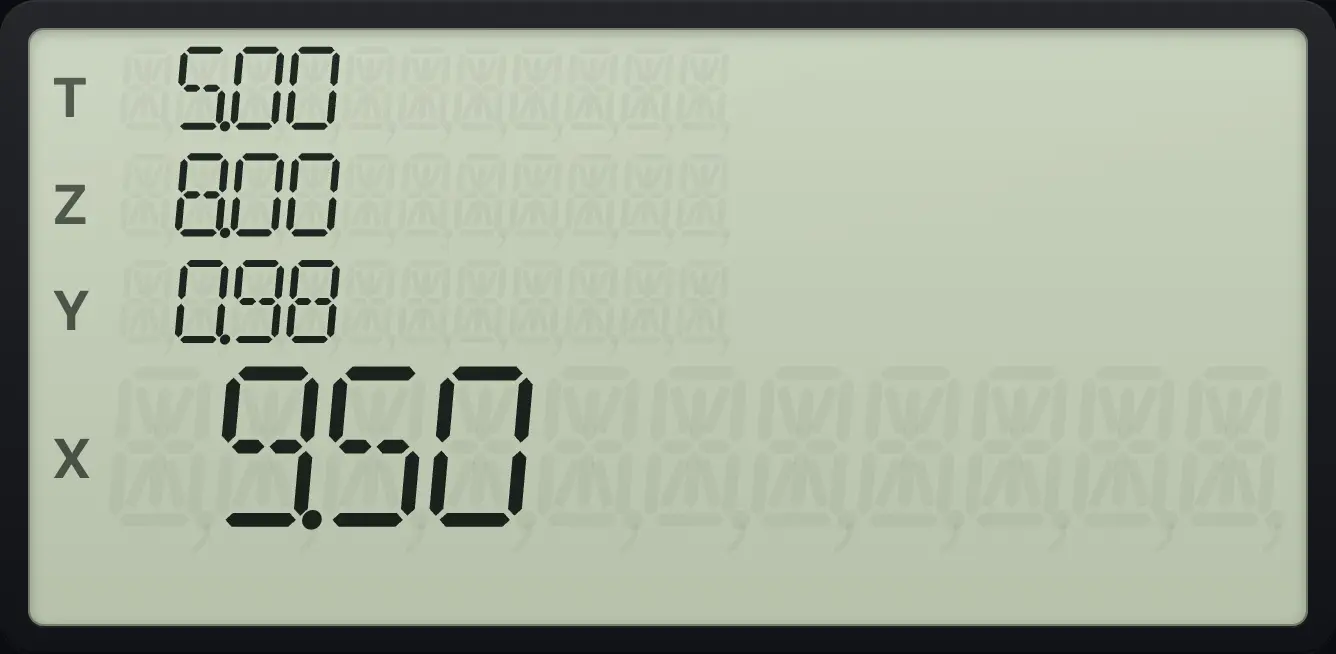
ŷ = 9.50.The correlation coefficient
Press x⇄y to see r, with four decimals.
2ENTER1Σ+4ENTER2Σ+5ENTER3Σ+8ENTER4Σ+5gŷ,r2x⇄yf4
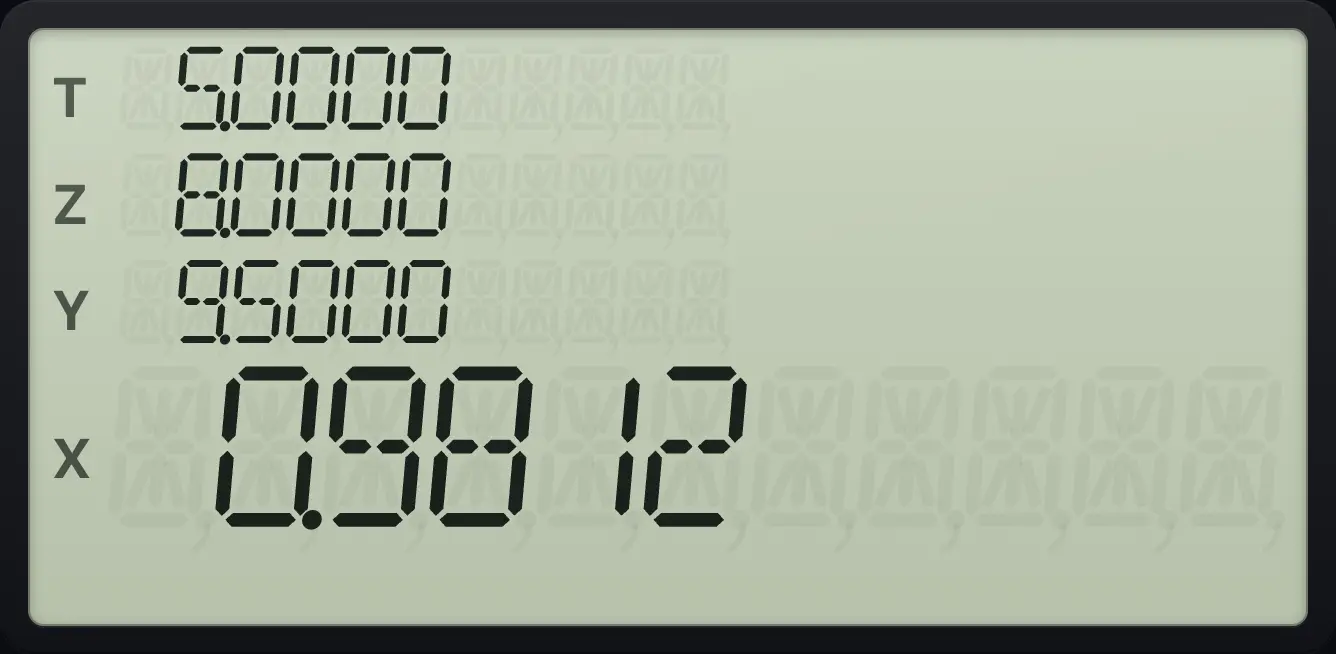
0.9812Estimate x when y is 10
Key in 10 and press g, x̂,r.
2ENTER1Σ+4ENTER2Σ+5ENTER3Σ+8ENTER4Σ+10gx̂,r1f4
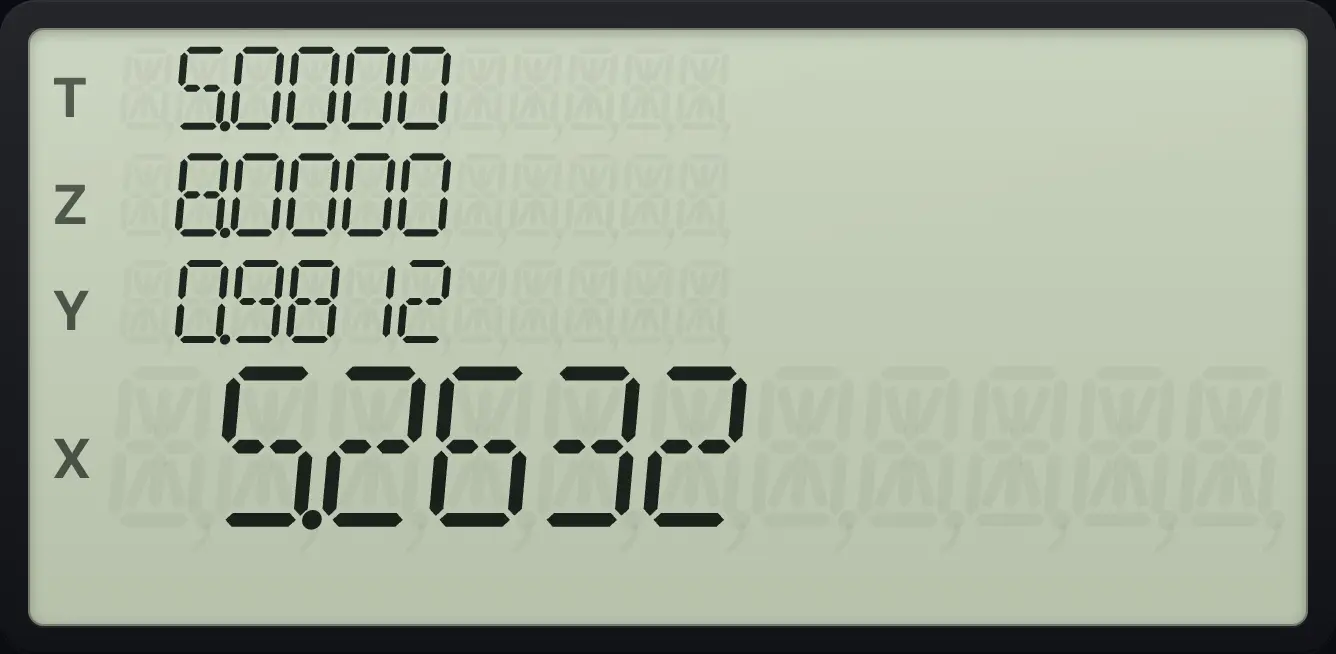
5.263213.4Weighted mean#
Enter each value as y with its weight as x (so key in the value, ENTER, the weight, Σ+). Then gx̄w6 (x̄w) gives the weighted mean of the values.
Weighted mean of the sample data
After entering the four points, press g, x̄w.
2ENTER1Σ+4ENTER2Σ+5ENTER3Σ+8ENTER4Σ+gx̄w6
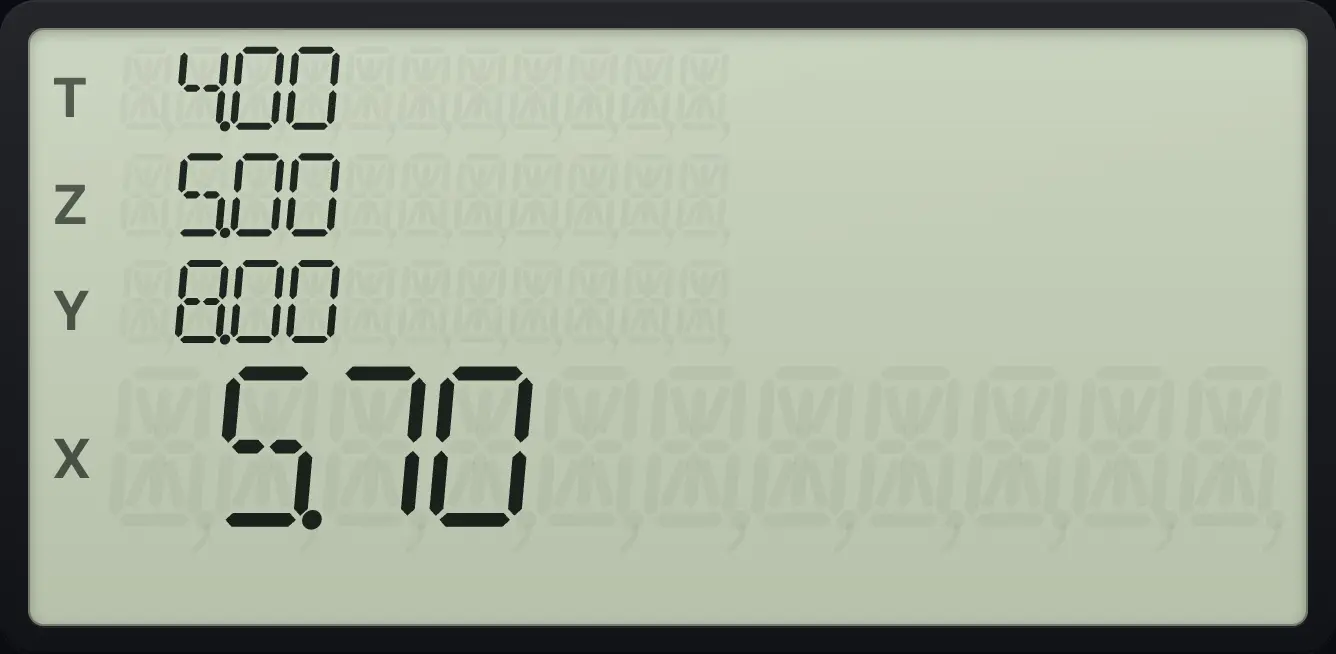
5.7013.5Remove or correct a data point#
To remove a point you entered by mistake, key in exactly the same y and x, and press gΣ−Σ+ (Σ−). The count goes down by one. To fix a point, remove the wrong one and then enter the right one.
Remove a point
Enter four points, then remove the last one with Σ−. Recall R1 for n.
2ENTER1Σ+4ENTER2Σ+5ENTER3Σ+8ENTER4Σ+8ENTER4gΣ−Σ+RCL1
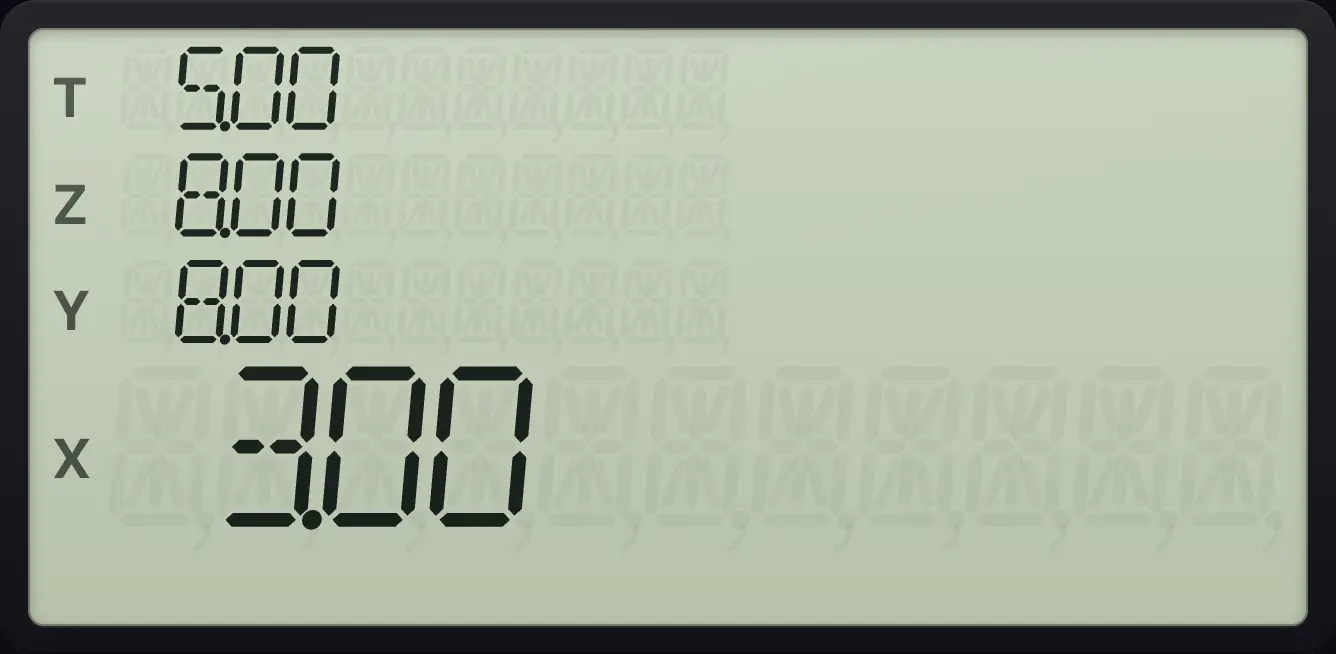
3.0013.6Read the sums#
Recall any statistics register with RCL: RCL 1 gives n, RCL 2 gives Σx, RCL 4 gives Σy and so on.
The sum of x
After entering the data, recall R2.
2ENTER1Σ+4ENTER2Σ+5ENTER3Σ+8ENTER4Σ+RCL2
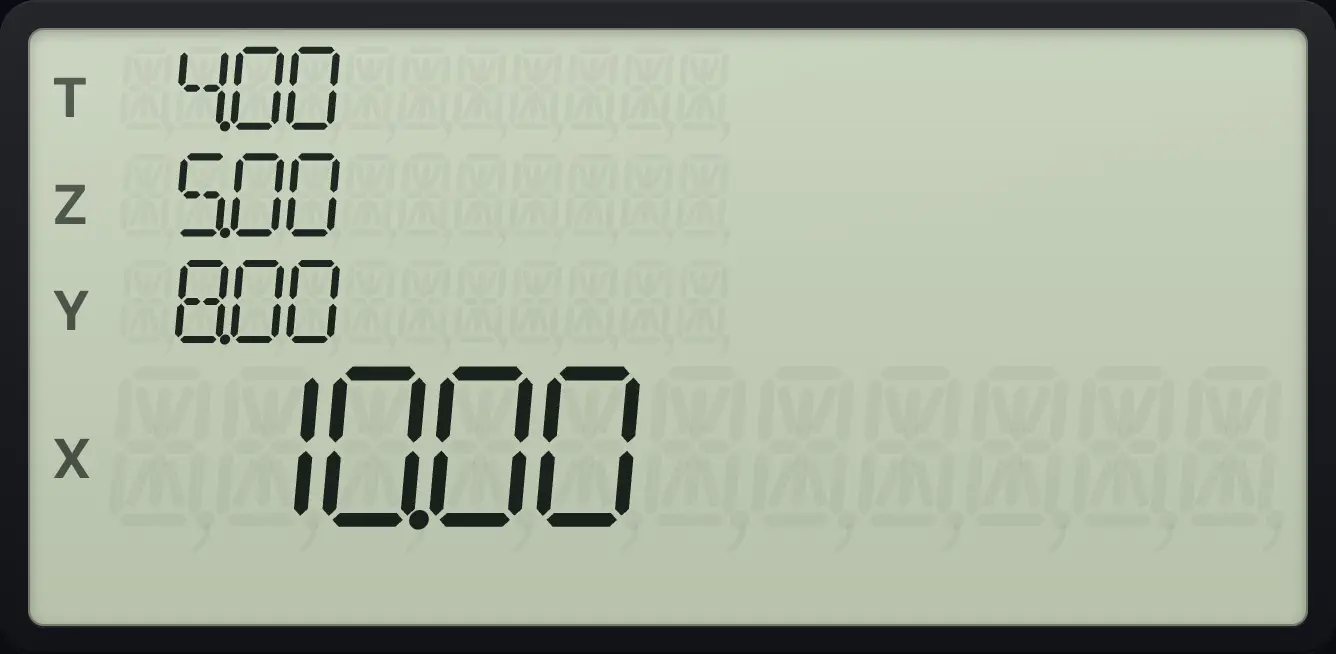
10.00HP 12C is a trademark of HP Inc.. Trident Calculator is an independent product by South View Studios and is not affiliated with, sponsored by or endorsed by HP. The name is used only to describe the kind of calculator this model resembles; Trident's names, keys, display, fonts and software are its own clean-room design.