
RPN Advanced 42 manual · Chapter 11 of 18
Statistics
Enter data pairs with sigma-plus, then read means, deviations, sums, and fit a straight line.
11.1Enter data points#
Each data point is a pair: put y in Y and x in X, then press Σ+. After each point the display shows the number of points so far. For one-variable data, enter any y (for example 0) and the x values. Shift Σ+ removes a point you entered by mistake. The sums live in registers 11 to 16.
Add three data points
Enter (x, y) = (2, 1), (4, 2), (7, 3) as y ENTER x Σ+.
1ENTER2Σ+2ENTER4Σ+3ENTER7Σ+
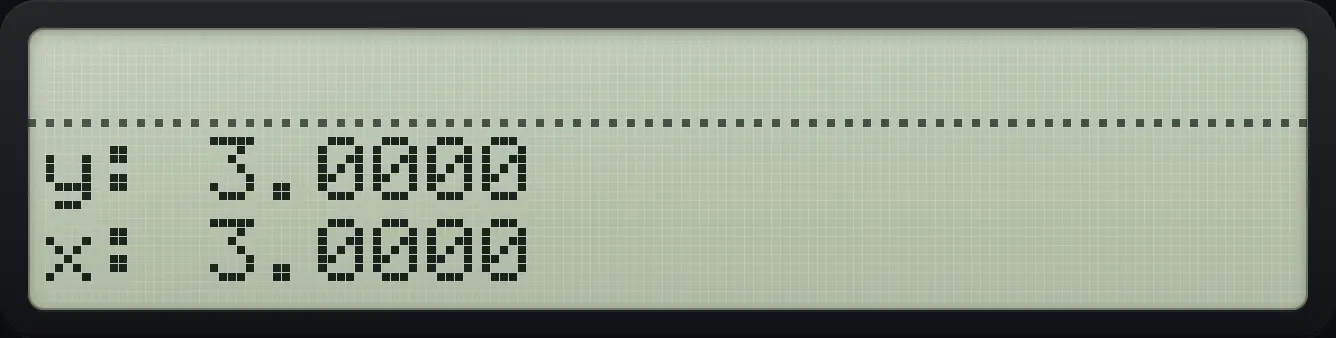
x: 3.0000Remove a point
Add a point and remove it again; the count returns to zero.
2ENTER1Σ+2ENTER1⇧Σ−Σ+
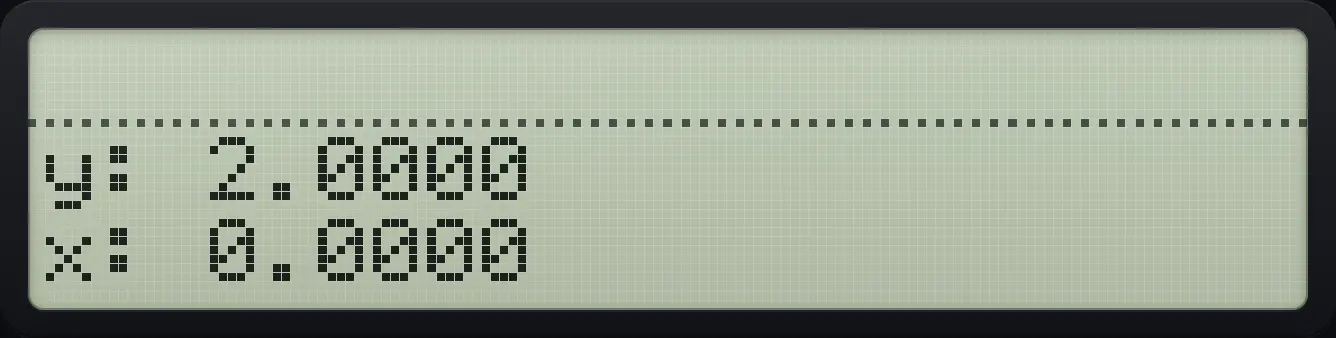
x: 0.000011.2The STAT menu: sums, mean and deviation#
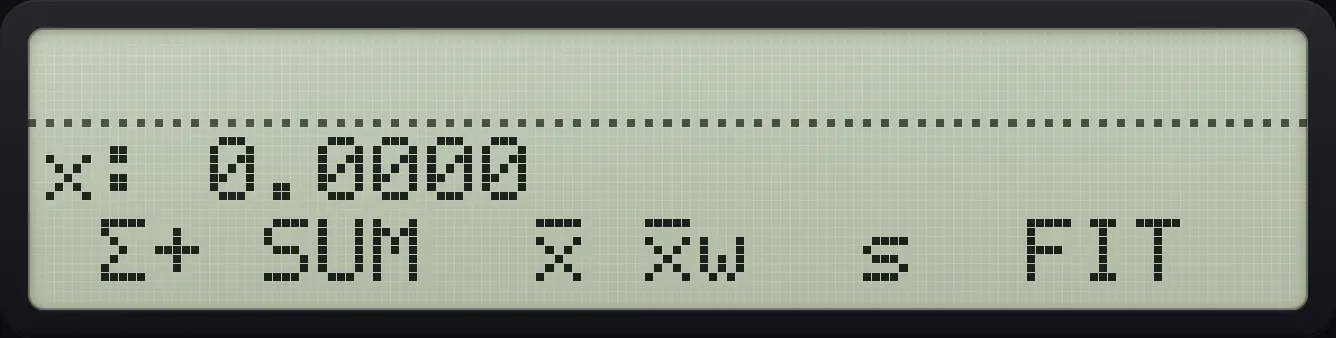
| Label | Result |
|---|---|
| Σ+ | Adds the point (same as the key). |
| SUM | X = sum of x, Y = sum of y. |
| x̄ (MEAN) | X = mean of x, Y = mean of y. |
| x̄w (WMN) | Weighted mean of x using y as the weights. |
| s (SDEV) | X = sample standard deviation of x, Y = of y. |
| FIT | Opens the line-fit menu. |
Mean of x
Enter the three points, open STAT and press the mean key (third).
1ENTER2Σ+2ENTER4Σ+3ENTER7Σ+⇧STAT÷√x
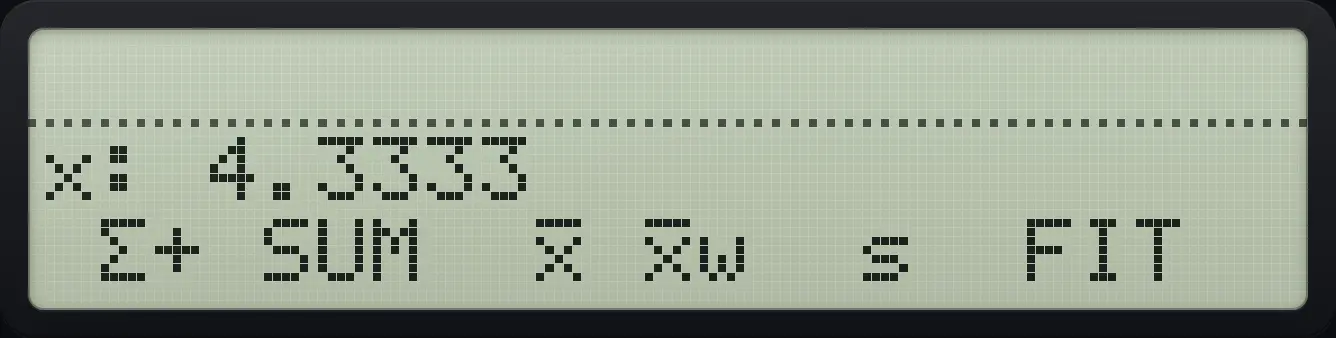
x: 4.3333Sum of x
The SUM key (second).
1ENTER2Σ+2ENTER4Σ+3ENTER7Σ+⇧STAT÷1/x
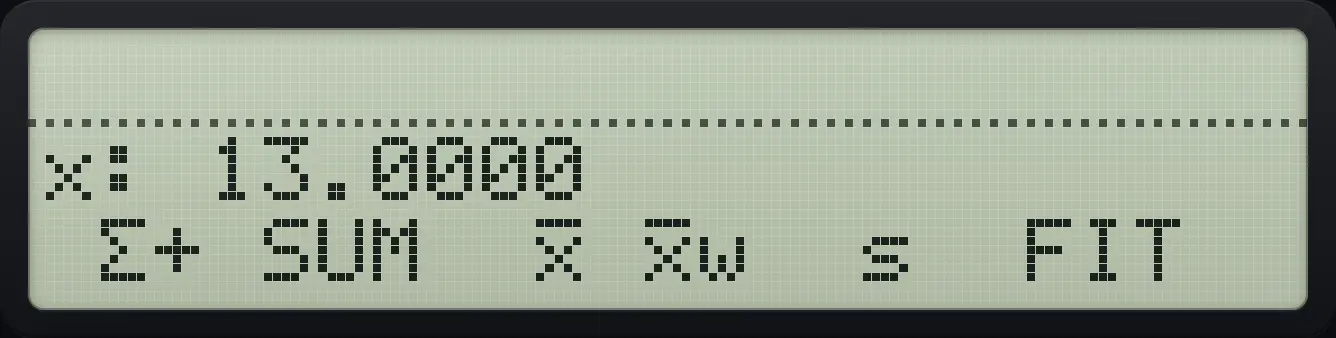
x: 13.0000Standard deviation of x
The s key (fifth).
1ENTER2Σ+2ENTER4Σ+3ENTER7Σ+⇧STAT÷LN
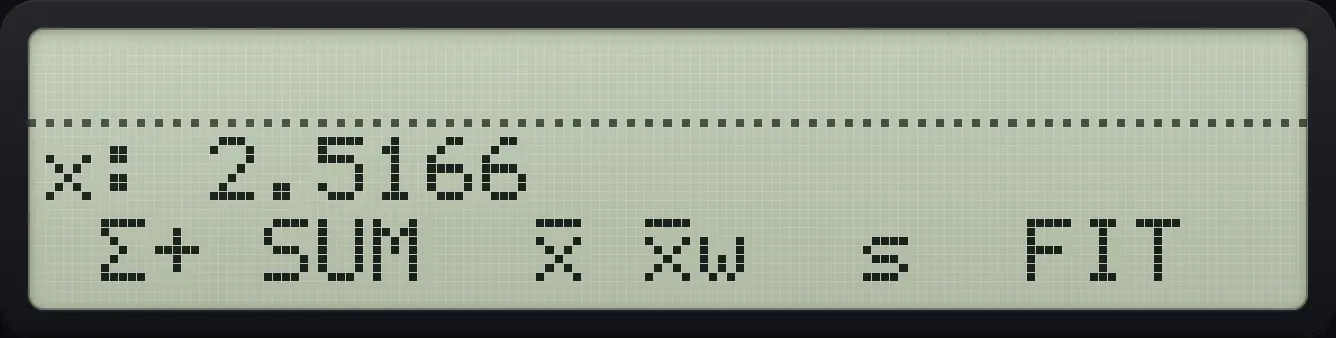
x: 2.5166Weighted mean
The fourth key.
1ENTER2Σ+2ENTER4Σ+3ENTER7Σ+⇧STAT÷LOG
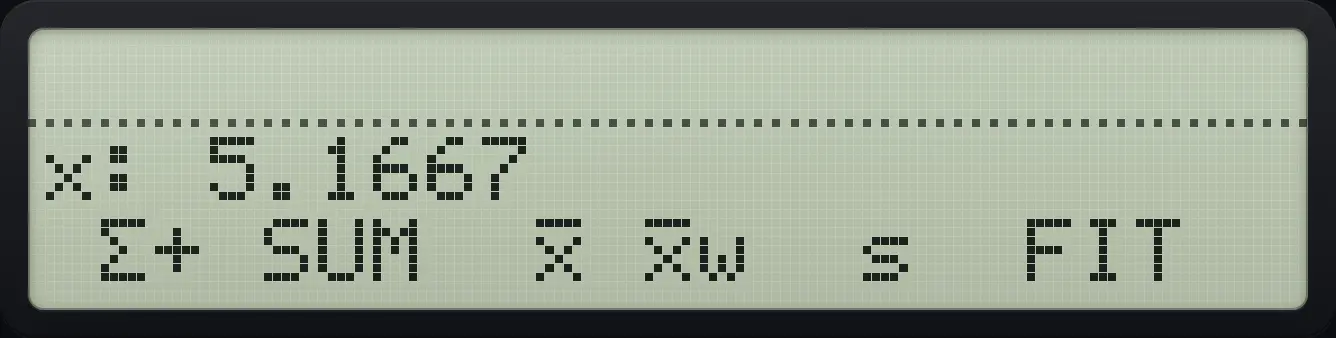
x: 5.1667See also Find the mean and spread of one listSummarise paired data (x and y)
11.3Fit a straight line and forecast#
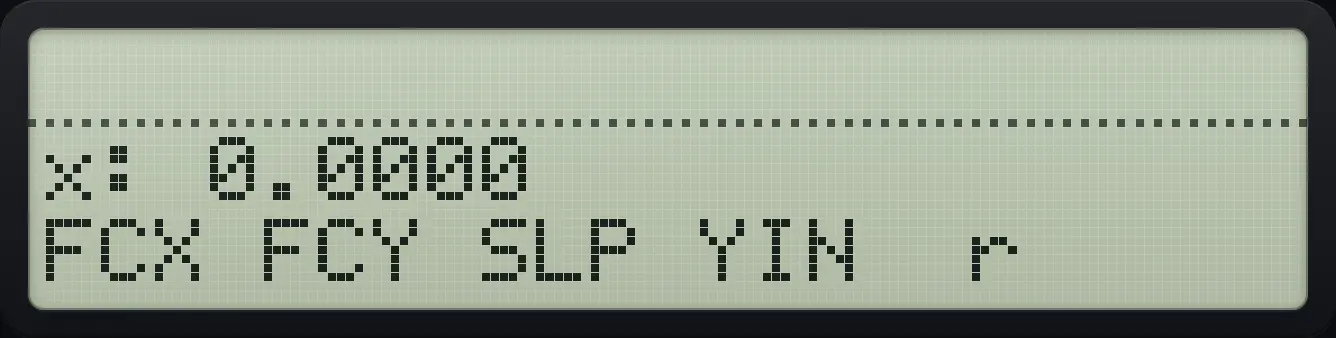
FIT (sixth key of STAT) opens the line-fit menu: FCX, FCY, SLP, YIN and r. They use the least-squares line .
Slope of a perfect line
Points (1,3), (2,5), (3,7) lie on y = 2x + 1. Open STAT, FIT, SLP (third).
3ENTER1Σ+5ENTER2Σ+7ENTER3Σ+⇧STAT÷XEQ√x
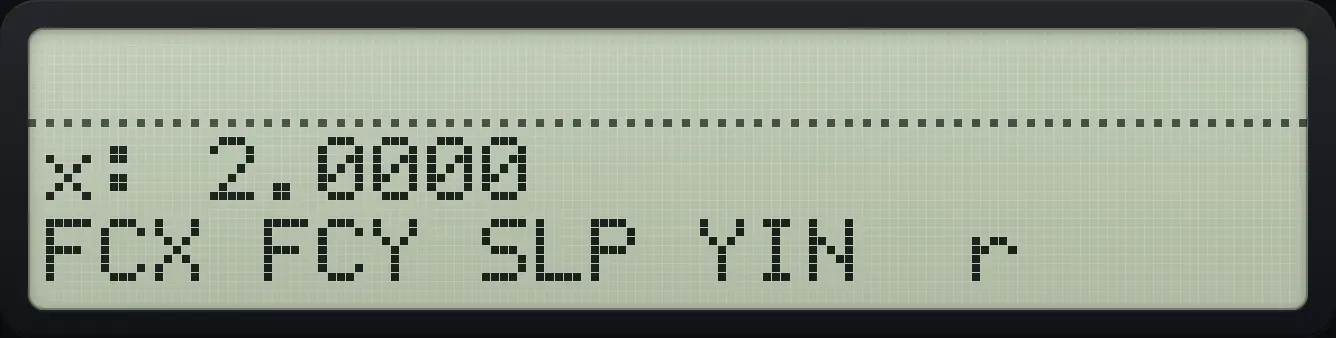
x: 2.0000Intercept of the line
YIN is the fourth key.
3ENTER1Σ+5ENTER2Σ+7ENTER3Σ+⇧STAT÷XEQLOG
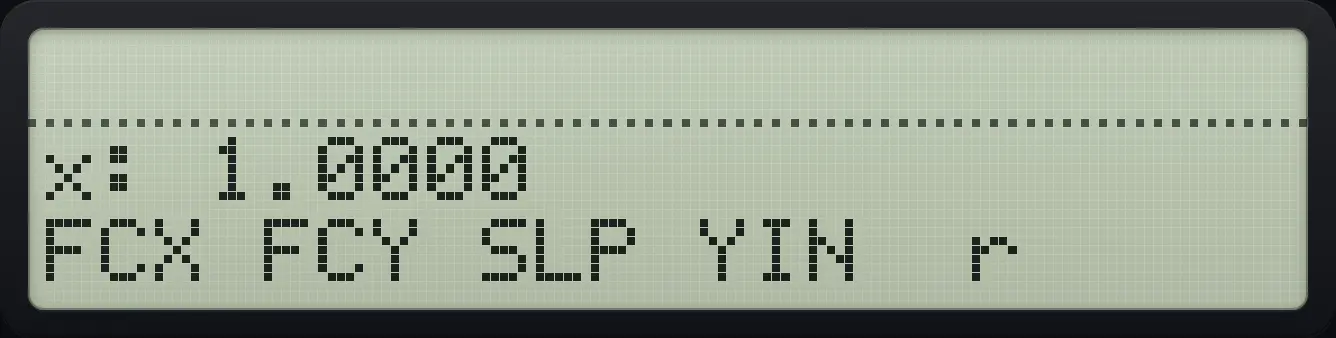
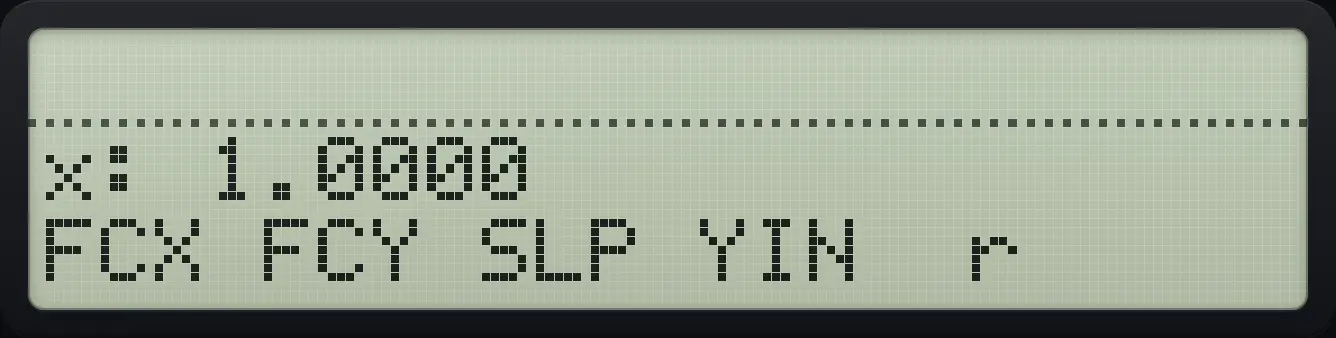
x: 1.0000Correlation
The r key is the fifth.
3ENTER1Σ+5ENTER2Σ+7ENTER3Σ+⇧STAT÷XEQLN
x: 1.0000Forecast y at x = 10
Type 10 and press FCY (second key).
3ENTER1Σ+5ENTER2Σ+7ENTER3Σ+⇧STAT÷XEQ101/x
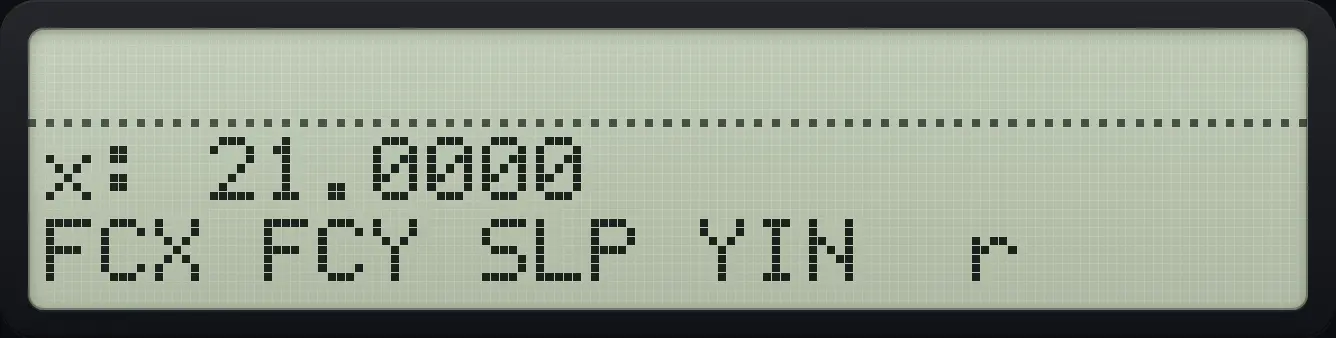
x: 21.0000Forecast x for y = 9
Type 9 and press FCX (first key).
3ENTER1Σ+5ENTER2Σ+7ENTER3Σ+⇧STAT÷XEQ9Σ+
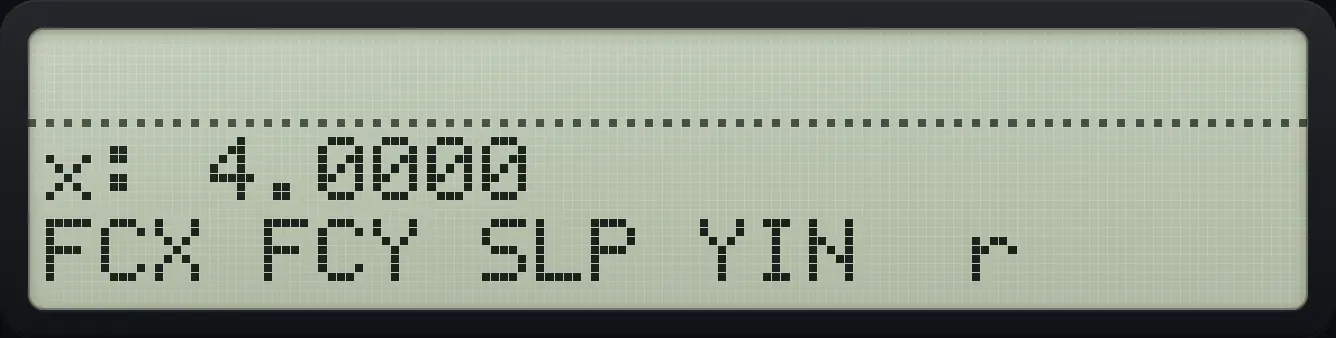
x: 4.0000See also Fit a straight line to data
11.4Clear the statistics#
Clear the sums
Add a point, open CLEAR and press CLΣ, then look at register 16 (the count).
2ENTER1Σ+⇧CLEAR←Σ+EXITRCL16
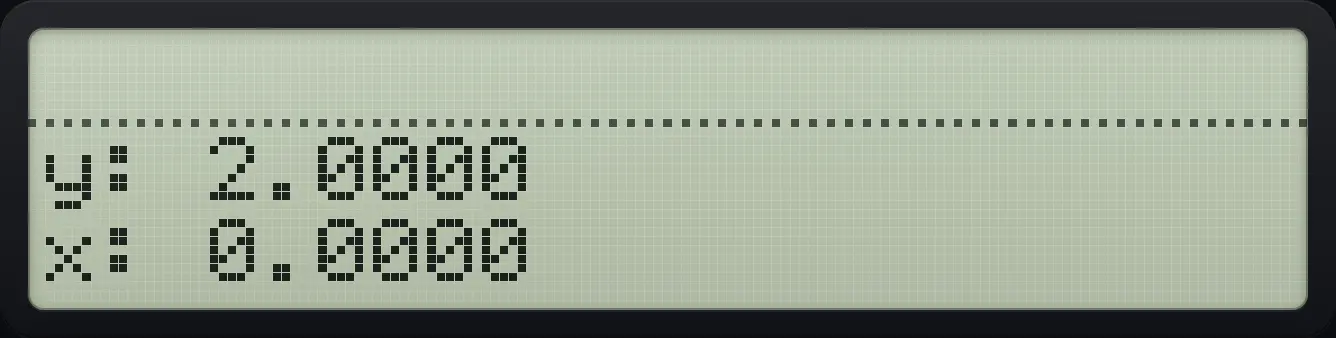
x: 0.0000HP-42S is a trademark of HP Inc.. Trident Calculator is an independent product by South View Studios and is not affiliated with, sponsored by or endorsed by HP. The name is used only to describe the kind of calculator this model resembles; Trident's names, keys, display, fonts and software are its own clean-room design.