
Classic Scientific 30 manual · Chapter 10 of 13
Data editor and statistics
Enter data in lists L1 to L3, then find one-variable statistics, two-variable statistics and regressions.
10.1Enter data in a list#
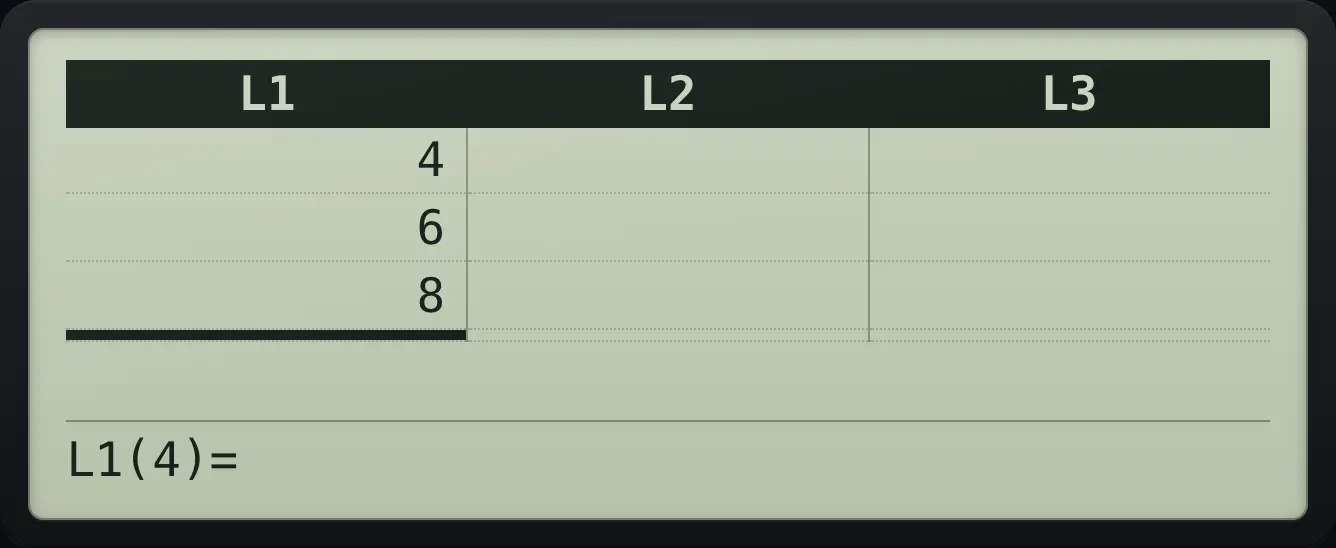
Press data to open the data editor. It has three columns, L1, L2 and L3. The bottom line tells you which cell is selected. Type a number and press enter to store it and move down. Use ▶ and ◀ to change column and ▲ and ▼ to change row. delete removes the selected row of that list.
Type three values
Open the editor and type 4, 6 and 8.
data4enter6enter8enter
L1 4 6 8Remove a value
Type 1, 2, 3, move up one row and press delete to remove the 3.
data1enter2enter3enter▲delete
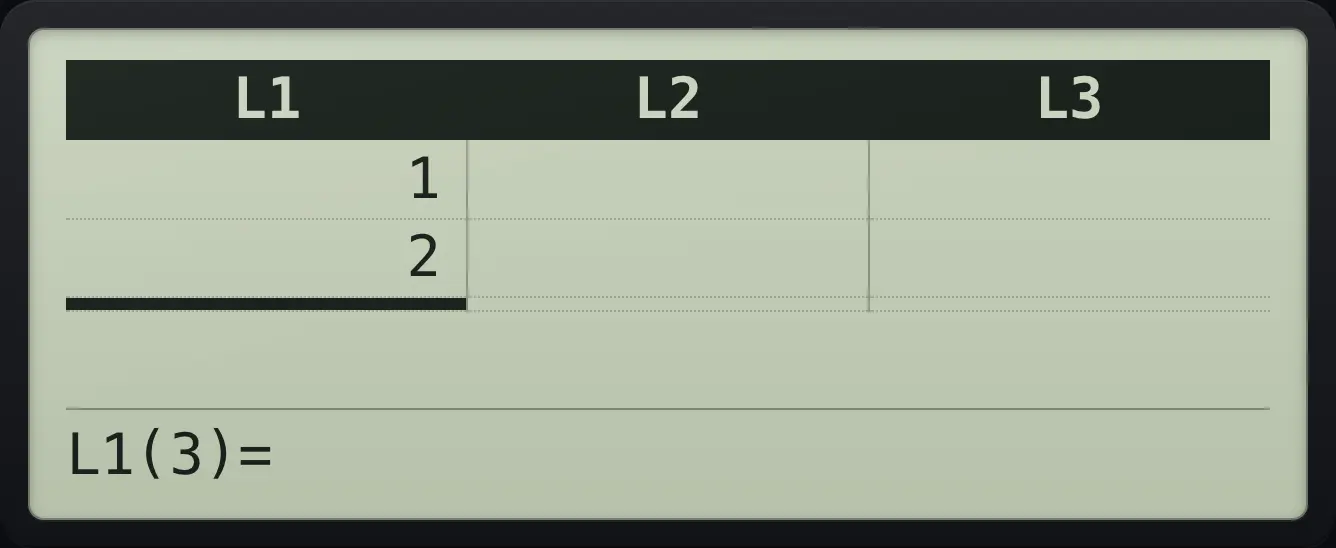
L1(3)=Clear a list
In the editor, press data again and choose Clear L1.
data1enter2enter3enterdata1
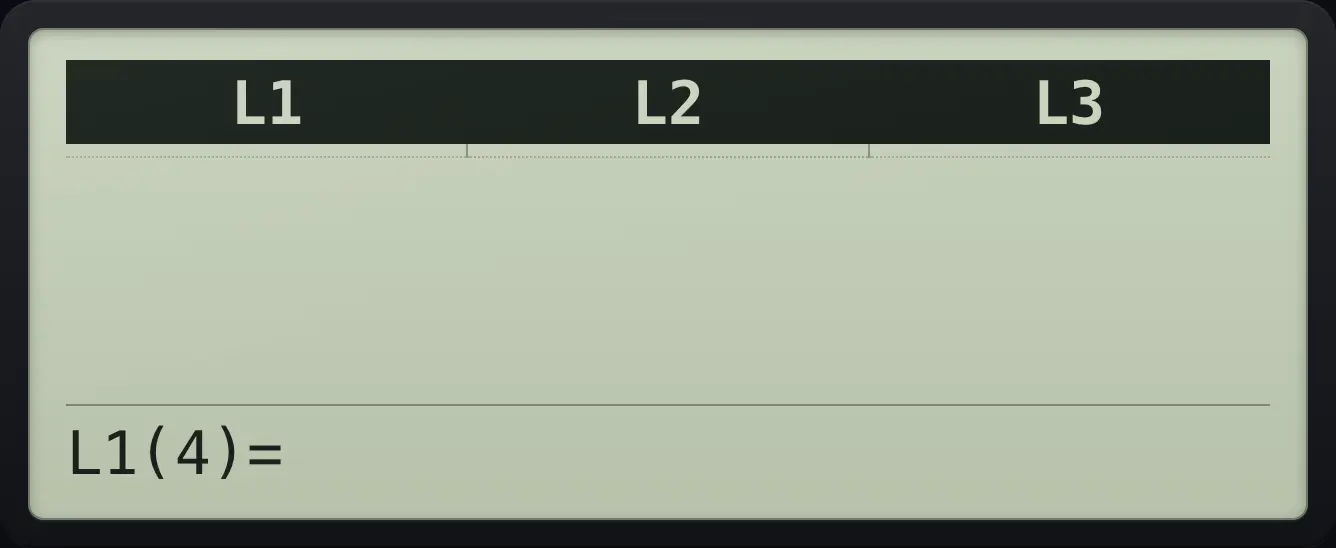
L1(4)=See also Enter data into a list
10.2Find the mean and standard deviation of one list#
- 2ndstatdata
- 1-Var Stats
- enter (DATA)
- enter (FRQ)
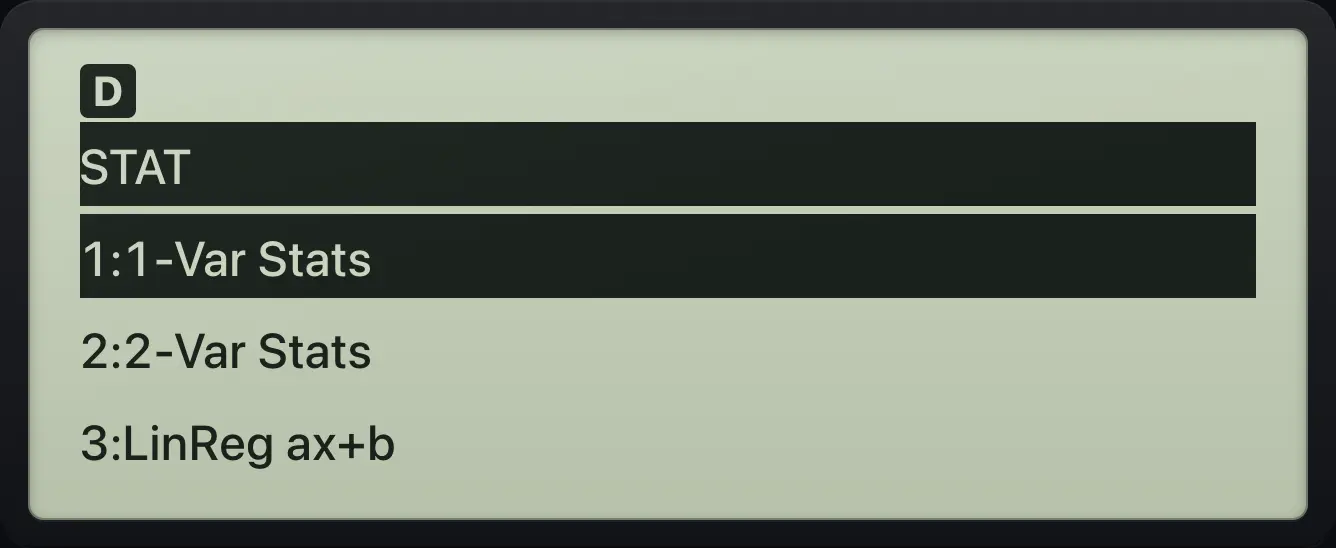
Press 2ndstatdata (STAT) and choose 1-Var Stats. A small form asks which list holds the data (DATA) and which list holds the frequencies (FRQ, or ONE if every value counts once). Press enter to move from field to field and to run it. Use ◀ and ▶ to change the choice in a field. The results appear as a list you scroll with ▼.
| Result | Meaning |
|---|---|
| n | How many values. |
| x̄ | The mean. |
| Sx | Sample standard deviation. |
| σx | Population standard deviation. |
| Σx, Σx² | Sum of the values and of their squares. |
| minX, Q1, Med, Q3, maxX | The five-number summary. |
Mean of 1 to 5
Enter 1 to 5 in L1, then run 1-Var Stats with the start choices.
data1enter2enter3enter4enter5enter2ndstatdata1enterenter
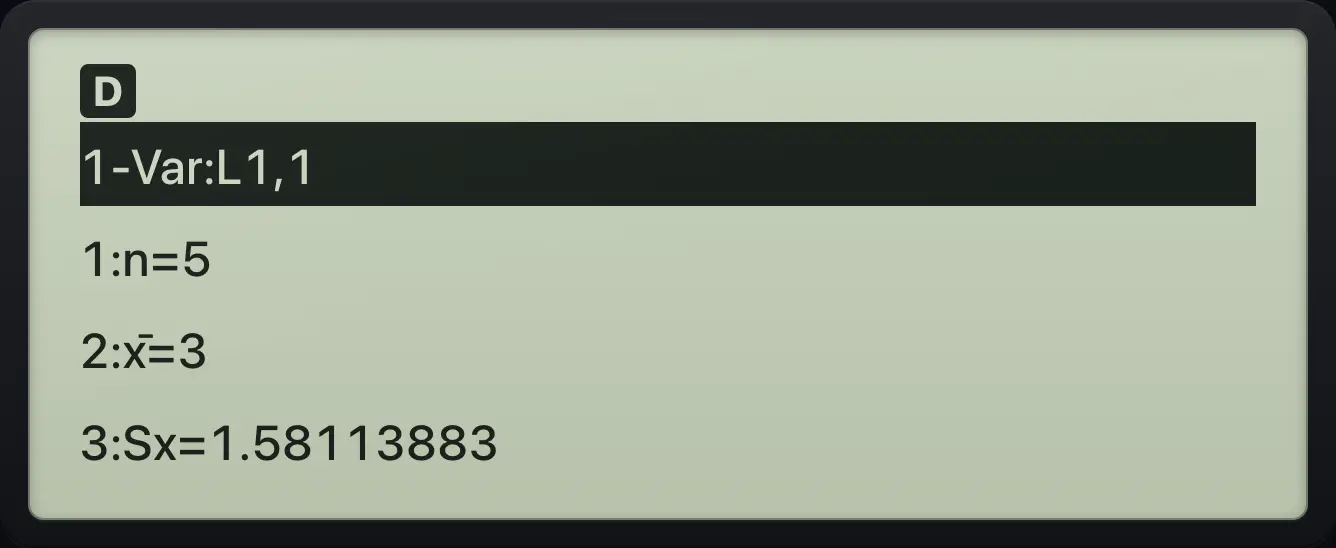
1:n=5 2:x̄=3 3:Sx=1.58113883Scroll to the sums
Scroll down to see the sums.
data4enter6enter8enter2ndstatdata1enterenter▼▼▼
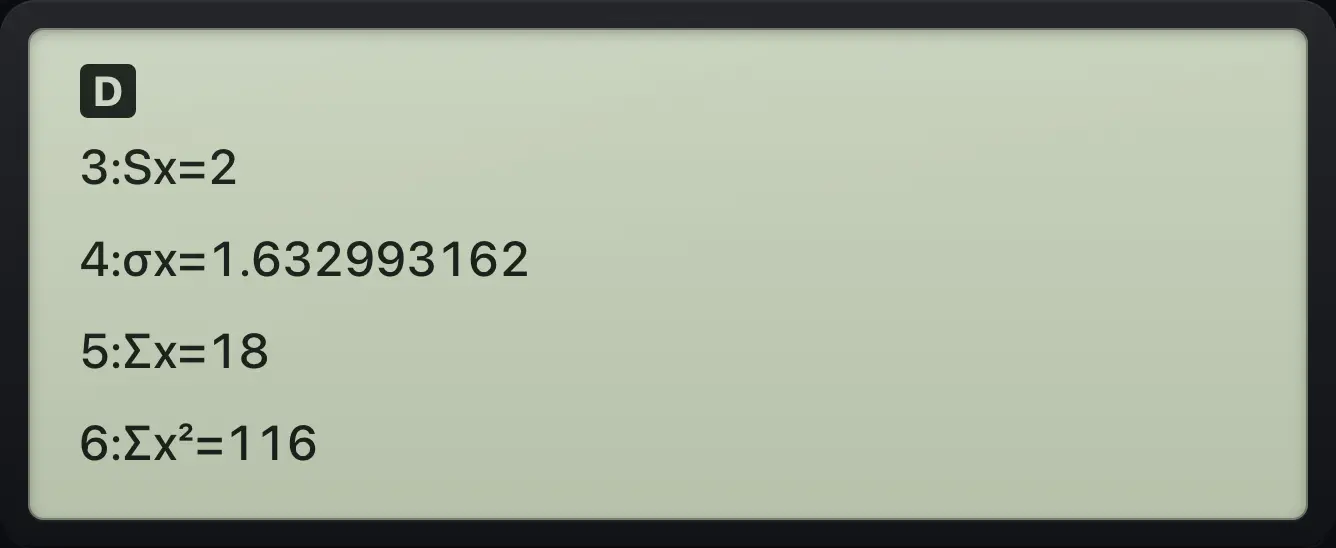
5:Σx=18 6:Σx²=116Median and quartiles
Scroll further down to see Q1, Med and Q3.
data1enter2enter3enter4enter5enter2ndstatdata1enterenter▼▼▼▼▼▼▼▼▼▼
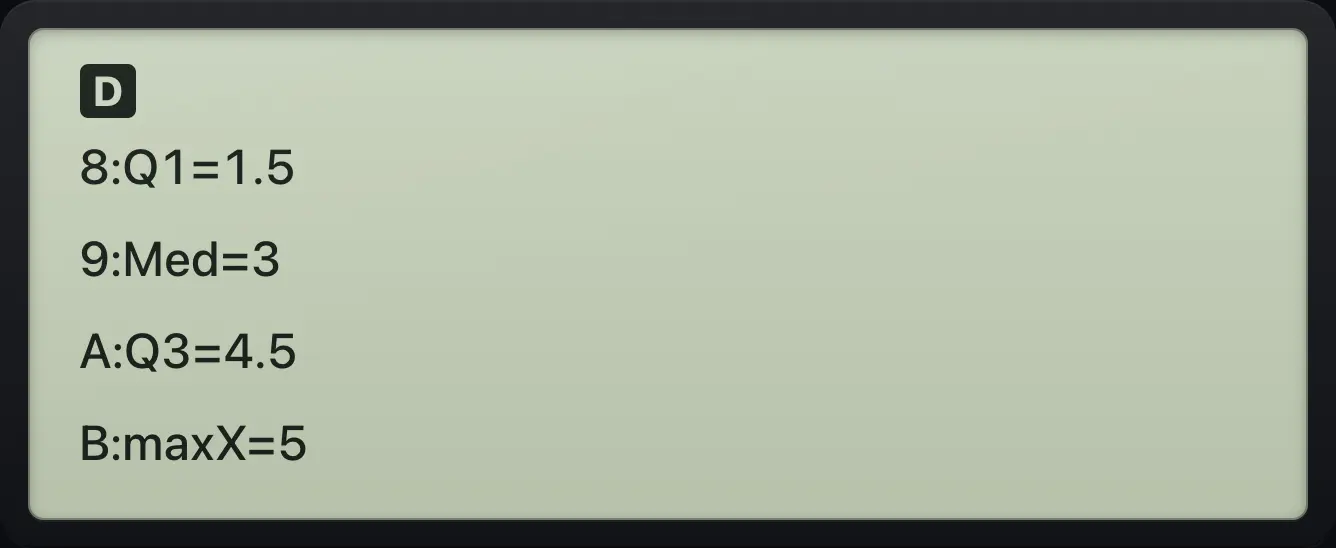
8:Q1=1.5 9:Med=3 A:Q3=4.5Use frequencies
Put the values in L1 and how many times each occurs in L2. Choose L2 as the FRQ.
data1enter2enter3enter▶▲▲▲2enter1enter1enter2ndstatdata1enter▶▶enter
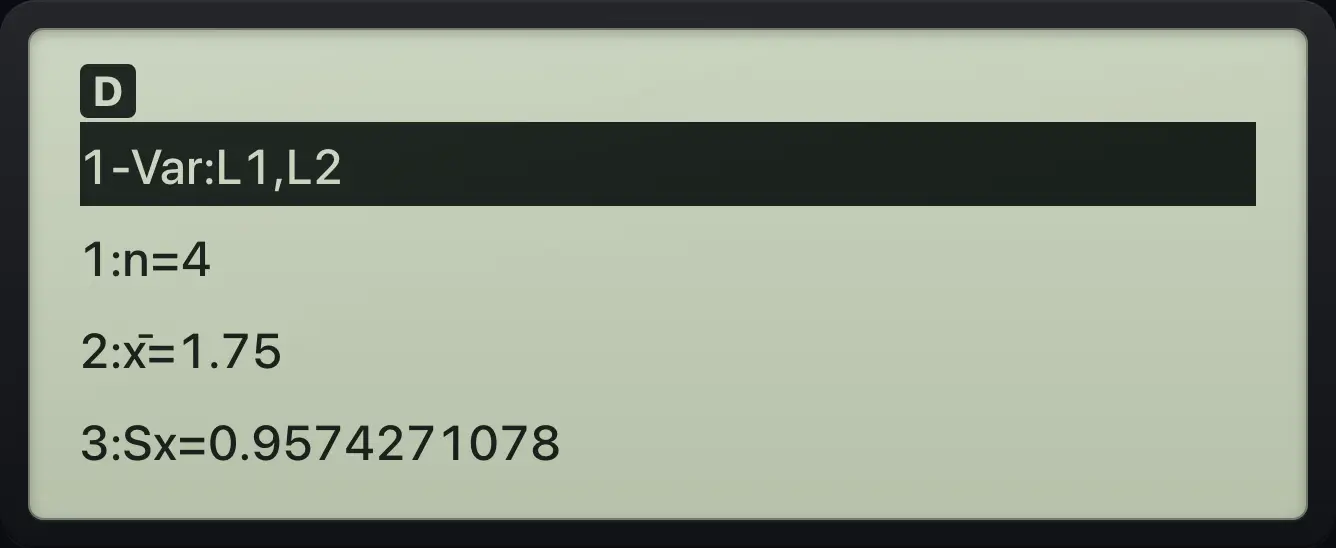
1-Var:L1,L2 1:n=4 2:x̄=1.75See also Find the mean and spread of one listUse frequencies (how many times each value occurs)Find the standard deviationFind the mean, median and mode
10.3Find statistics for two lists#
Put the x values in L1 and the y values in L2. Choose 2-Var Stats from the STAT menu. You get n, the means, both standard deviations, the sums, and the line of best fit (a, b and the correlation r).
Two-variable results
Enter x = 1, 2, 3, 4 in L1 and y = 3, 5, 4, 7 in L2, then run 2-Var Stats.
data1enter2enter3enter4enter▶▲▲▲▲3enter5enter4enter7enter2ndstatdata2enterenterenter
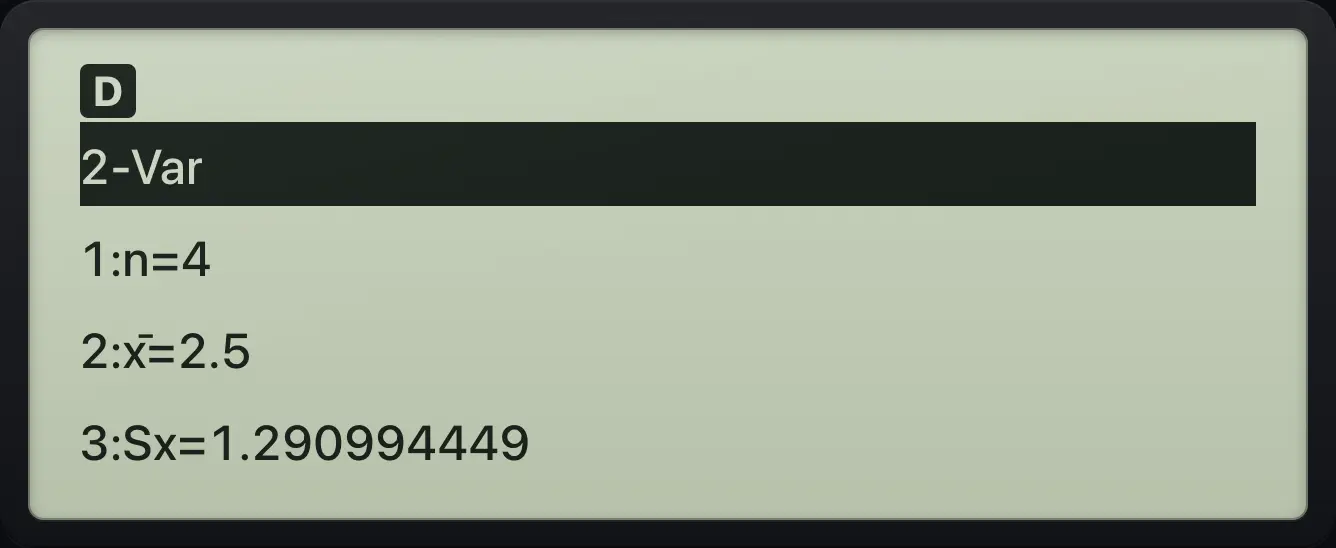
2-Var 1:n=4 2:x̄=2.5Scroll to the line of best fit
Scroll down to see a, b and r.
data1enter2enter3enter4enter▶▲▲▲▲3enter5enter4enter7enter2ndstatdata2enterenterenter▼▼▼▼▼▼▼▼▼▼▼▼▼
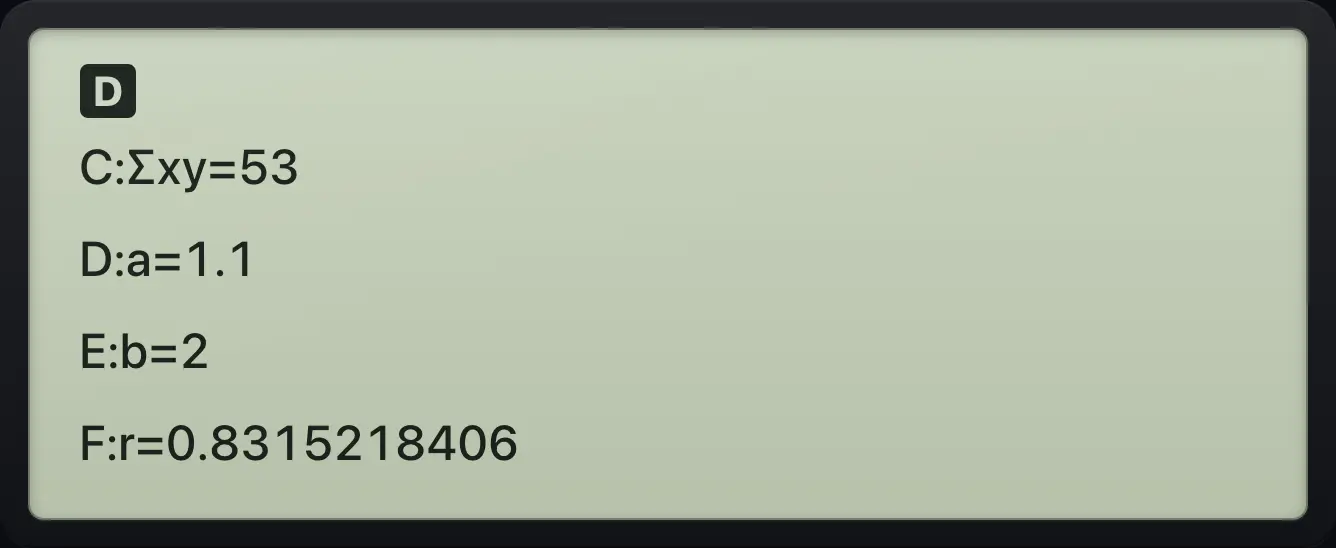
D:a=1.1 E:b=2 F:r=0.8315218406See also Summarise paired data (x and y)Measure how strongly two lists are related
10.4Find a line, parabola or exponential of best fit#
STAT items 3, 4 and 5 fit a curve to the points in two lists: LinReg ax+b (a straight line), QuadraticReg (ax²+bx+c) and ExpReg (a·bˣ). Fill in the xDATA, yDATA and FRQ fields as in 2-Var Stats.
Fit a straight line
Enter x = 1, 2, 3, 4 and y = 3, 5, 4, 7, then choose LinReg ax+b.
data1enter2enter3enter4enter▶▲▲▲▲3enter5enter4enter7enter2ndstatdata3enterenterenter
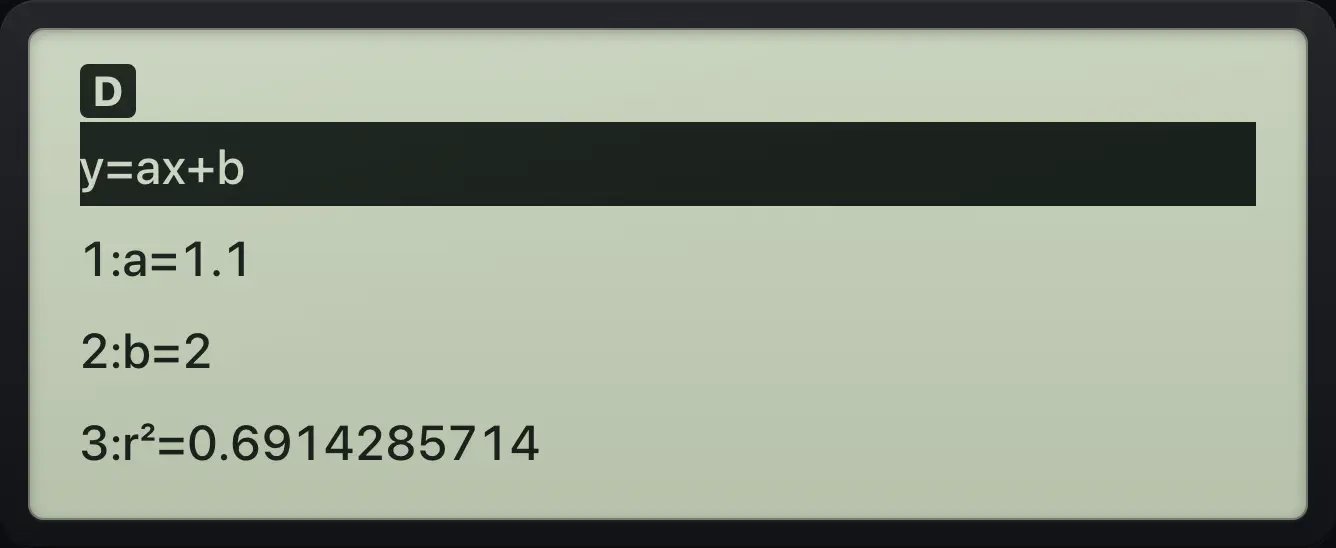
y=ax+b 1:a=1.1 2:b=2 3:r²=0.6914285714Fit a parabola
Choose QuadraticReg with the same data.
data1enter2enter3enter4enter▶▲▲▲▲3enter5enter4enter7enter2ndstatdata4enterenterenter
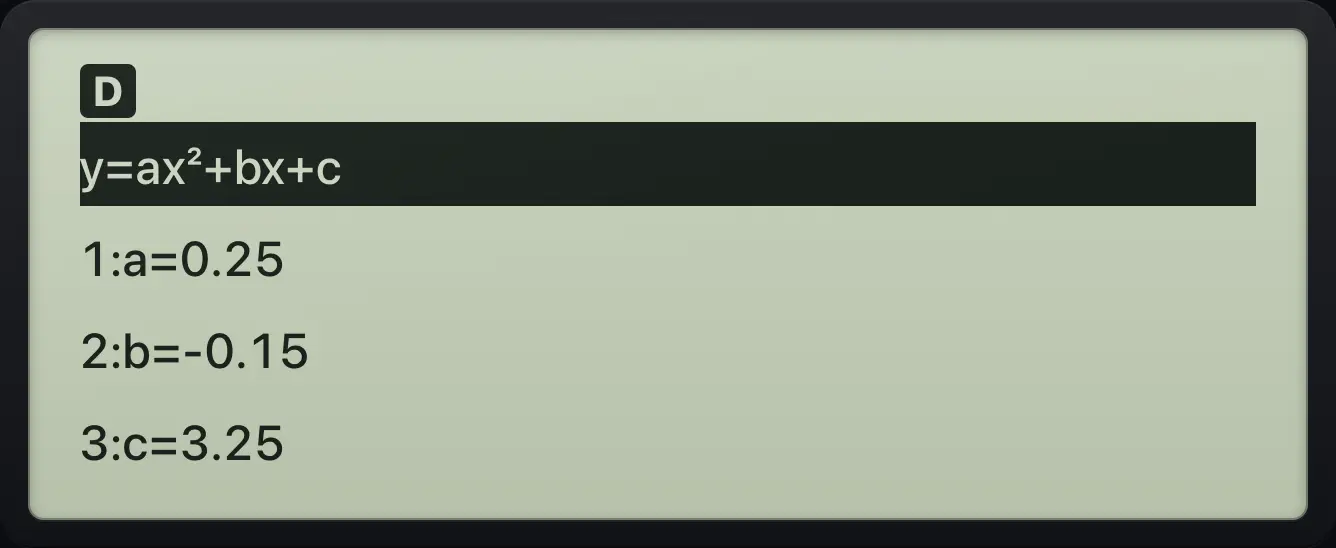
y=ax²+bx+c 1:a=0.25 3:c=3.25Fit an exponential curve
Choose ExpReg with the same data.
data1enter2enter3enter4enter▶▲▲▲▲3enter5enter4enter7enter2ndstatdata5enterenterenter
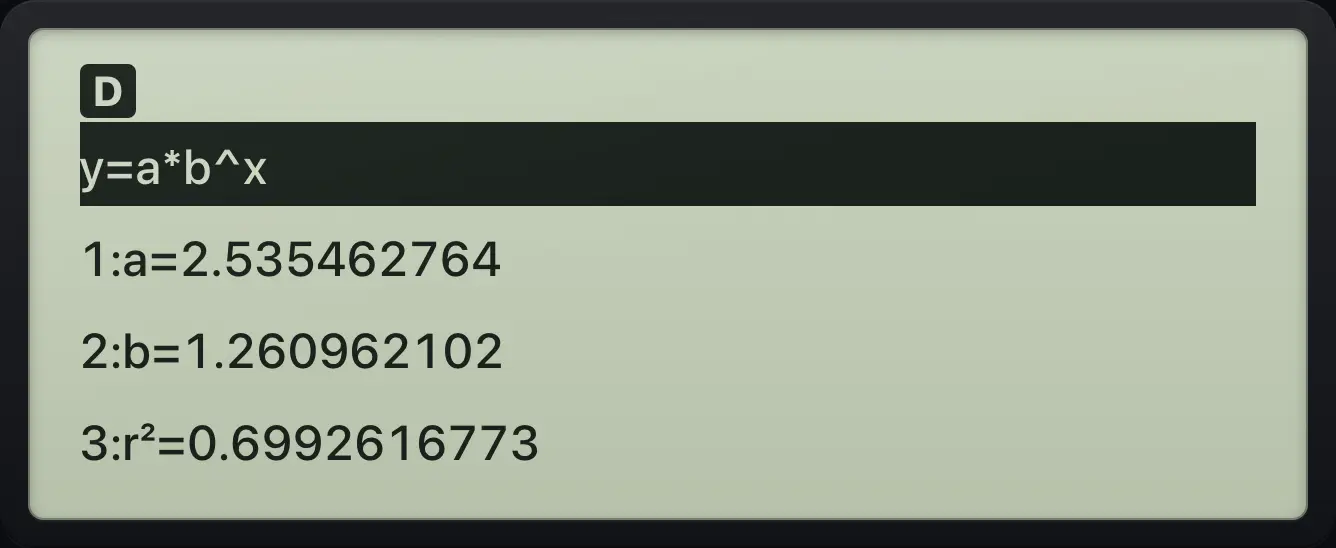
y=a*b^x 1:a=2.535462764 2:b=1.260962102See also Fit a straight line to dataFit a parabola to dataFit an exponential curve to data
TI-30XS MultiView is a trademark of Texas Instruments Incorporated. Trident Calculator is an independent product by South View Studios and is not affiliated with, sponsored by or endorsed by Texas Instruments. The name is used only to describe the kind of calculator this model resembles; Trident's names, keys, display, fonts and software are its own clean-room design.