
Classic CAS manual · Chapter 14 of 16
Graphing
Plot functions, trace, change the window, zoom, find zeros, extremes and intersections, and use parametric and polar graphs.
14.1The graphs page#
Press doc to open the Graphs page. It first shows the function list: f1(x) to f7(x). Type a rule in a line, press ▼ to go to the next line, and press enter or tab to draw. Press tab or esc on the graph to return to the list. Letters you have stored as variables can be used in the rules.
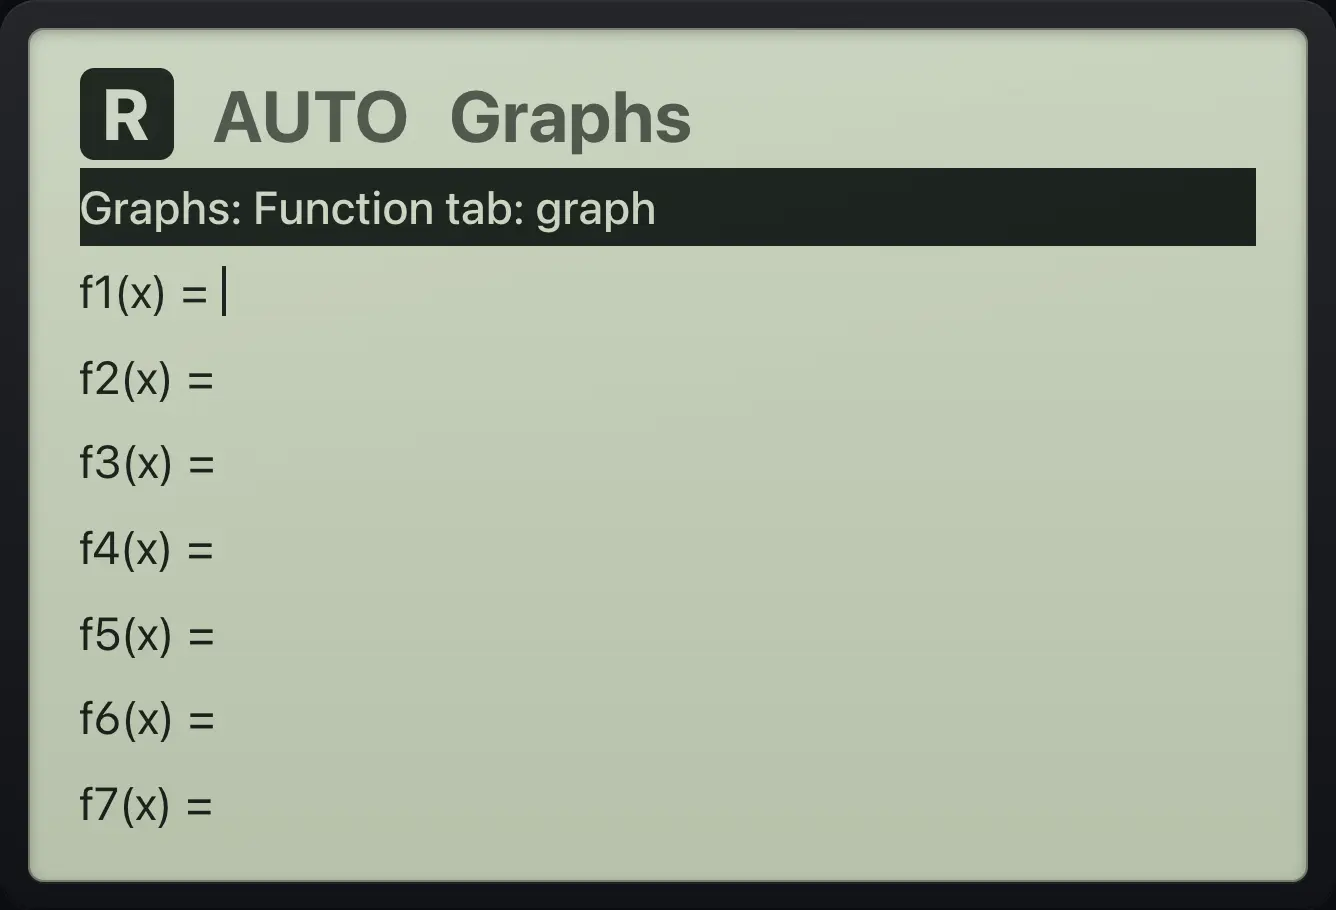
Plot a parabola
Press doc, then type x² − 4.
docx^2▶−4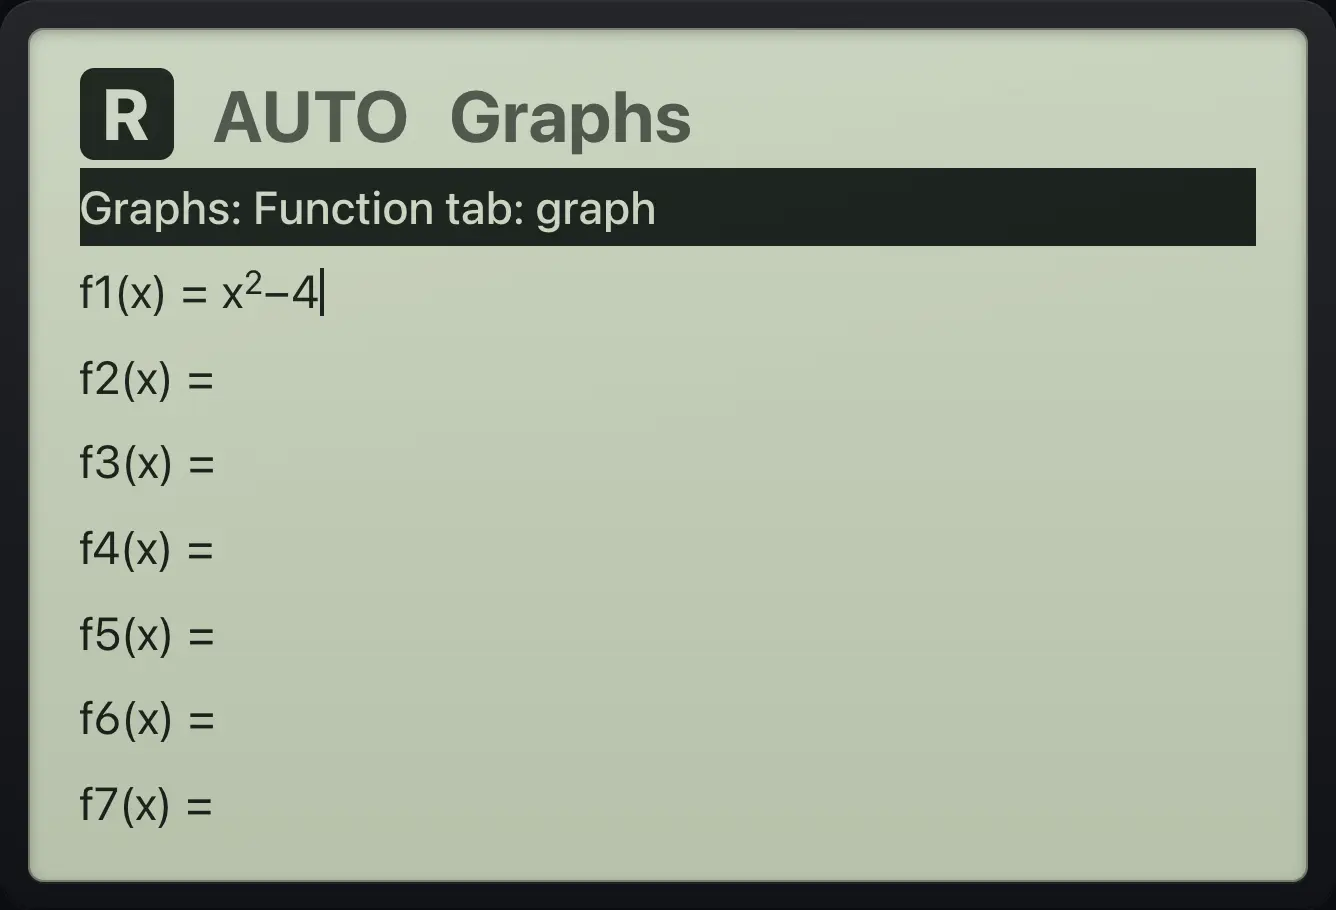
Press enter to plot.
enter
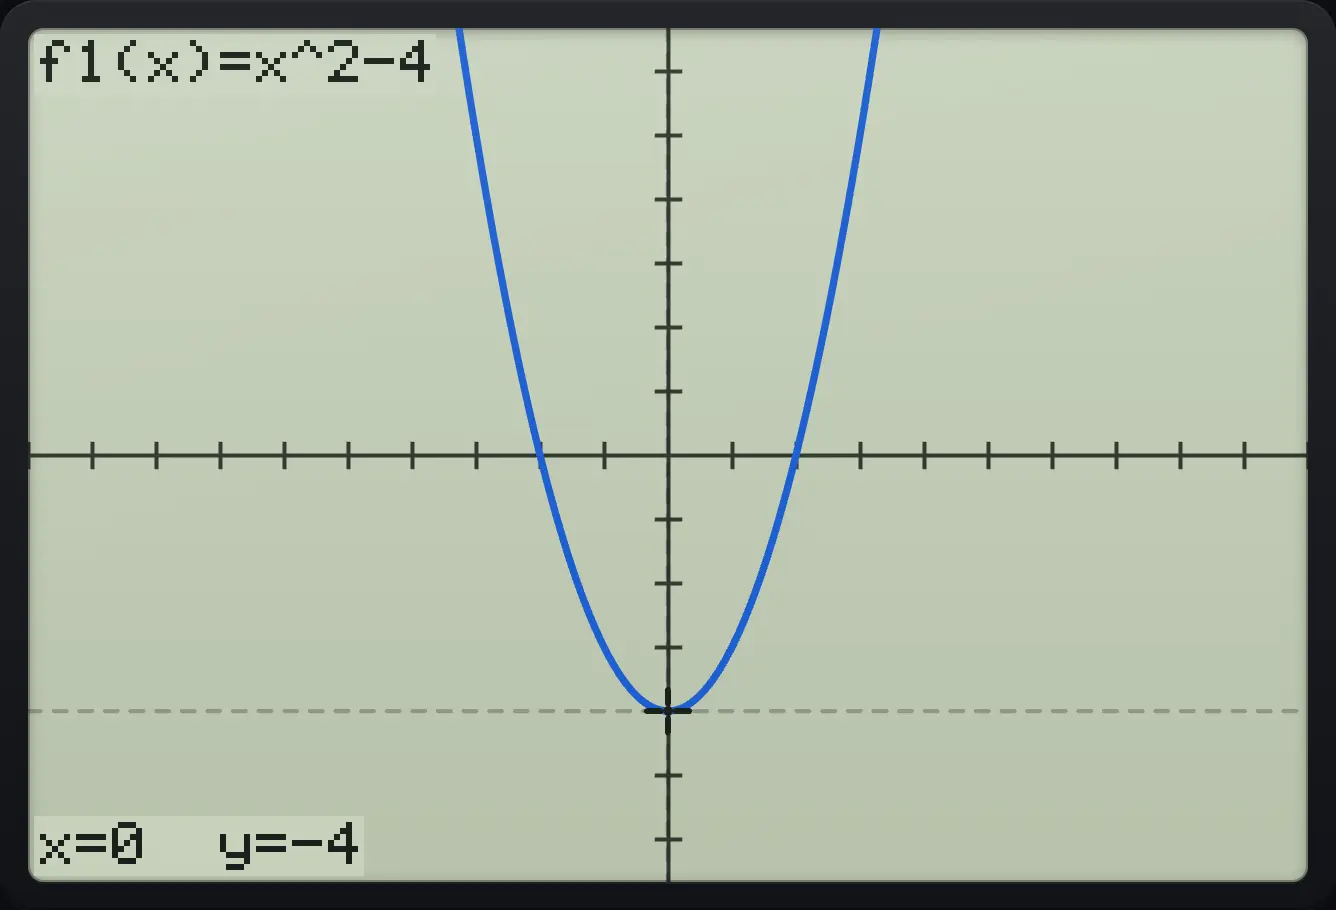
f1(x)=x^2-4 x=0 y=-4Use a stored variable
Store k := 3, open graphs, type k·x, plot, then move right five times.
k:=3enterdock×xenter▶▶▶▶▶
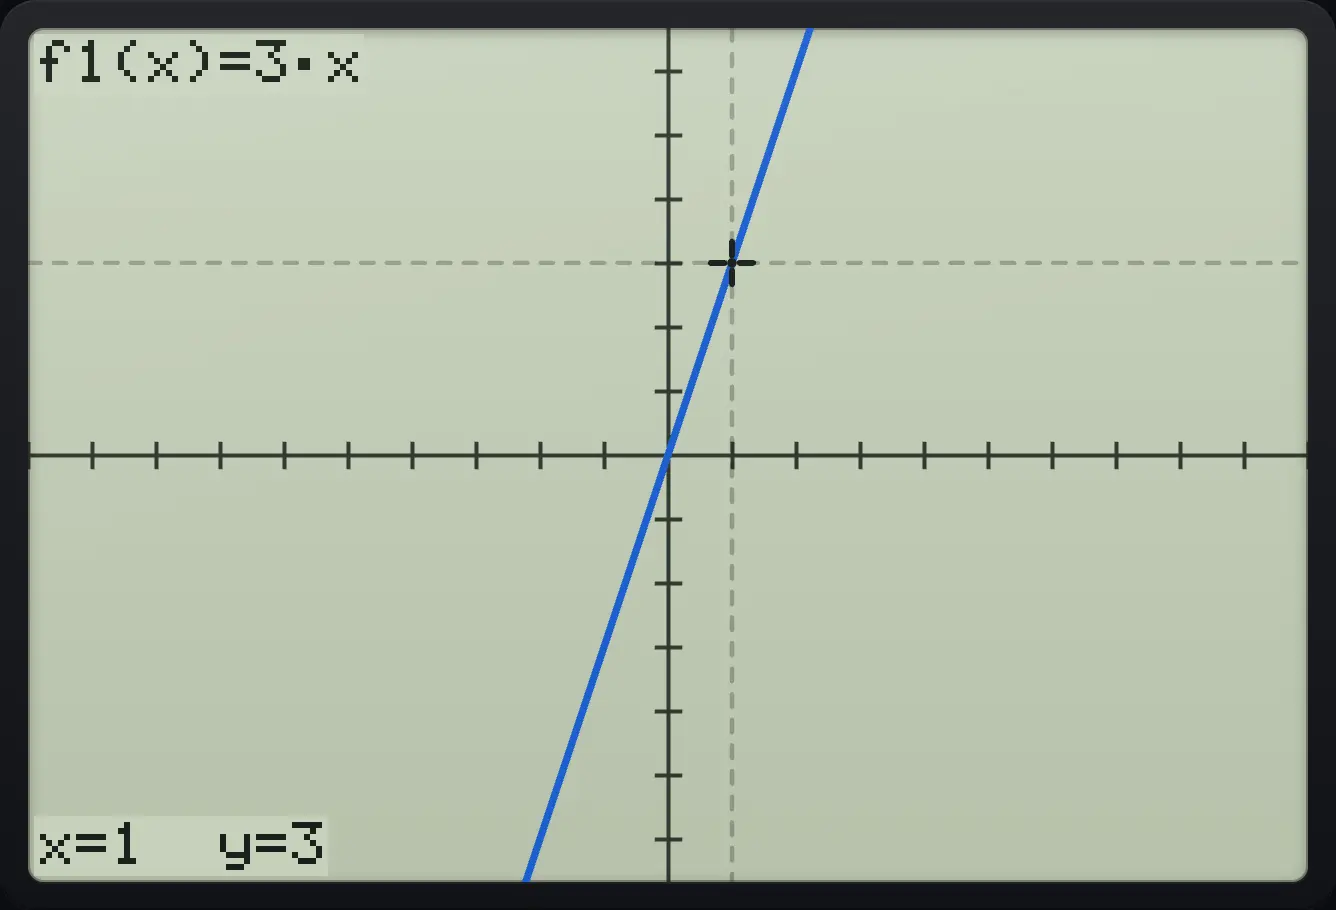
x=1 y=3Two functions
Type x, press down, type −x, plot, then press down to move the trace to f2.
docx▼(−)xenter▼
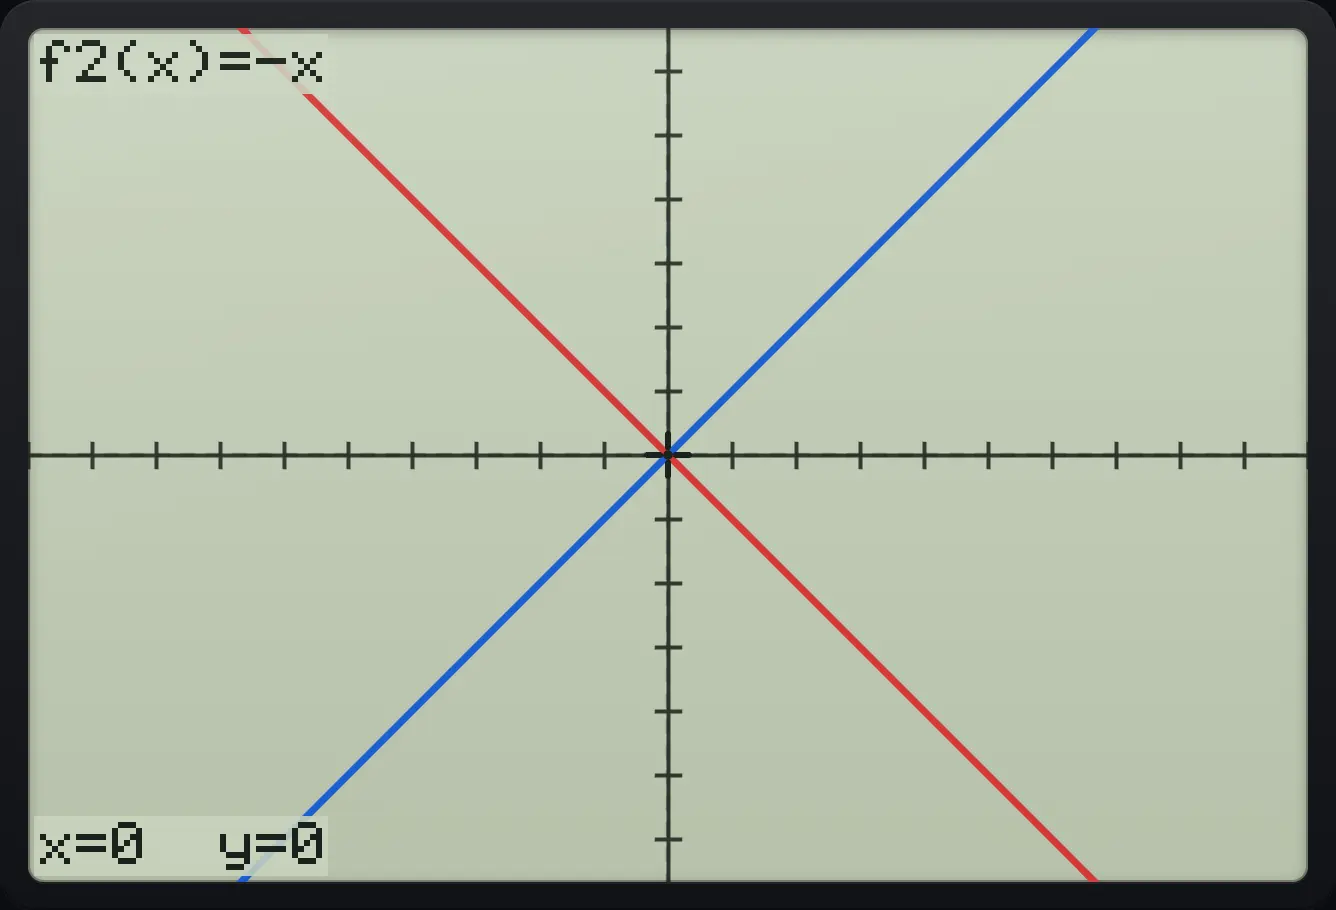
f2(x)=-xBack to the list
Plot x, then press tab.
docxentertab
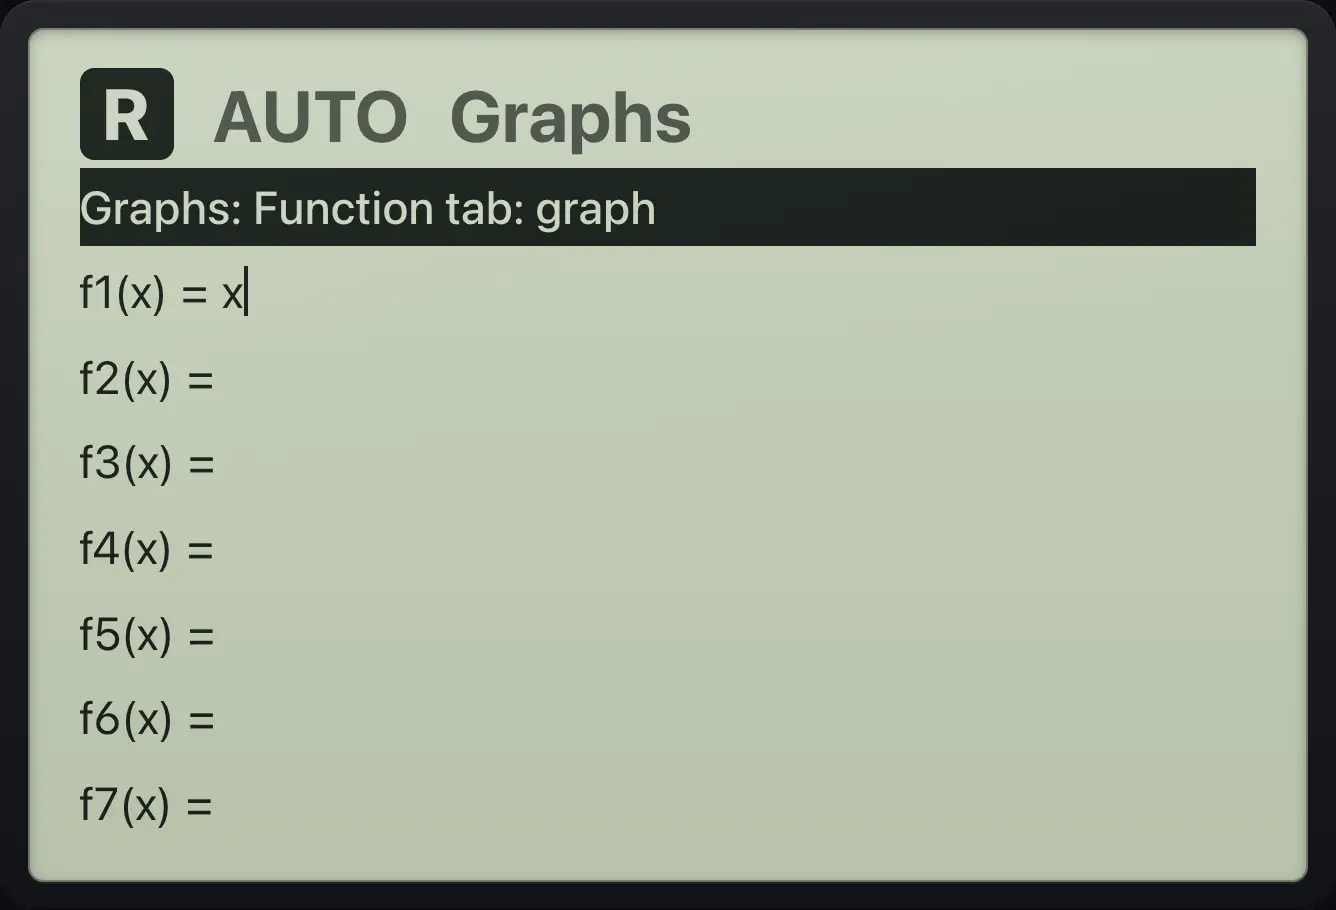
f1(x)=x Graphs: Function14.2Trace along a graph#
On a plotted graph, a trace point sits at x = 0. Press ▶ and ◀ to move it; the coordinates are shown at the bottom. With several functions, ▲ and ▼ switch between them. Type a number to jump to that x value.
Move the trace
Plot x² − 4, then press right five times.
docx^2▶−4enter▶▶▶▶▶
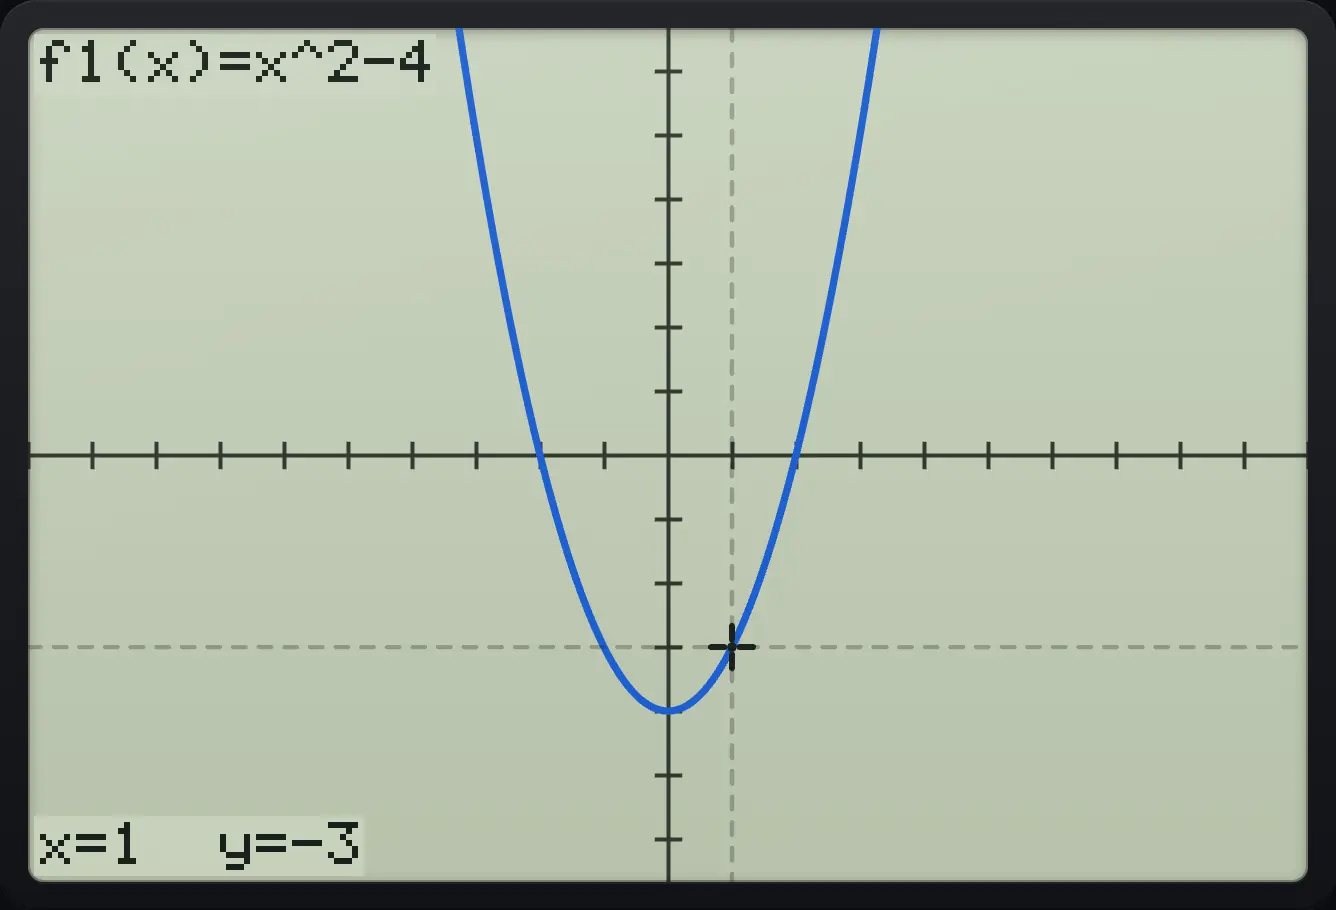
x=1 y=-3Jump to a value of x
Plot x², type 3, and press enter.
docx^2▶enter3enter
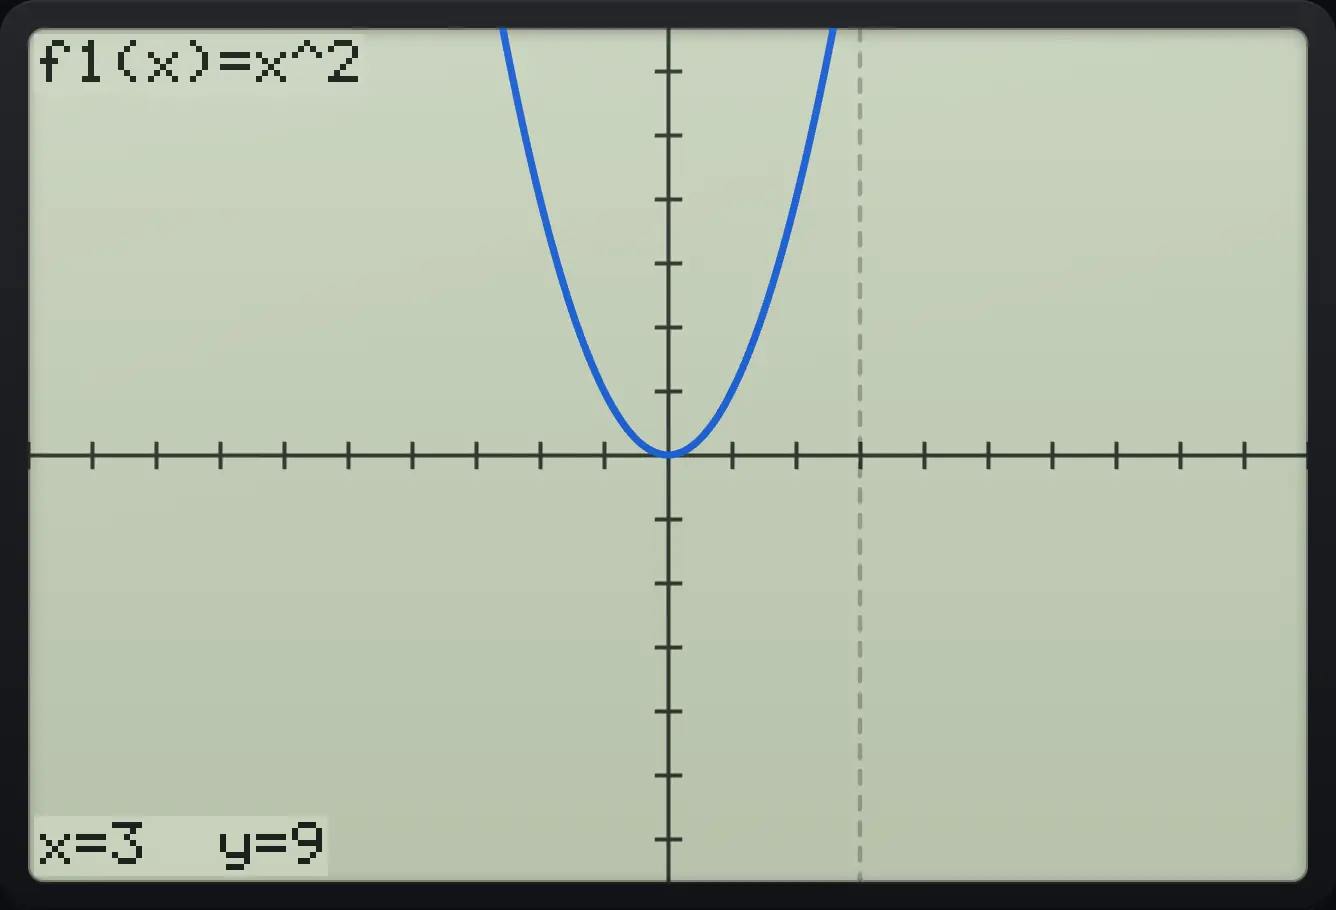
x=3 y=9Value from the Analyze menu
Plot x²−4, then menu, 4, 5 (Value), and type 3.
docx^2▶−4entermenu453enter
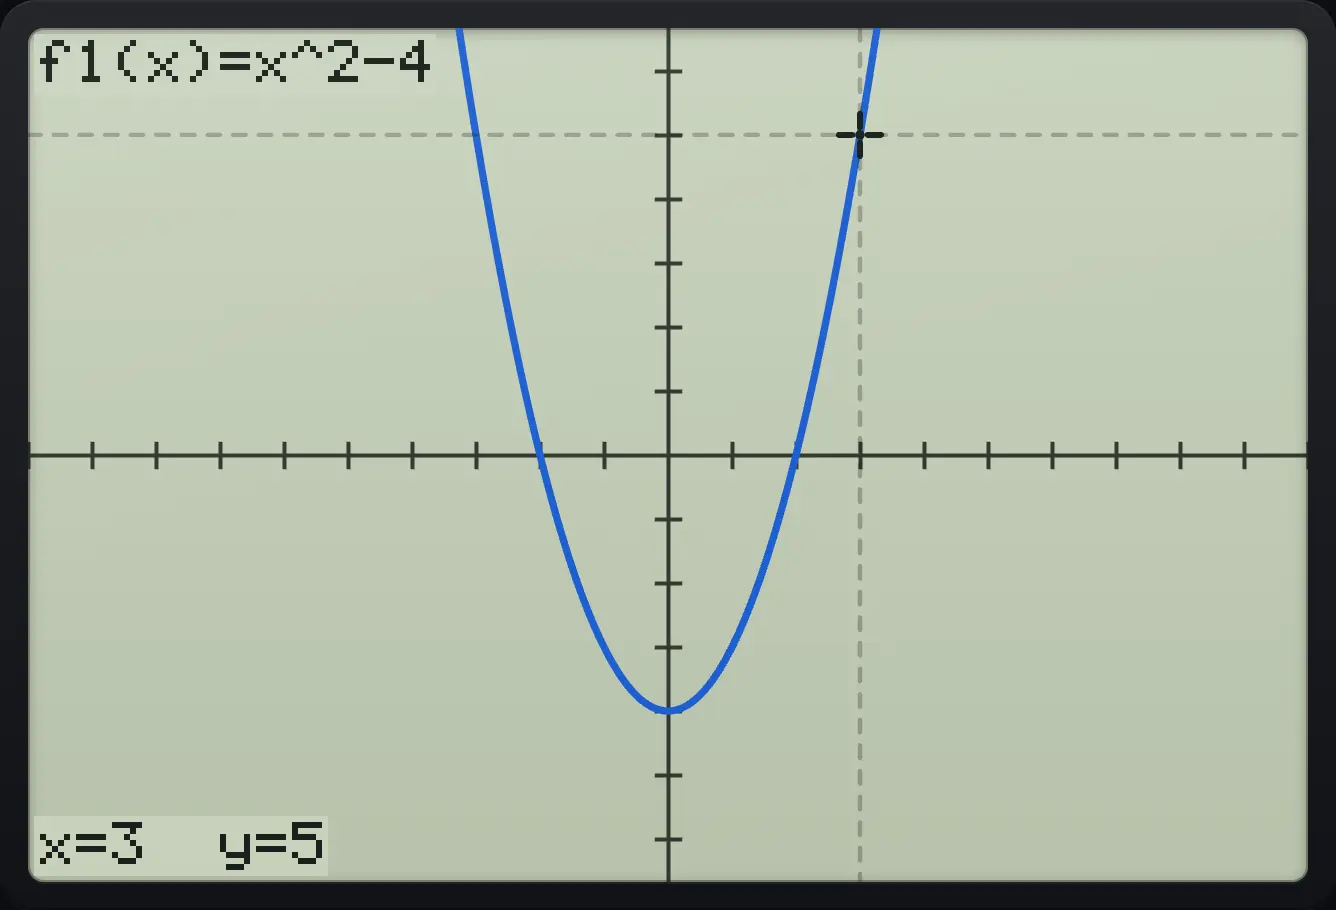
x=3 y=514.3Change the window and zoom#
The Graph menu (menu on the Graphs page) holds: 1 Window Settings, 2 Zoom, 3 Trace, 4 Analyze Graph, 5 Graph Type, 6 Edit Functions, 7 Toggle Function On/Off, 8 Delete All Functions. The standard window runs from −10 to 10 in x and about −6.67 to 6.67 in y.
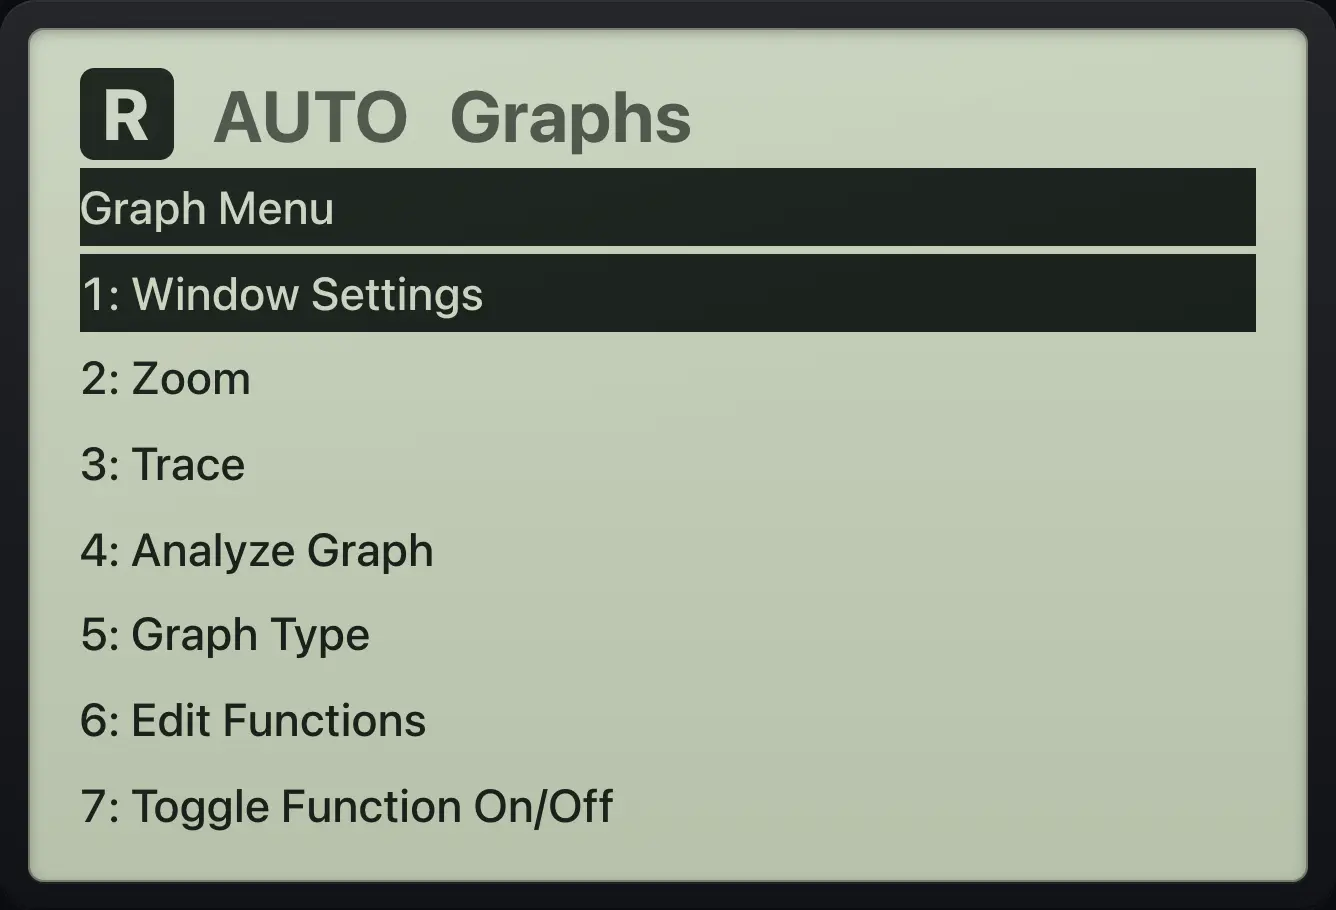
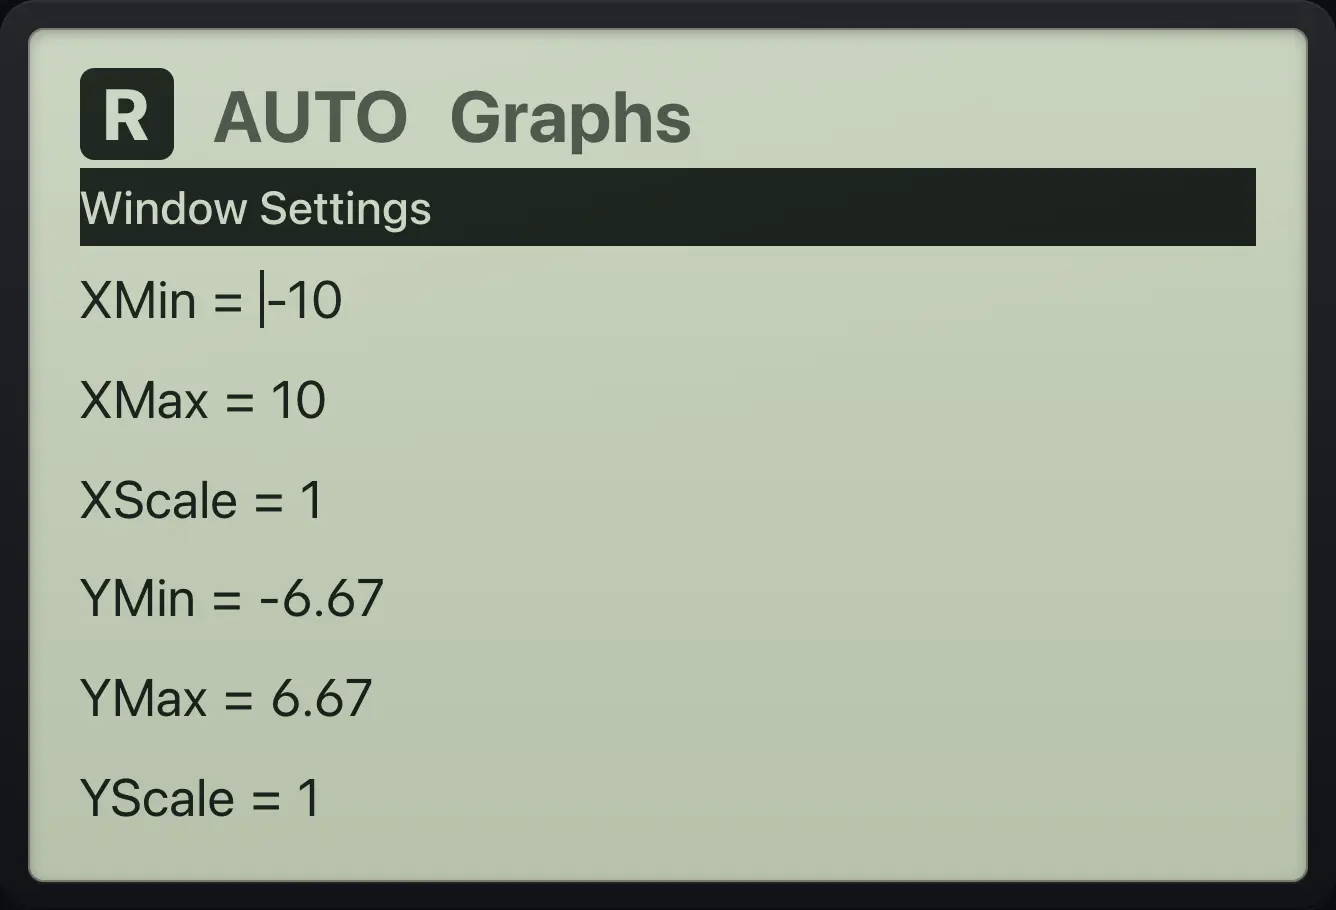
Set the window
Plot x, open menu 1, and type −5, enter.
docxentermenu1(−)5enter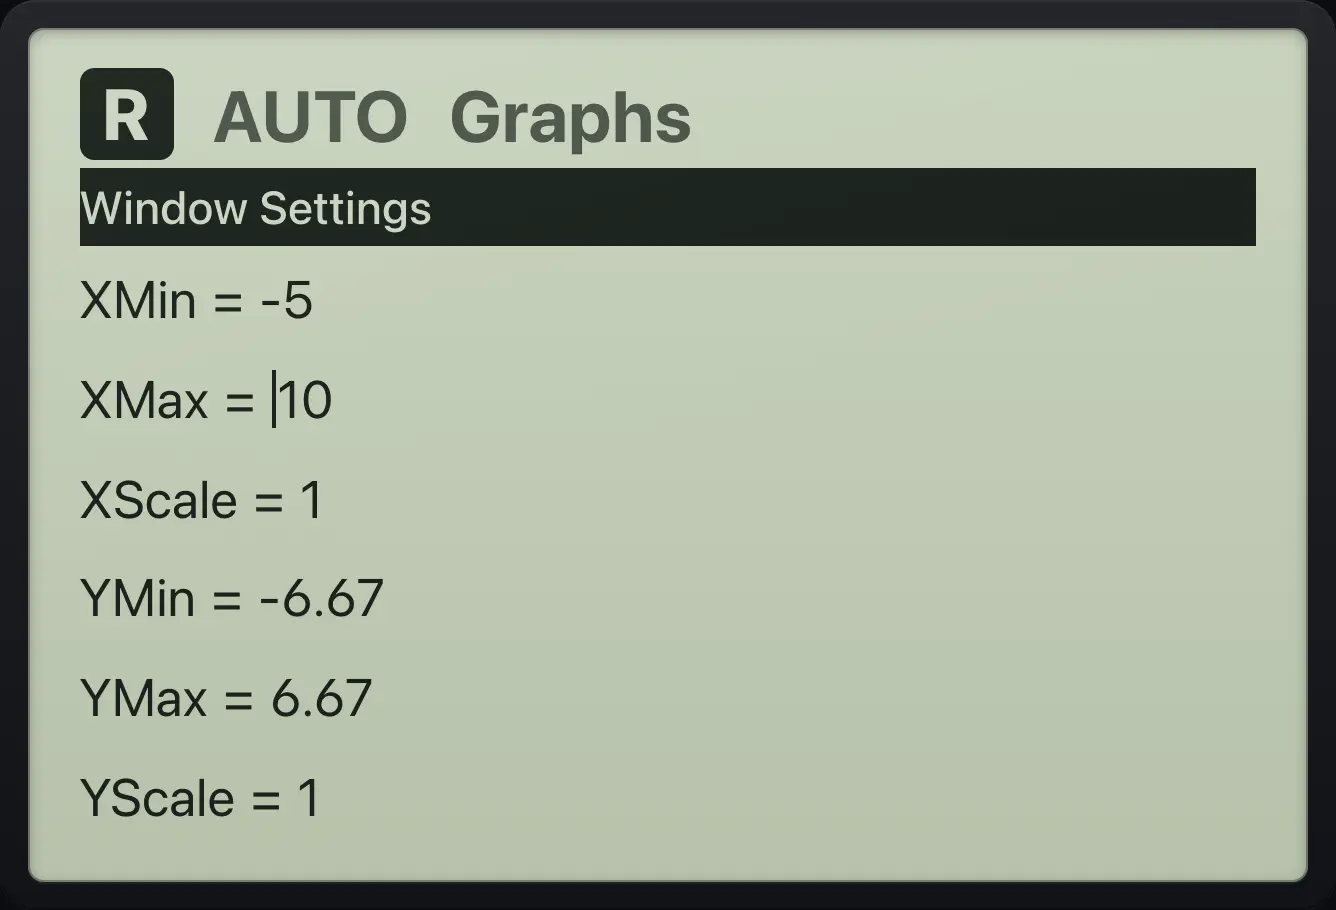
Type 5, enter, then press enter four times to finish.
5enterenterenterenterenter
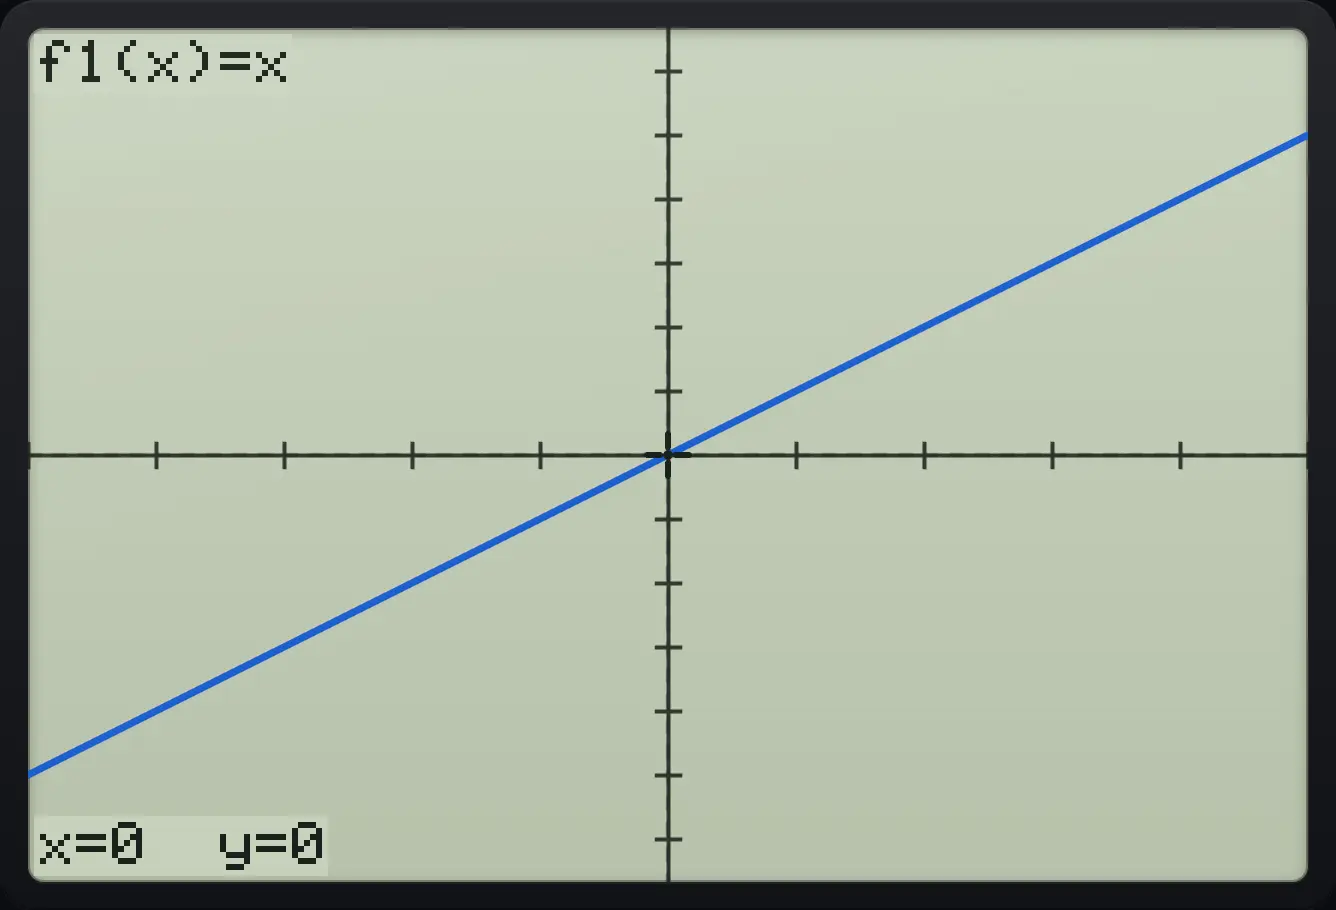
f1(x)=x| Zoom choice | Window it sets |
|---|---|
| 1 Standard | x from −10 to 10, y from −6.67 to 6.67 |
| 2 Trig | x from −2π to 2π, y from −4 to 4, x scale π/2 |
| 3 Fit | Keeps x, adjusts y to show every function |
| 4 In | Halves the window around the trace |
| 5 Out | Doubles the window |
| 6 Square | Makes the y range match the screen shape |
| 7 Decimal | x from −15.9 to 15.9, y from −10.6 to 10.6 |
Zoom to a trig window
Plot sin(x), press menu, 2, 2.
docsin(x)entermenu22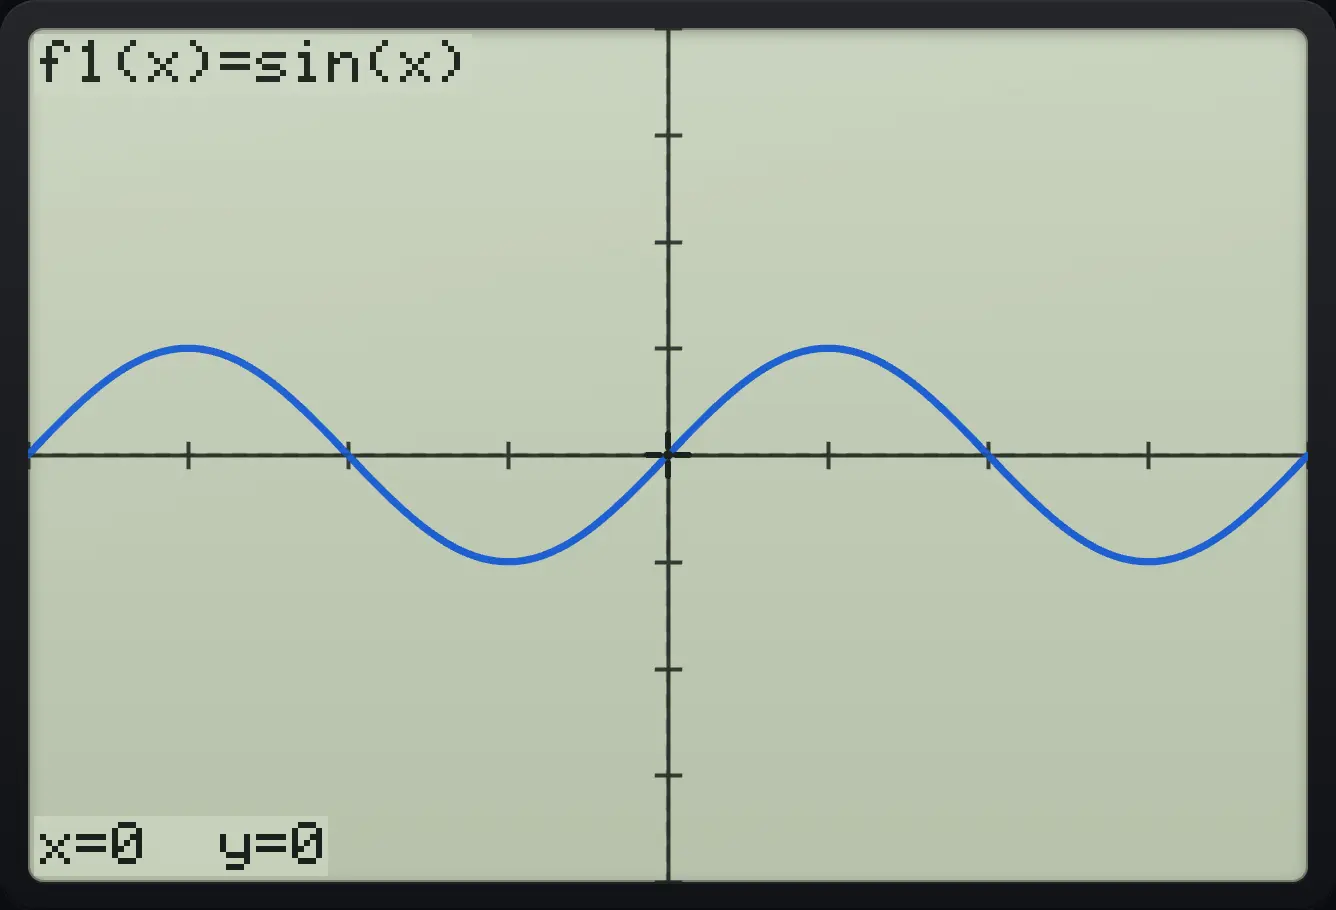
f1(x)=sin(x)Zoom in
Plot x, press menu, 2, 4 to halve the window.
docxentermenu24Open Window Settings to see the new limits.
menu1
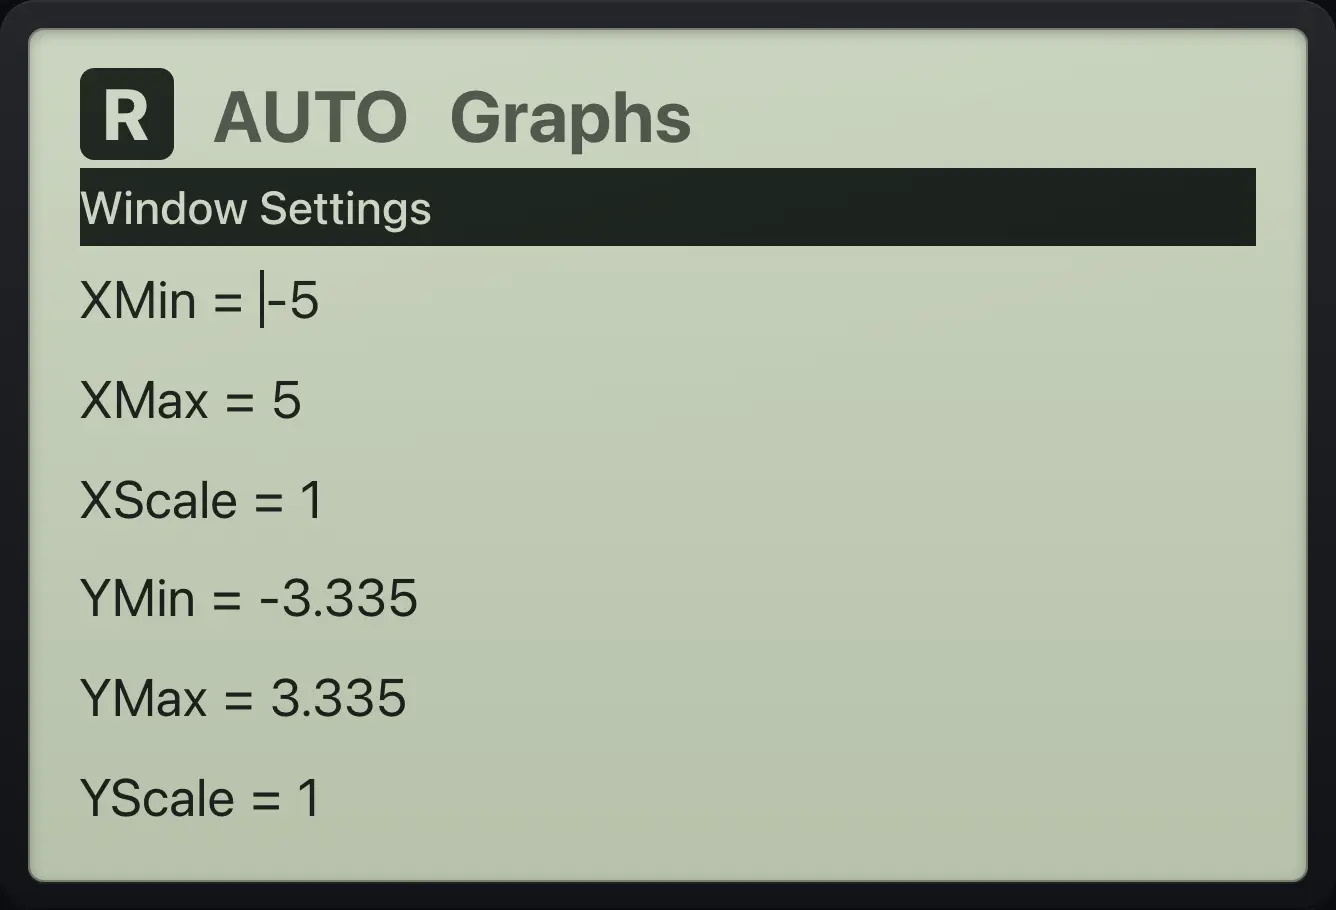
XMin=-5 XMax=514.4Find zeros, minimums, maximums and intersections#
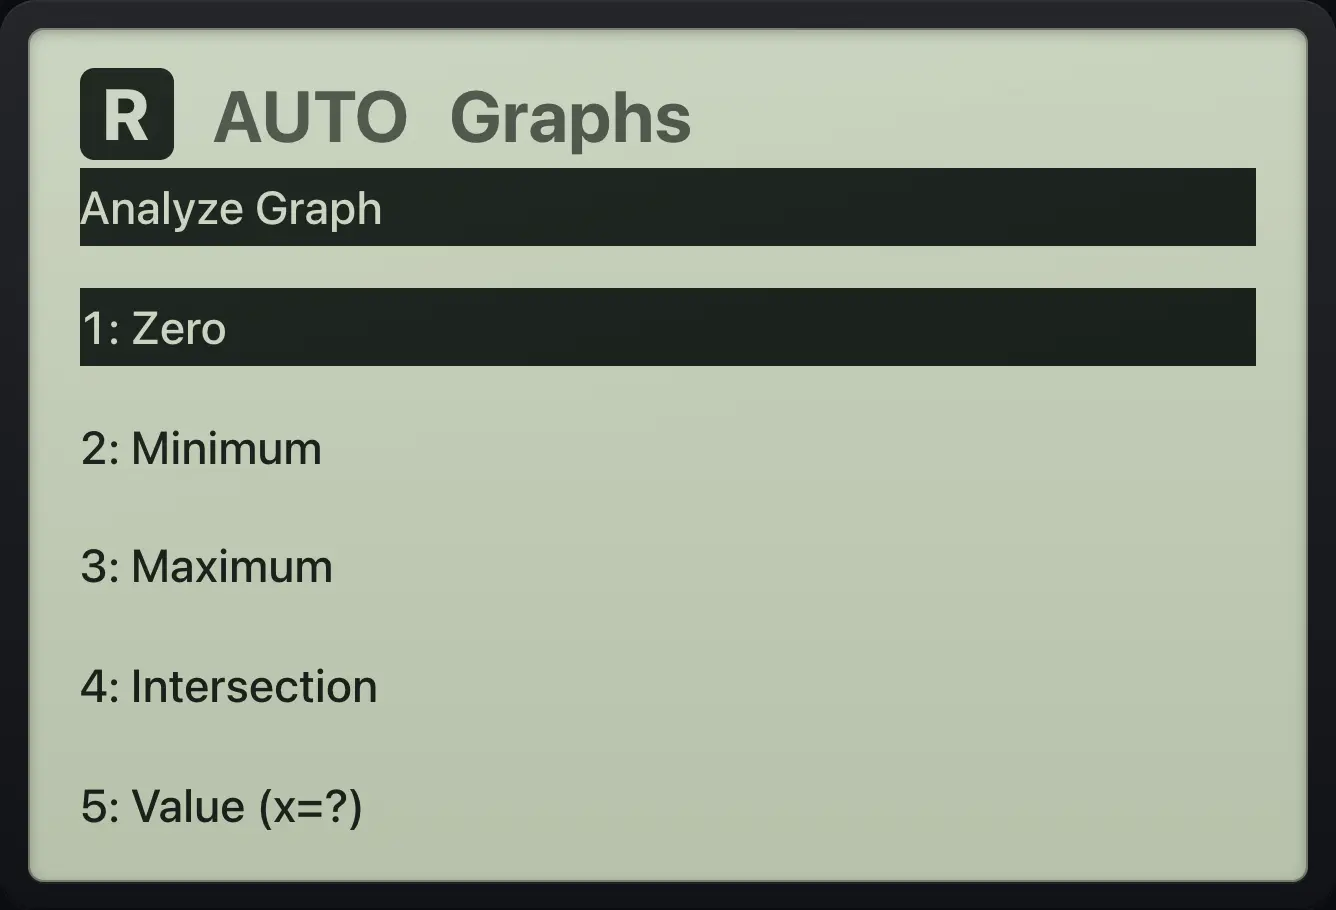
Open the Analyze Graph menu (menu, 4). Zero, Minimum and Maximum search near the trace point and move the trace to the answer. Intersection looks for where two plotted functions meet. If nothing is found, the screen says "No … found".
Zero to the right
Plot x²−4, move right once, then Analyze, Zero.
docx^2▶−4enter▶menu41
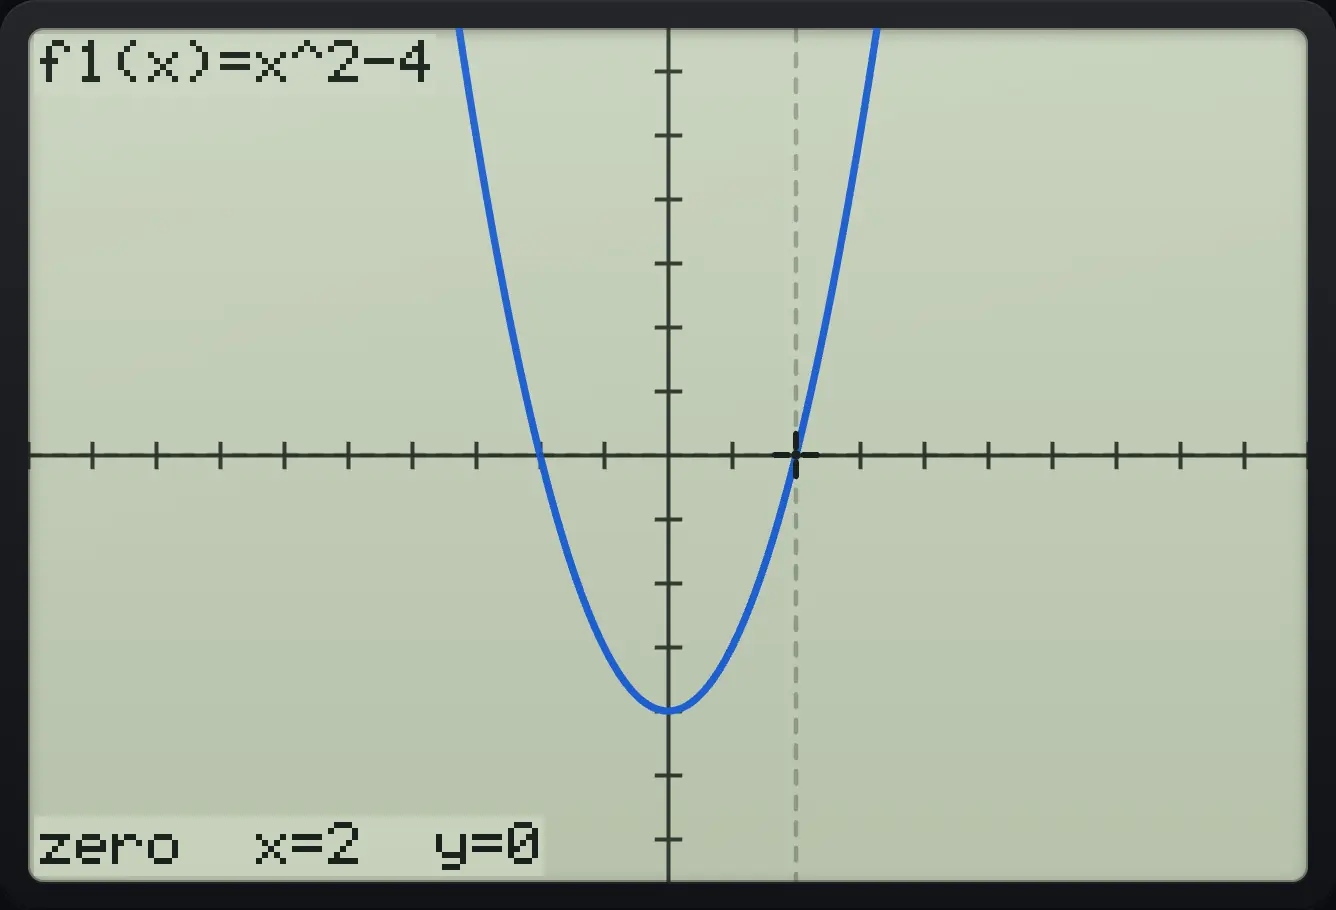
zero x=2 y=0Zero found from x = 0
Without moving, Zero picks the nearer left zero.
docx^2▶−4entermenu41
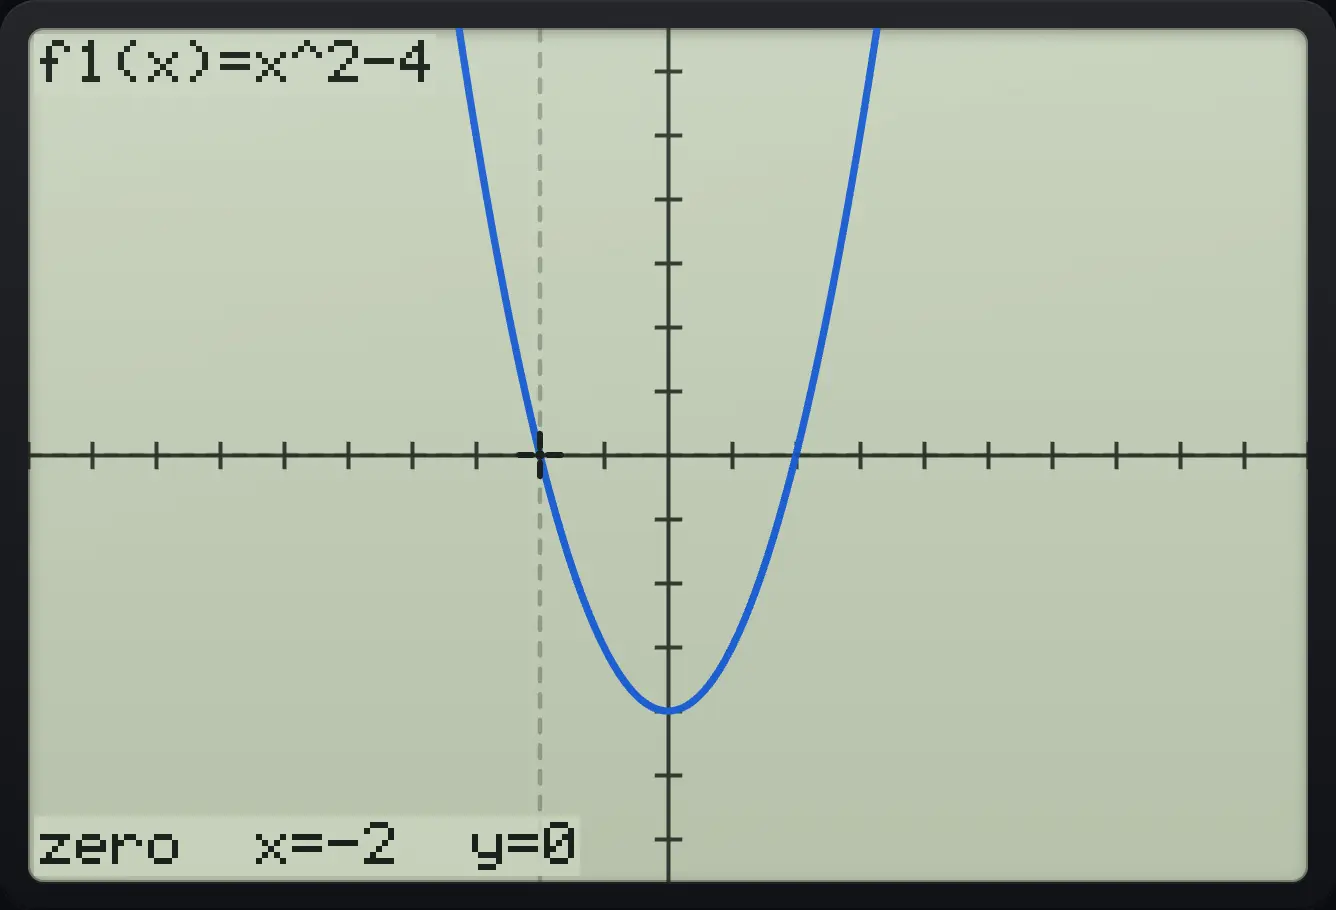
x=-2 y=0Minimum
Plot x²−2x, Analyze, Minimum.
docx^2▶−2xentermenu42
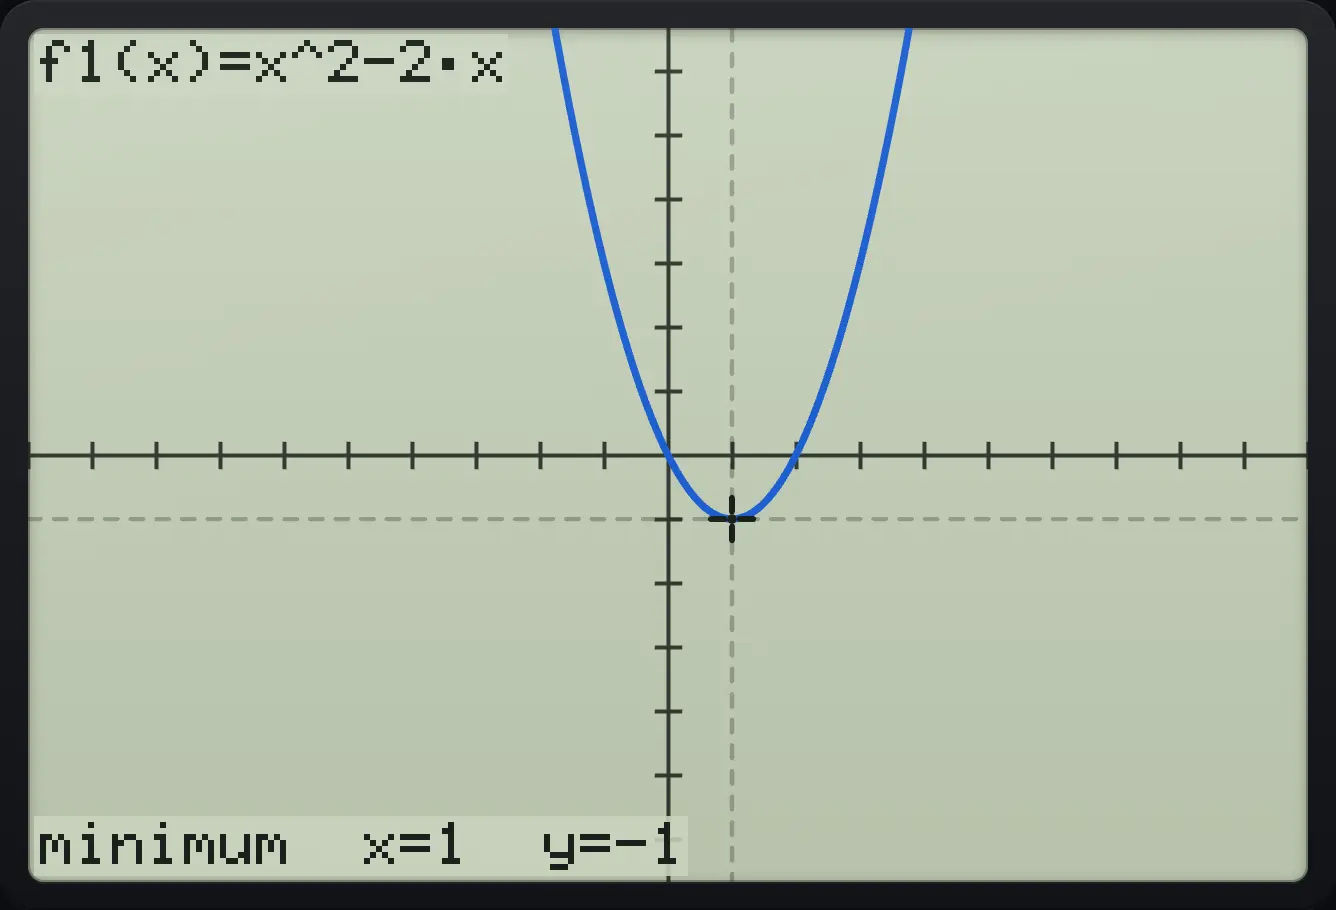
minimum x=1 y=-1Maximum
Plot 4−x², Analyze, Maximum.
doc4−x^2▶entermenu43
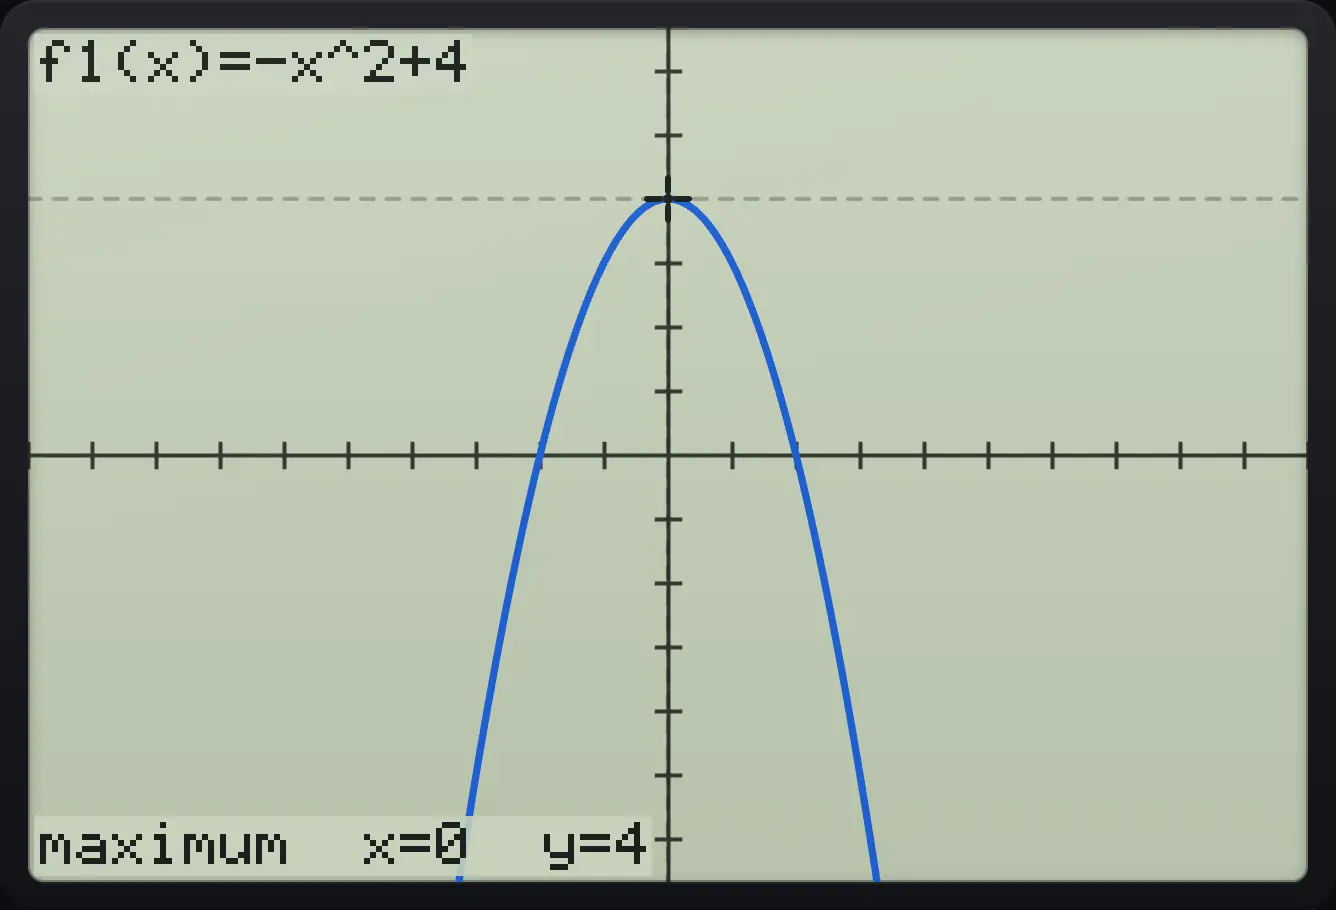
maximum x=0 y=4Intersection
Type x, down, 2−x, plot, Analyze, Intersection.
docx▼2−xentermenu44
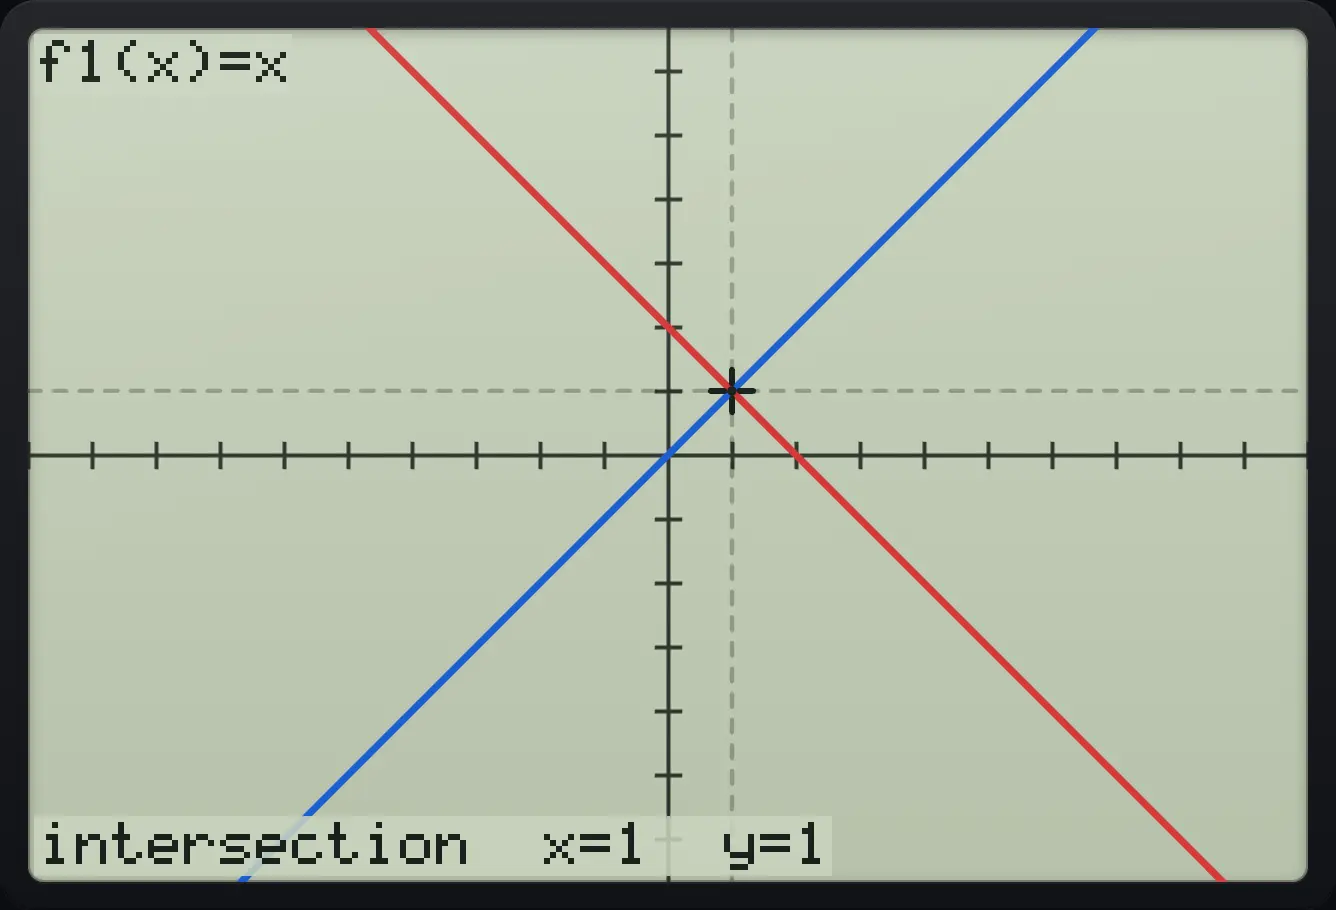
intersection x=1 y=1Nothing found
Plot x², Analyze, Maximum.
docx^2▶entermenu43
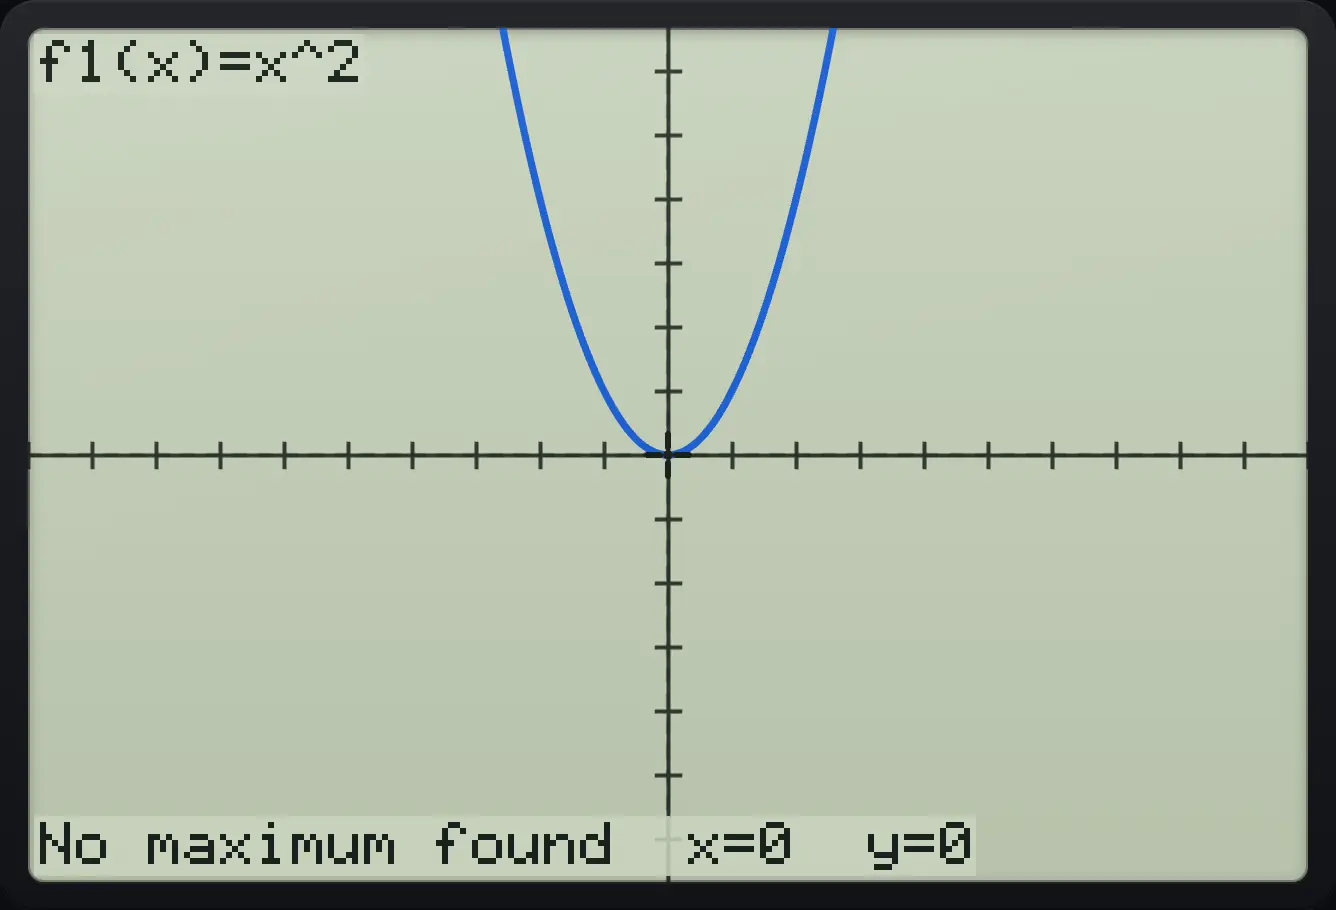
No maximum found14.5Parametric and polar graphs#
Choose Graph Type (menu, 5) to switch between Function, Parametric and Polar. Parametric lines come in pairs (x1(t) then y1(t)); polar graphs use r1(θ). Typing θ uses θ.
A parametric circle
Open graphs, menu, 5, 2 (Parametric).
docmenu52Type cos(t), down, sin(t), enter.
cos(t)▼sin(t)enter
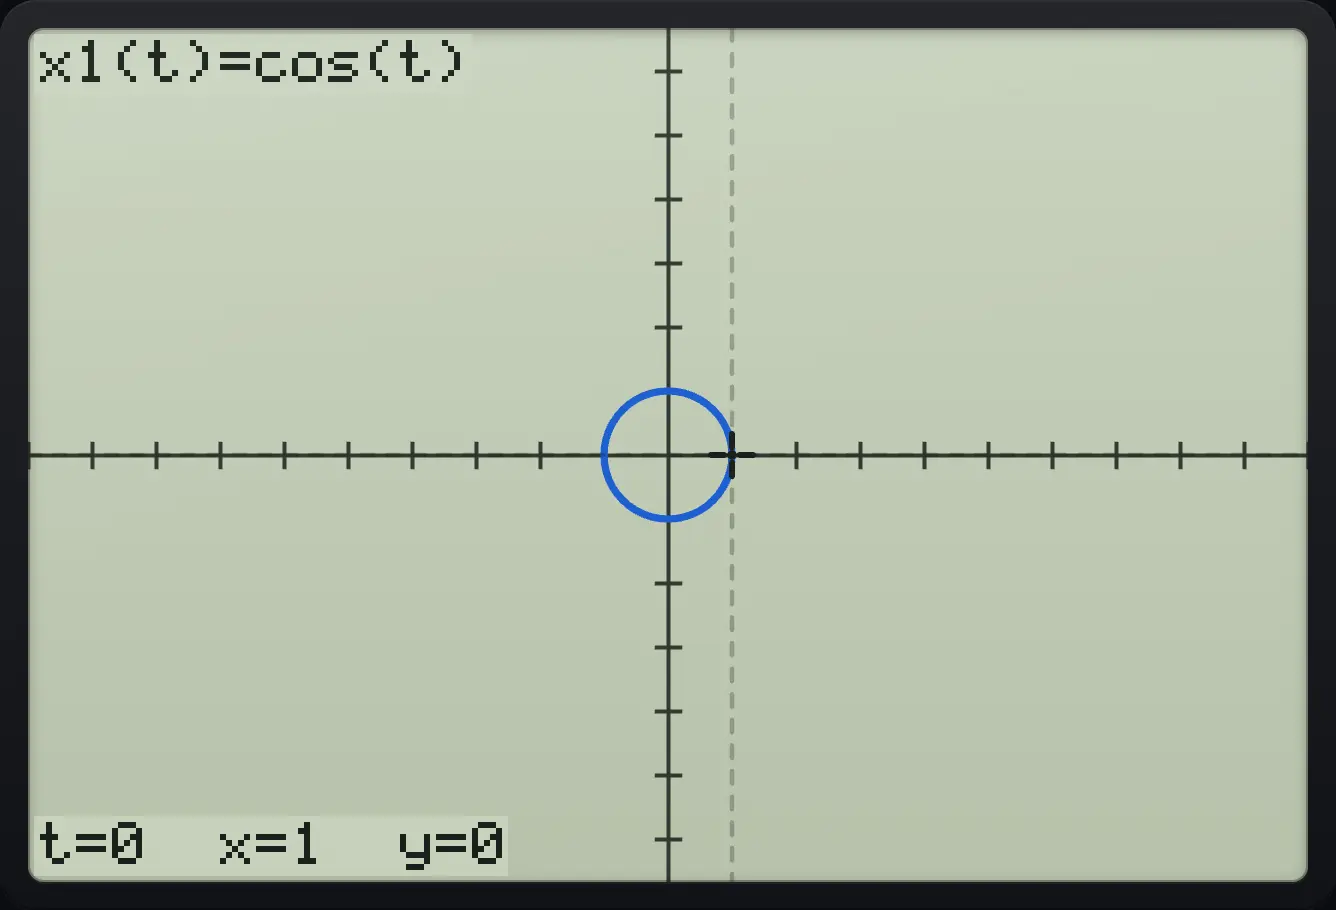
x1(t)=cos(t)Trace a parametric curve
Move the trace twice to the right.
docmenu52cos(t)▼sin(t)enter▶▶
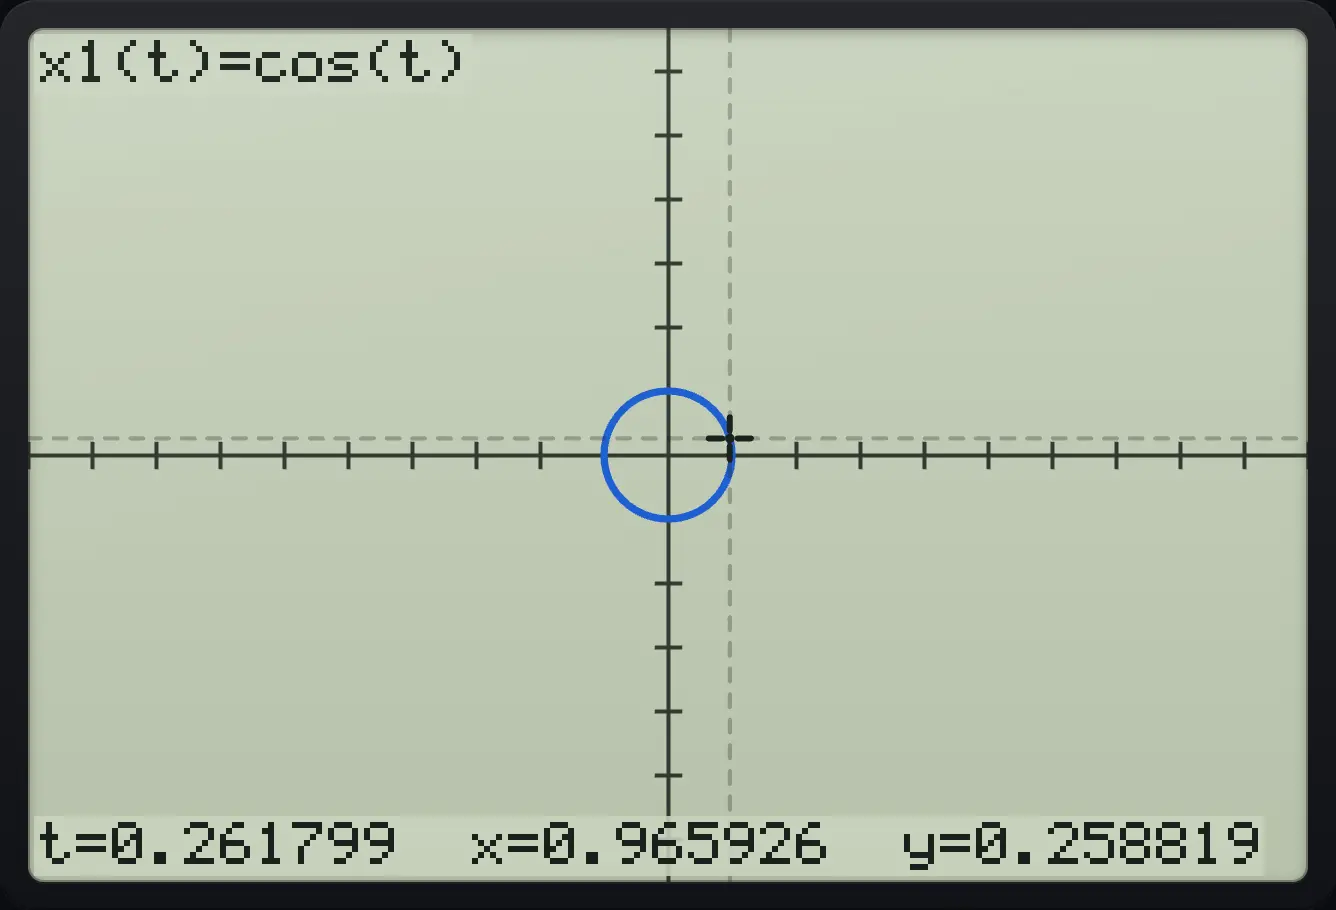
t=0.261799A polar rose
Choose Polar (menu, 5, 3), type 2 sin(3θ), plot, and trace.
docmenu532sin(3θ)enter▶▶
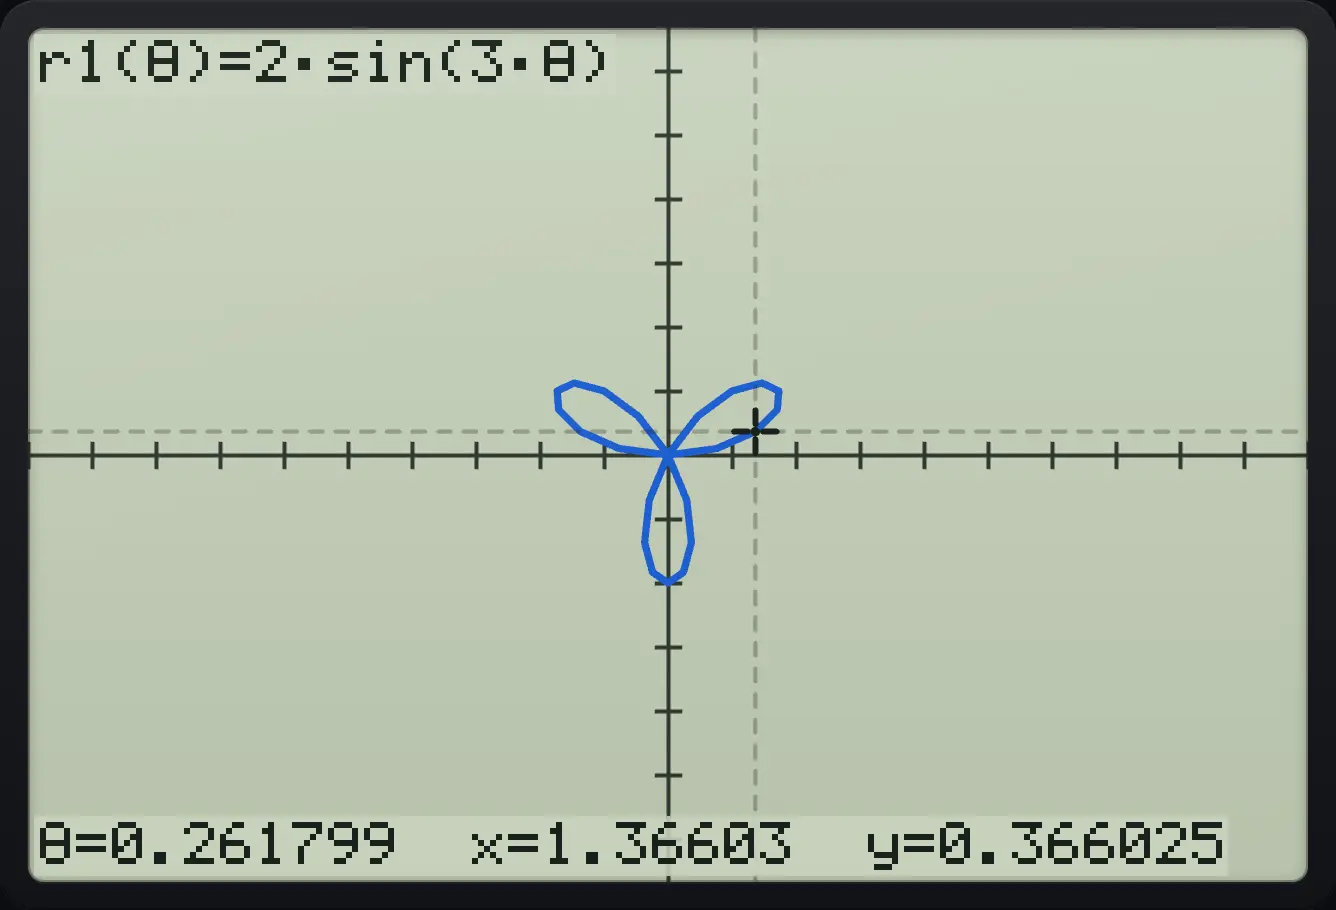
r1(θ)=2·sin(3·θ) θ=0.26179914.6Turn functions off and clear them#
Edit Functions (menu, 6) returns to the list. Toggle Function On/Off (menu, 7) hides the selected function without erasing it. Delete All Functions (menu, 8) empties the list. If every function is off, the screen says "All functions are off: menu › Toggle Function On/Off"; with no functions at all it says "No functions: tab to enter f1(x)".
Every function turned off
Plot x, then menu, 7 to turn it off.
docxentermenu7
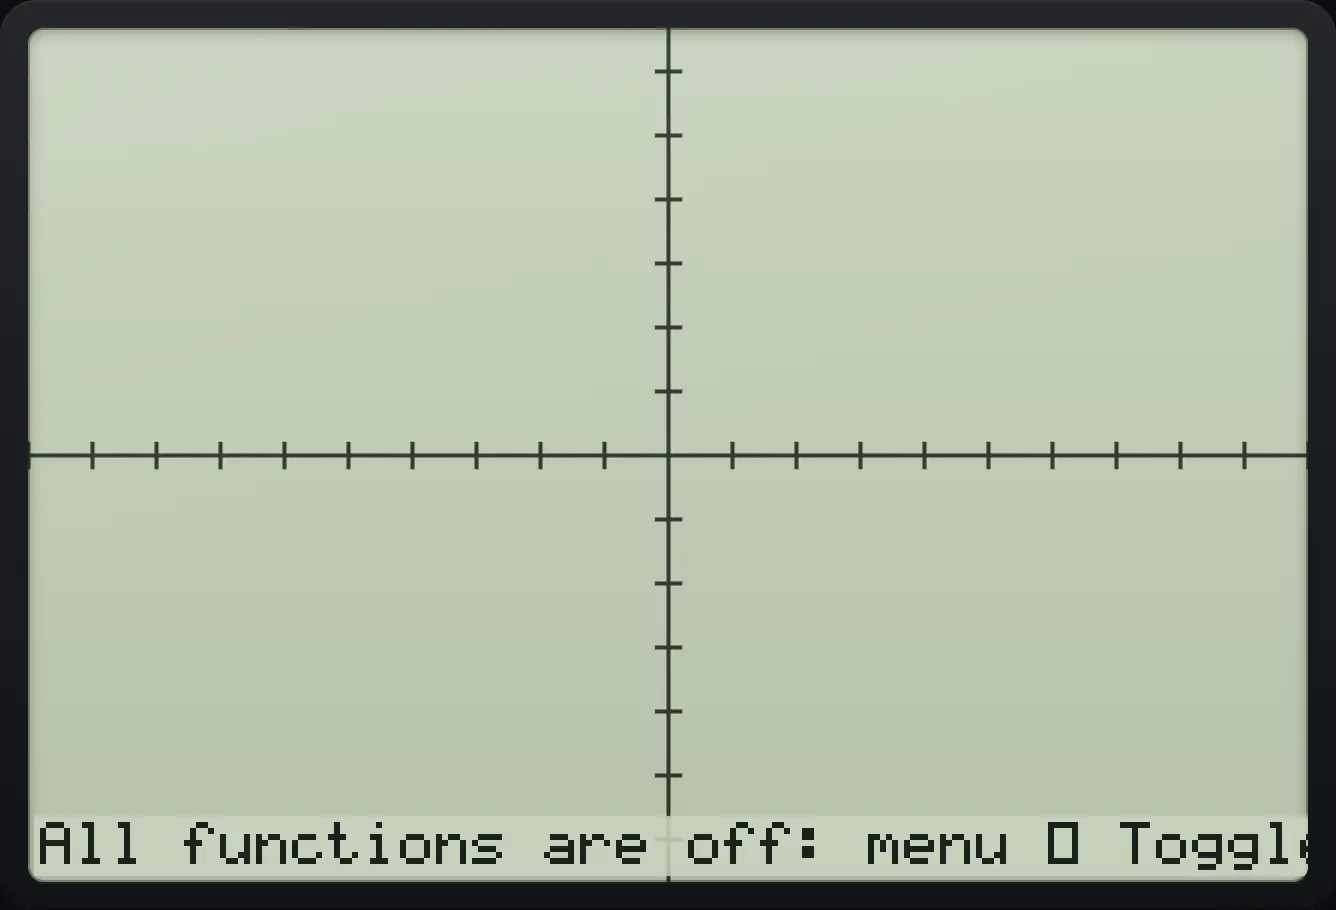
All functions are off: menu › Toggle Function On/OffTI-Nspire CX CAS is a trademark of Texas Instruments Incorporated. Trident Calculator is an independent product by South View Studios and is not affiliated with, sponsored by or endorsed by Texas Instruments. The name is used only to describe the kind of calculator this model resembles; Trident's names, keys, display, fonts and software are its own clean-room design.