
Classic Financial II manual · Chapter 11 of 16
Statistics and regression
Enter x and y data, then find means, standard deviations, regression lines and forecasts.
11.1Enter data points#
Press 2NDDATA7 (DATA). Lines alternate X01, Y01, X02, Y02 and so on. Type a value and press ENTER, then ↓ to the next line. Y values default to 1, so for one-variable statistics you only need X. 2NDDEL↑ deletes a point, 2NDINS↓ inserts one, and 2NDCLR WORKCE/C clears all data. Up to 50 points can be entered.
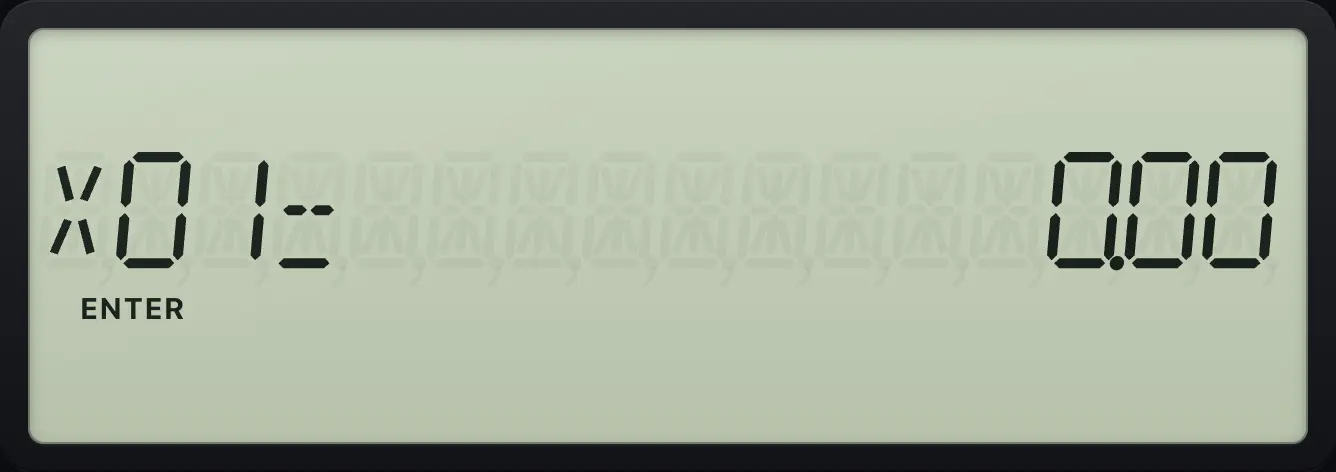
Enter two points
Enter x = 5, then move down to its y line.
2NDDATA75ENTER↓
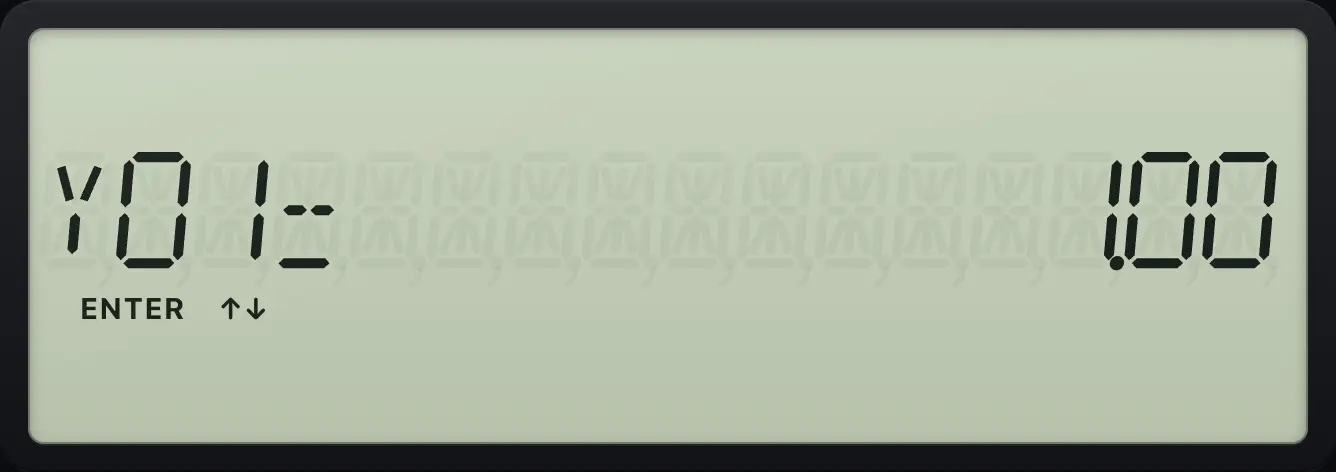
Y01= 1.00Clear the data
Enter points, then clear the sheet with 2ND CE/C.
2NDDATA71ENTER↓2ENTER↓2ENTER↓4ENTER↓3ENTER↓5ENTER↓4ENTER↓4ENTER↓5ENTER↓5ENTER↓2NDCLR WORKCE/C
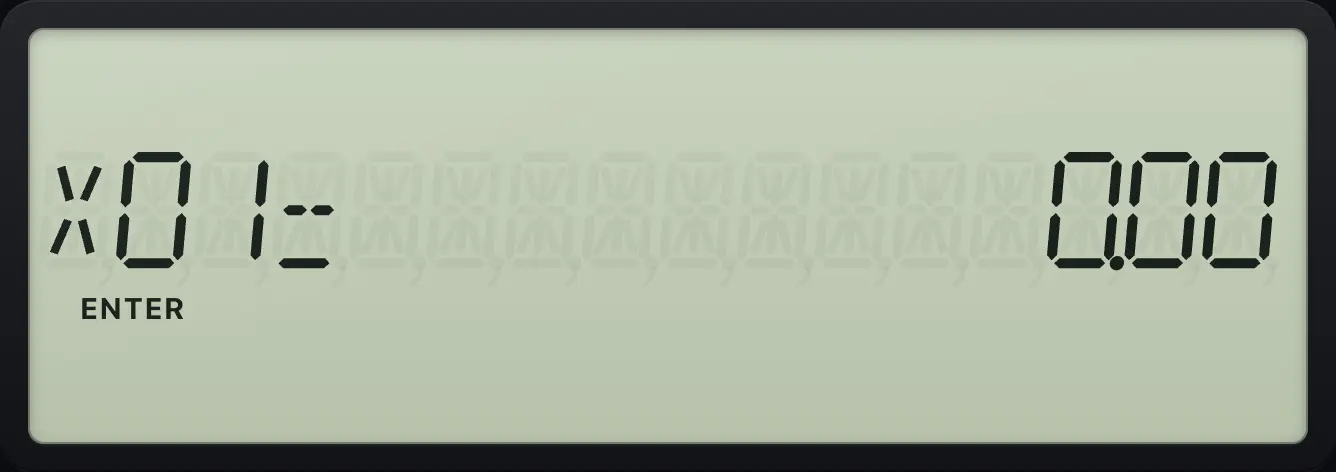
X01= 0.0011.2Read the statistics#
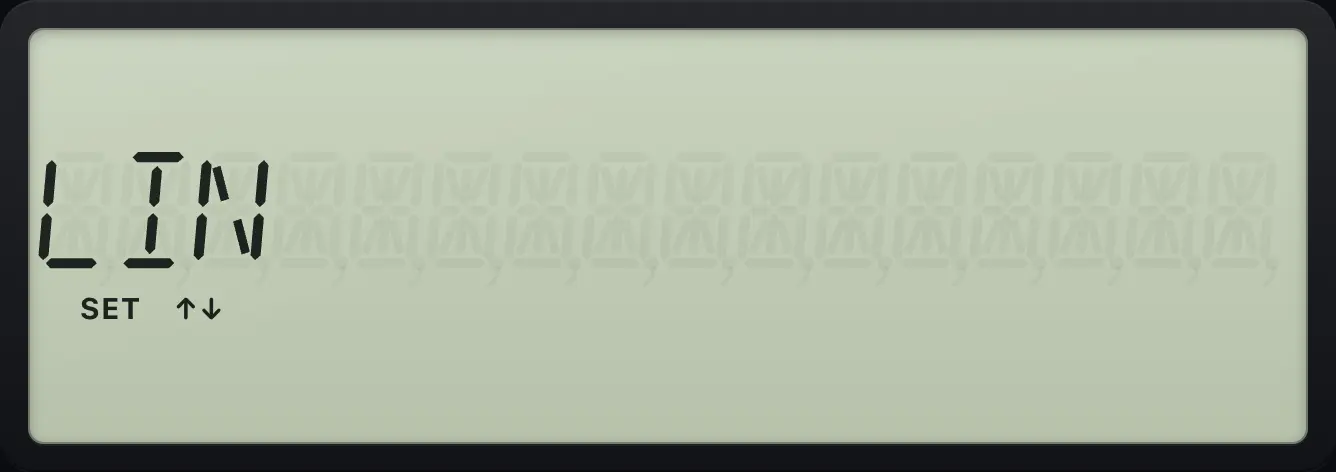
Press 2NDSTAT8 (STAT). The first line chooses the method: LIN (a straight line), Ln, EXP, PWR or 1-V (one variable). Change it with 2NDSETENTER. Then press ↓ for n, x̄, Sx, σx, ȳ, Sy, σy, a, b and r, then X' and Y' (forecasts) and the sums Σx, Σx², Σy, Σy² and Σxy.
Number of points
Enter five points (1,2) (2,4) (3,5) (4,4) (5,5) then open STAT and go down once.
2NDDATA71ENTER↓2ENTER↓2ENTER↓4ENTER↓3ENTER↓5ENTER↓4ENTER↓4ENTER↓5ENTER↓5ENTER↓2NDSTAT8↓
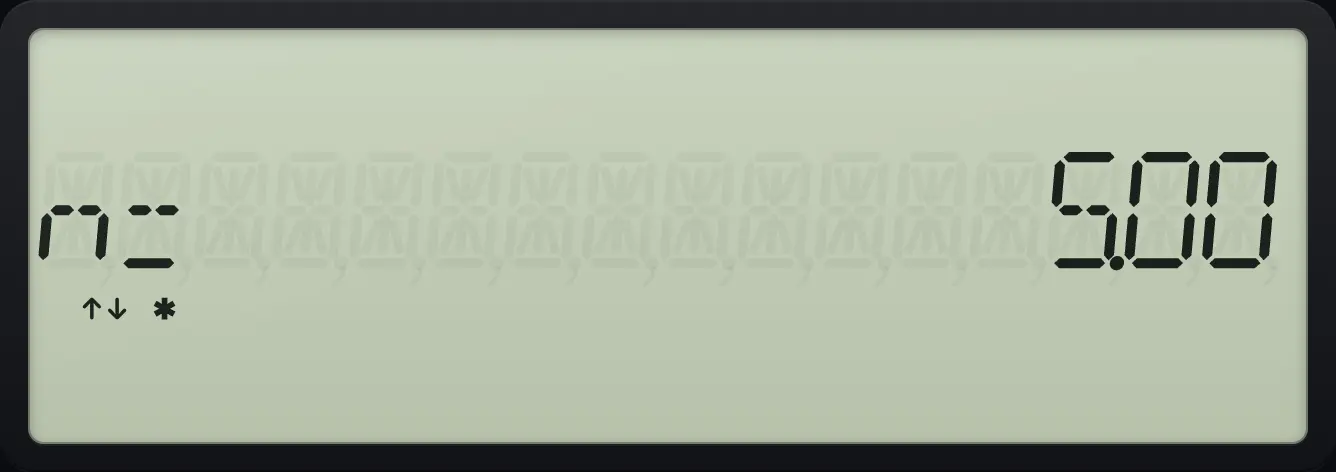
n= 5.00Mean of x
Press down once more.
2NDDATA71ENTER↓2ENTER↓2ENTER↓4ENTER↓3ENTER↓5ENTER↓4ENTER↓4ENTER↓5ENTER↓5ENTER↓2NDSTAT8↓↓
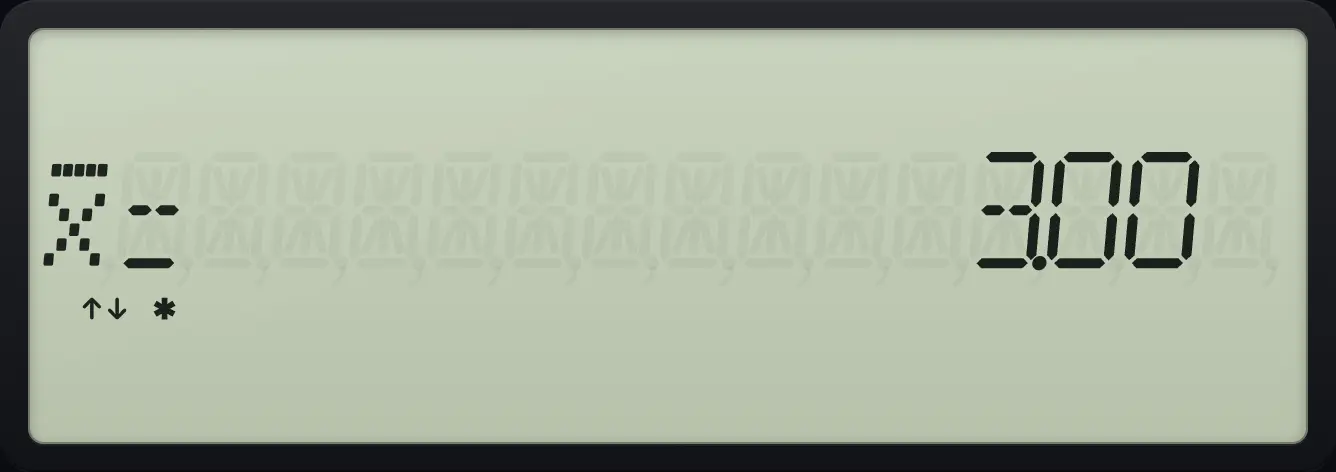
x̄= 3.00Sample standard deviation
Sx is on the next line.
2NDDATA71ENTER↓2ENTER↓2ENTER↓4ENTER↓3ENTER↓5ENTER↓4ENTER↓4ENTER↓5ENTER↓5ENTER↓2NDSTAT8↓↓↓
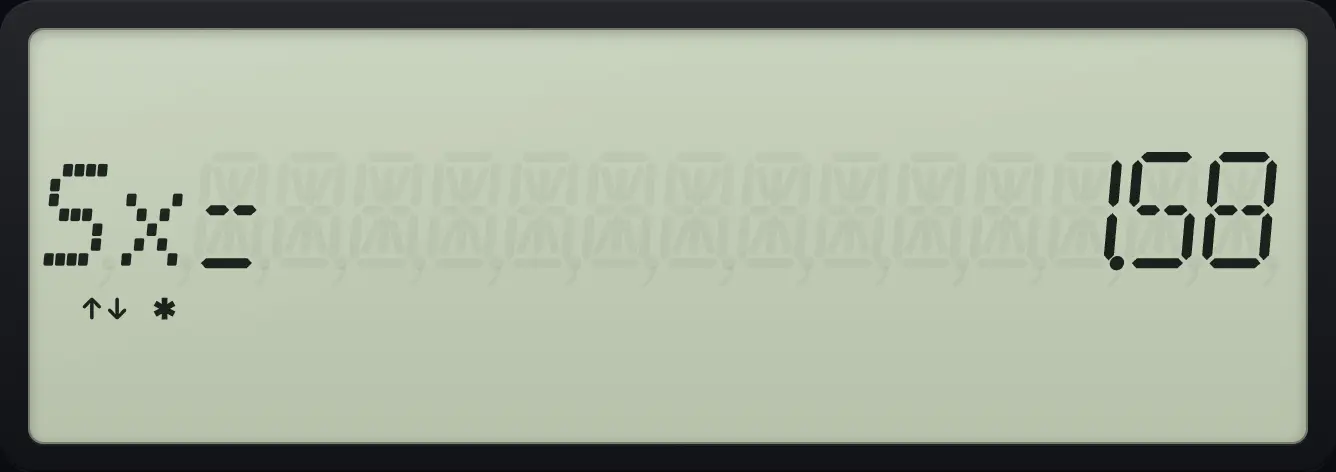
Sx= 1.58Slope and intercept
For LIN, a is the intercept and b is the slope.
2NDDATA71ENTER↓2ENTER↓2ENTER↓4ENTER↓3ENTER↓5ENTER↓4ENTER↓4ENTER↓5ENTER↓5ENTER↓2NDSTAT8↓↓↓↓↓↓↓↓
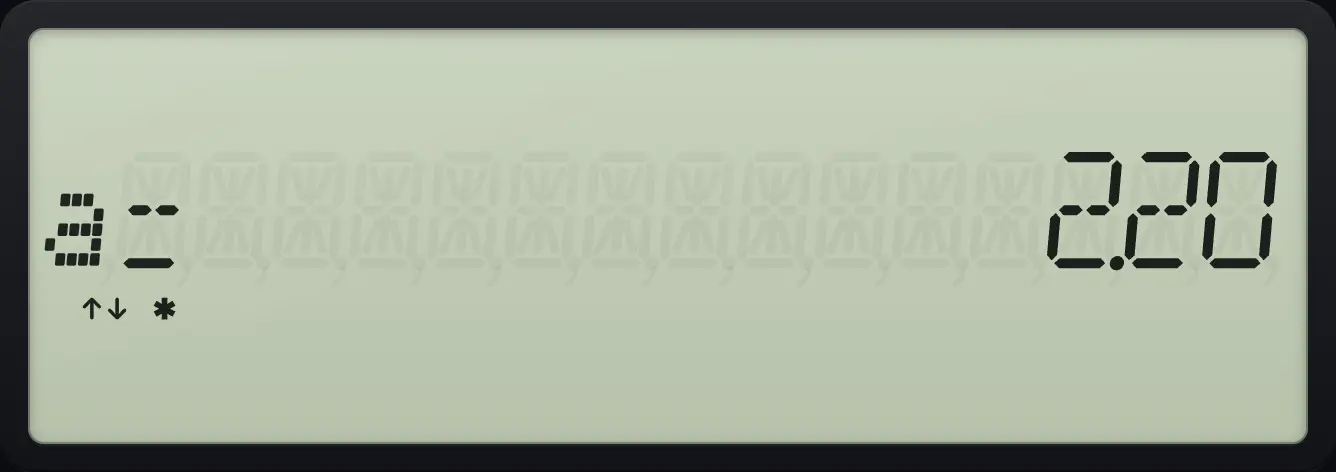
a= 2.20The line's slope b
One line further.
2NDDATA71ENTER↓2ENTER↓2ENTER↓4ENTER↓3ENTER↓5ENTER↓4ENTER↓4ENTER↓5ENTER↓5ENTER↓2NDSTAT8↓↓↓↓↓↓↓↓↓
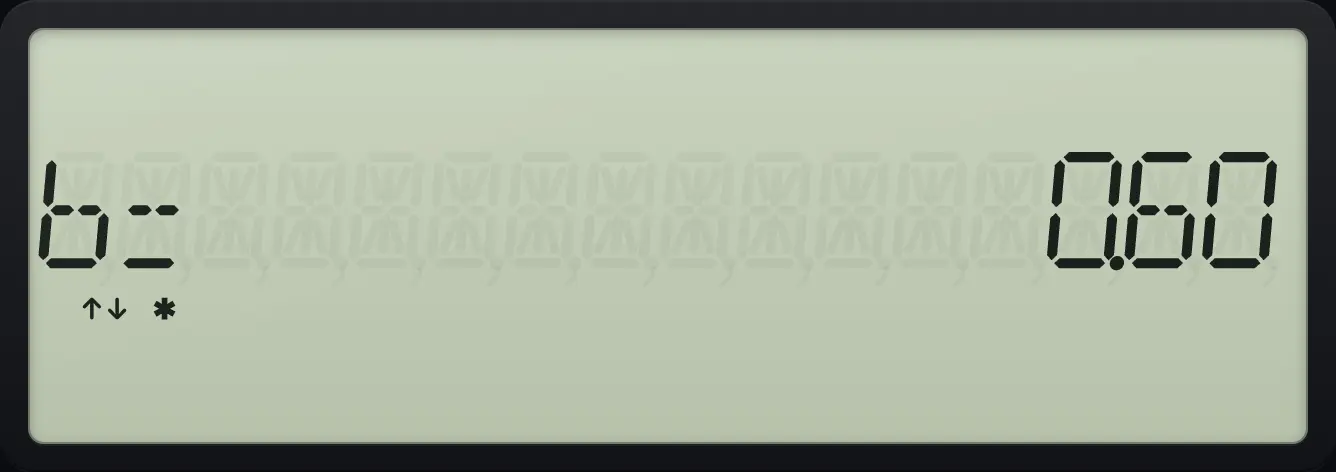
b= 0.60Correlation
Show nine decimals, then go to r.
2NDFORMAT.9ENTER2NDQUITCPT2NDDATA71ENTER↓2ENTER↓2ENTER↓4ENTER↓3ENTER↓5ENTER↓4ENTER↓4ENTER↓5ENTER↓5ENTER↓2NDSTAT8↓↓↓↓↓↓↓↓↓↓
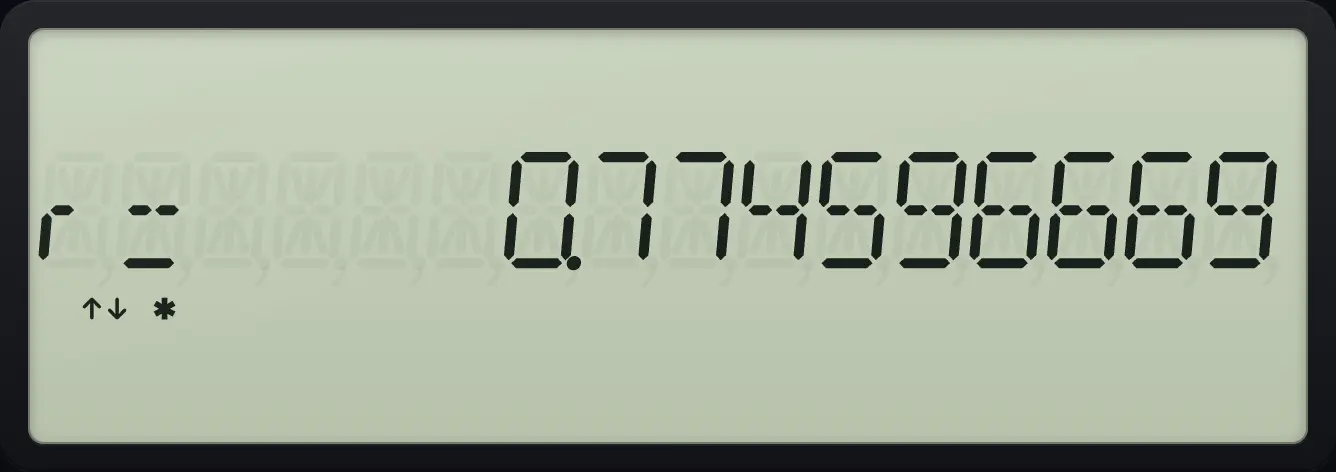
r= 0.774596669Sum of x
Σx is a few lines below.
2NDDATA71ENTER↓2ENTER↓2ENTER↓4ENTER↓3ENTER↓5ENTER↓4ENTER↓4ENTER↓5ENTER↓5ENTER↓2NDSTAT8↓↓↓↓↓↓↓↓↓↓↓↓↓
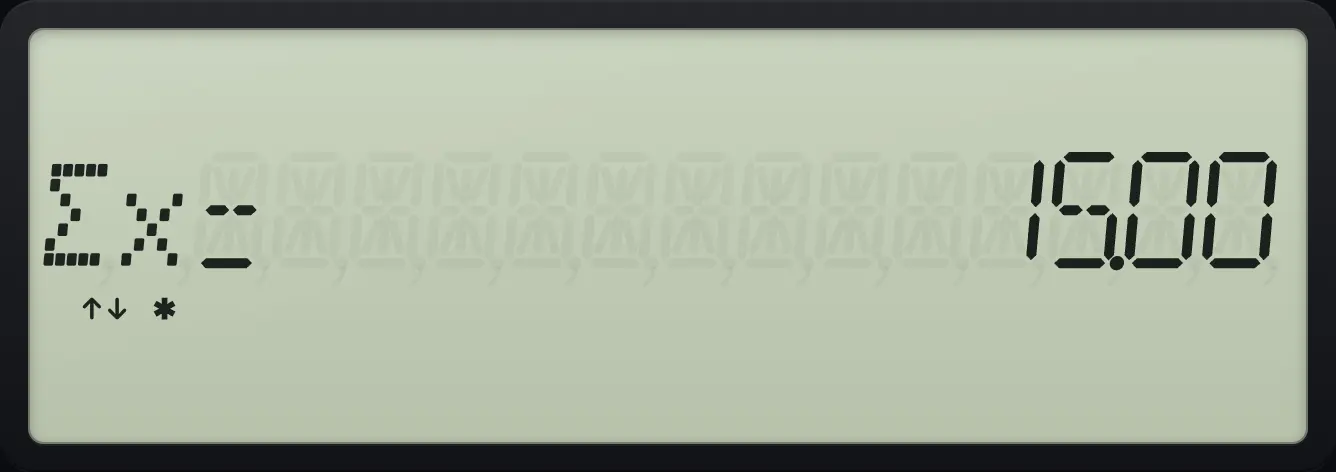
Σx= 15.00See also Find the mean and spread of one listSummarise paired data (x and y)Fit a straight line to dataMeasure how strongly two lists are related
11.3Forecast with the line#
X' and Y' give forecasts from the fitted curve. To forecast y from a known x, type the x on the Y' line, press ENTER, then press CPT. To forecast x from a known y, do the same on the X' line.
Forecast y for x = 6
Go to Y', type 6, enter, then CPT.
2NDDATA71ENTER↓2ENTER↓2ENTER↓4ENTER↓3ENTER↓5ENTER↓4ENTER↓4ENTER↓5ENTER↓5ENTER↓2NDSTAT8↓↓↓↓↓↓↓↓↓↓↓6ENTER↓CPT
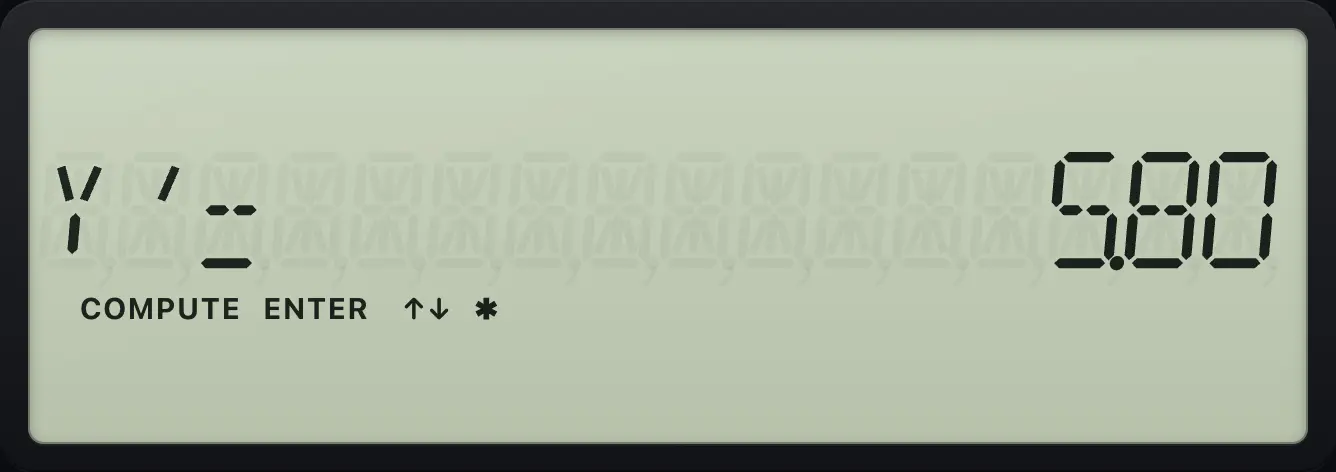
Y'= 5.80Other curves
Choose Ln with 2ND ENTER, then look at a.
2NDFORMAT.9ENTER2NDQUITCPT2NDDATA71ENTER↓2ENTER↓2ENTER↓4ENTER↓3ENTER↓5ENTER↓4ENTER↓4ENTER↓5ENTER↓5ENTER↓2NDSTAT82NDSETENTER↓↓↓↓↓↓↓↓
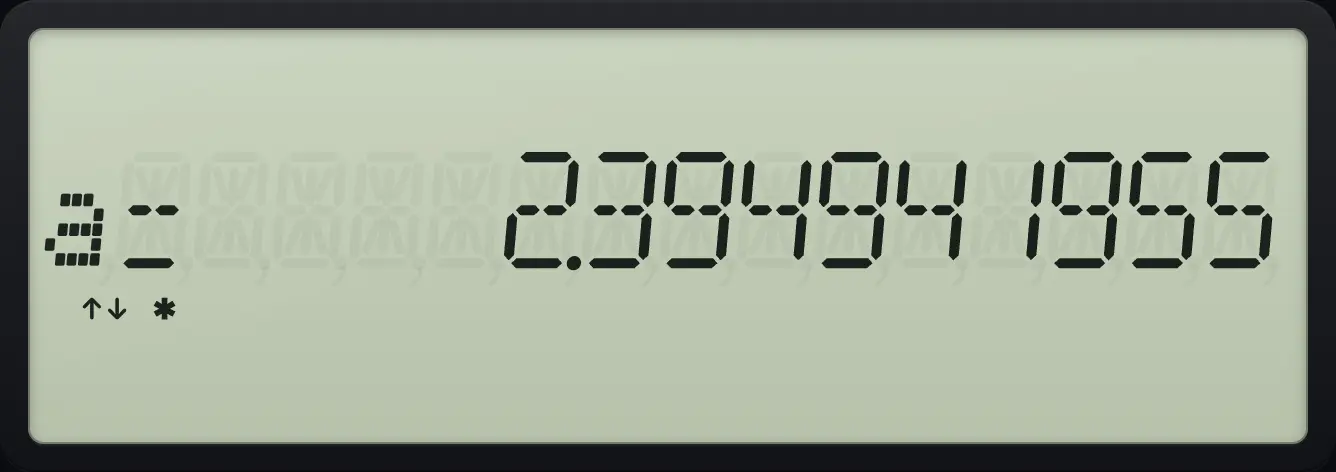
a= 2.394941955BA II Plus is a trademark of Texas Instruments Incorporated. Trident Calculator is an independent product by South View Studios and is not affiliated with, sponsored by or endorsed by Texas Instruments. The name is used only to describe the kind of calculator this model resembles; Trident's names, keys, display, fonts and software are its own clean-room design.