
Natural Color Graphing manual · Chapter 10 of 18
Polar, parametric and X= graphs
Graph r(θ), parametric curves and vertical lines.
10.1Choose the graph type#
In the function list press F3 (TYPE) and choose Y=, r=, Parm or X=. The X,θ,T key then types X, θ or T to match. A parametric function takes two lines: Xt and Yt.
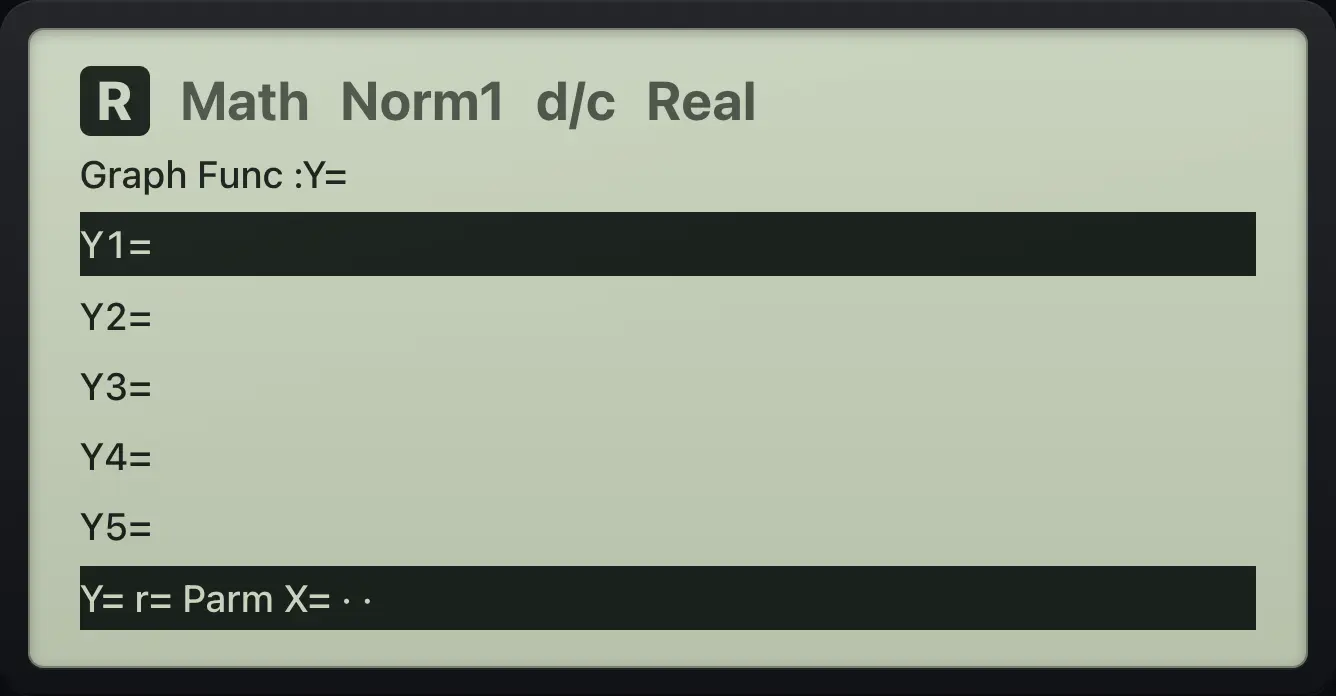
Polar line
TYPE, r=, then type X,θ,T.
MENU3F3F2X,θ,TEXE
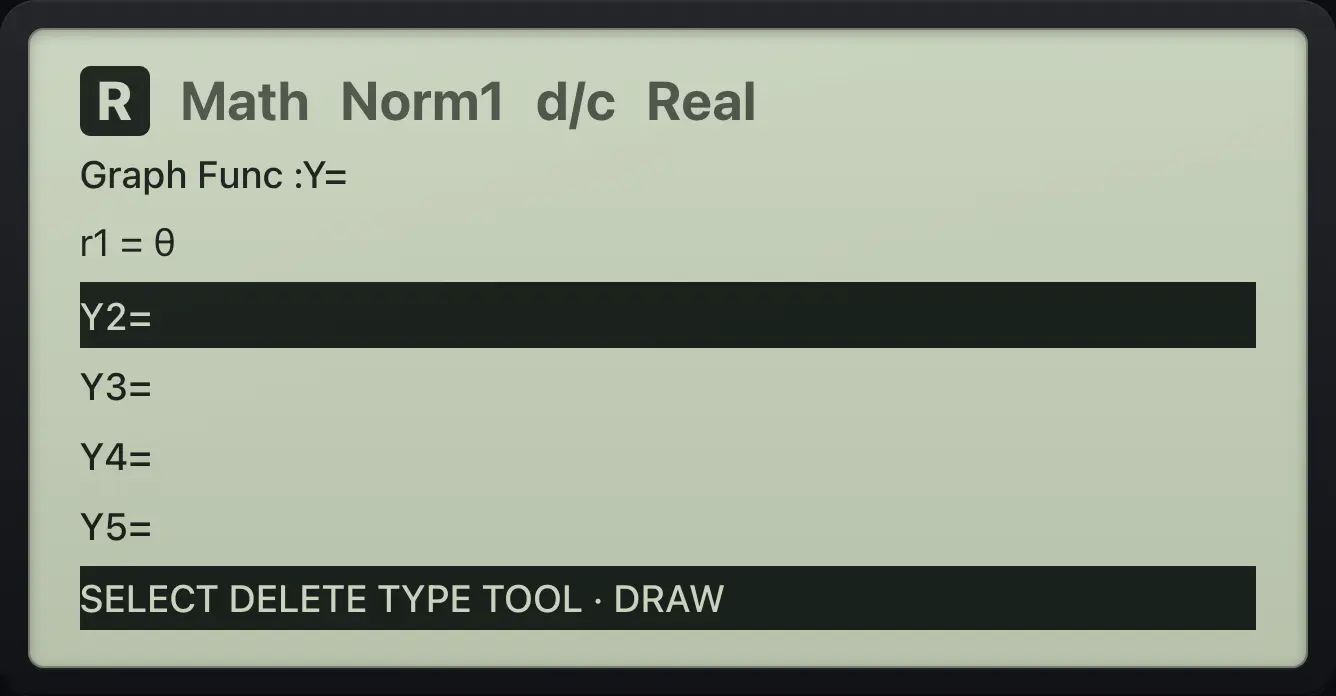
r1=θParametric lines
TYPE, Parm.
MENU3F3F3
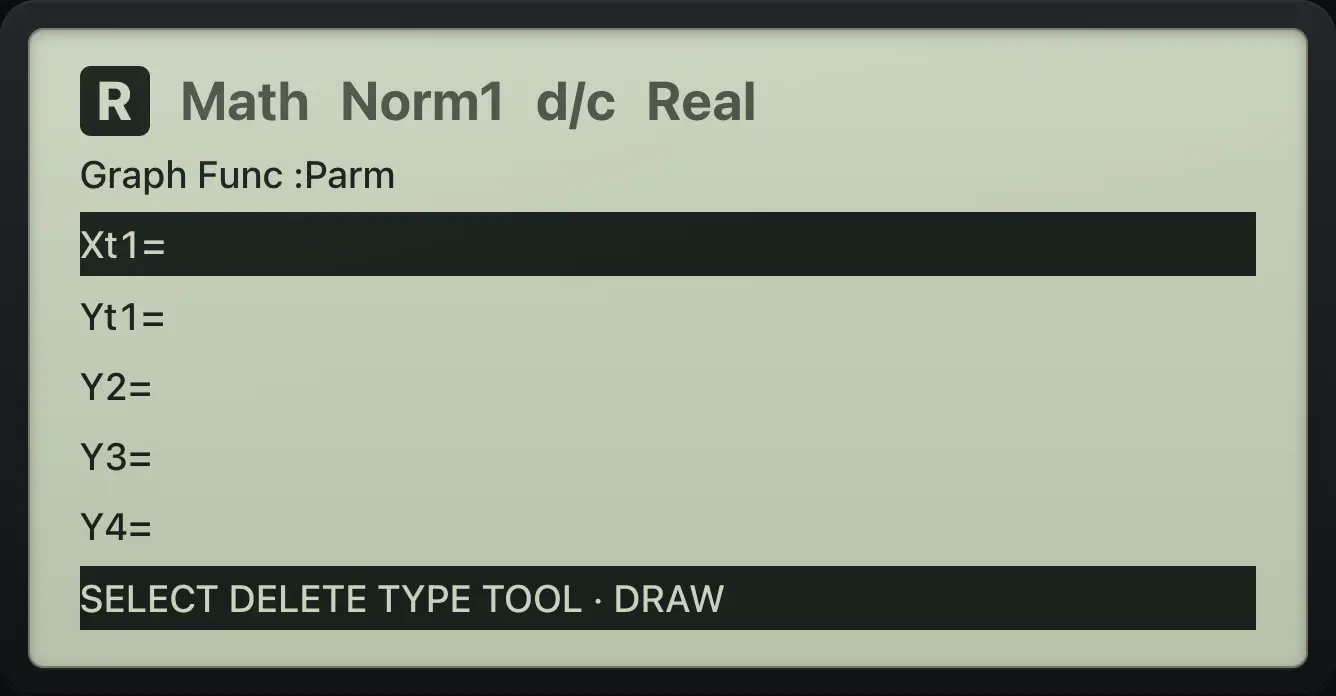
Xt1= Yt1=10.2Draw a polar graph#
A circle r = 2
TYPE, r=, type 2, EXE, DRAW, then trace.
MENU3F3F22EXEF6F1
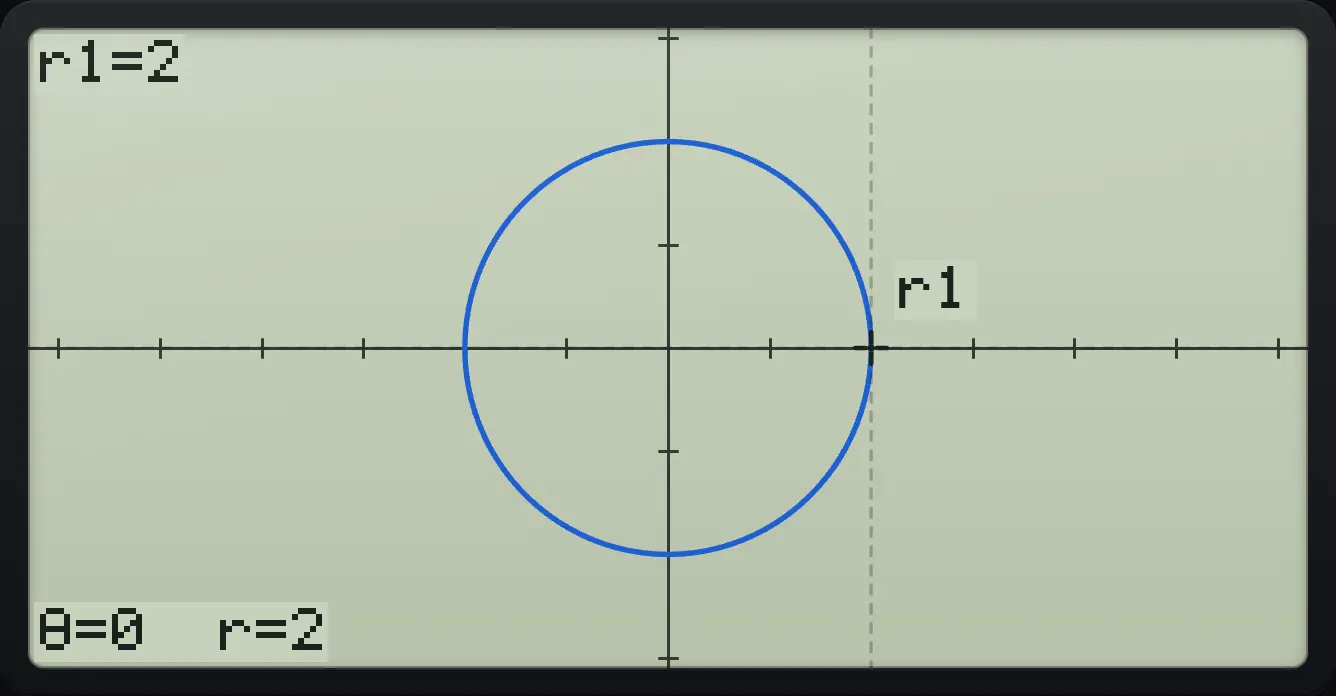
θ=0 r=210.3Draw a parametric graph#
An ellipse
TYPE, Parm; Xt = 2cos T, Yt = 3 sin T; DRAW; TRACE.
MENU3F3F32cosX,θ,TEXE3sinX,θ,TEXEF6F1
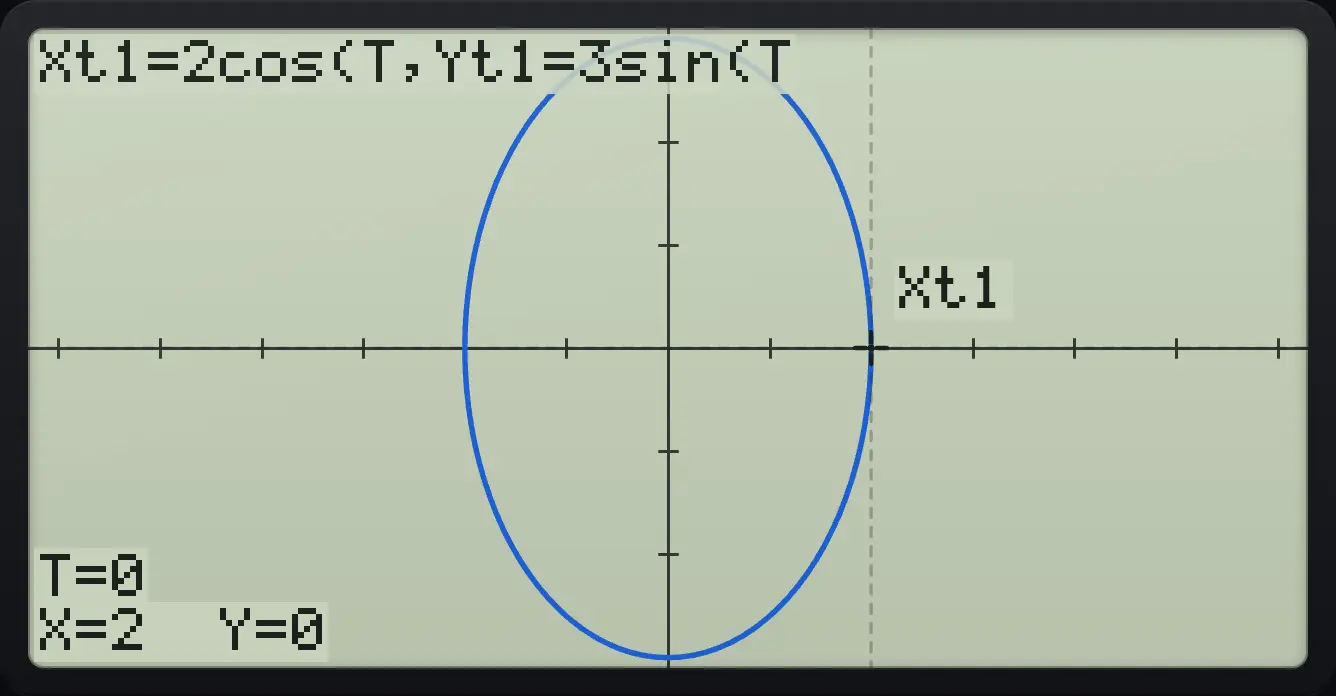
T=0 X=2 Y=010.4Draw a vertical line (X=)#
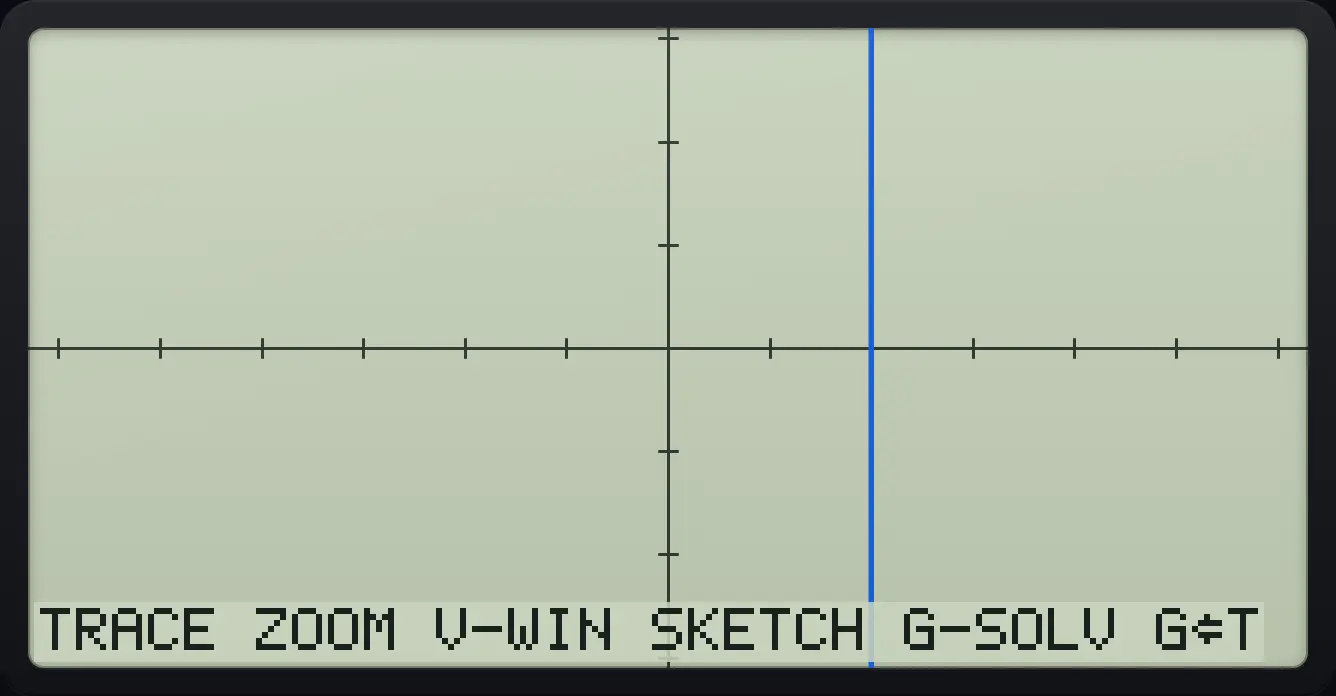
The line x = 2
TYPE, X=, type 2, EXE, DRAW.
MENU3F3F42EXEF6
TRACEfx-CG50 is a trademark of Casio Computer Co., Ltd.. Trident Calculator is an independent product by South View Studios and is not affiliated with, sponsored by or endorsed by Casio. The name is used only to describe the kind of calculator this model resembles; Trident's names, keys, display, fonts and software are its own clean-room design.