
Natural Color Graphing manual · Chapter 15 of 18
Tests and confidence intervals
Z and t tests, chi-squared, F test, ANOVA and confidence intervals.
15.1Hypothesis tests (TEST)#
In Statistics press F3 (TEST). Choose a group: Z, t, CHI, F or ANOVA. Each test opens a form; fill it in and press CALC (F1) or EXE on the last line. The result shows the alternative hypothesis, the test statistic and the p-value.
| F key | Group | Tests |
|---|---|---|
| F1 | Z | 1-Sample, 2-Sample, 1-Prop, 2-Prop |
| F2 | t | 1-Sample, 2-Sample, regression (REG) |
| F3 | CHI | GOF, 2-way (uses a matrix) |
| F4 | F | 2-sample F test |
| F5 | ANOVA | One-way ANOVA |
![The TEST bar The display shows: List 1 | List 2 | List 3 | List 4 | List 5 | List 6 / | | | | | / List 1[1]= / Z t CHI F ANOVA ·.](/trident/app/help/manual/img/6f43900as.webp)
1-Sample Z test from numbers
Choose Data: Variable, then fill in the summary values (the test value, σ, x̄ and n).
MENU2F3F1F1F2▼▼▼▼0.5EXE16EXEEXE
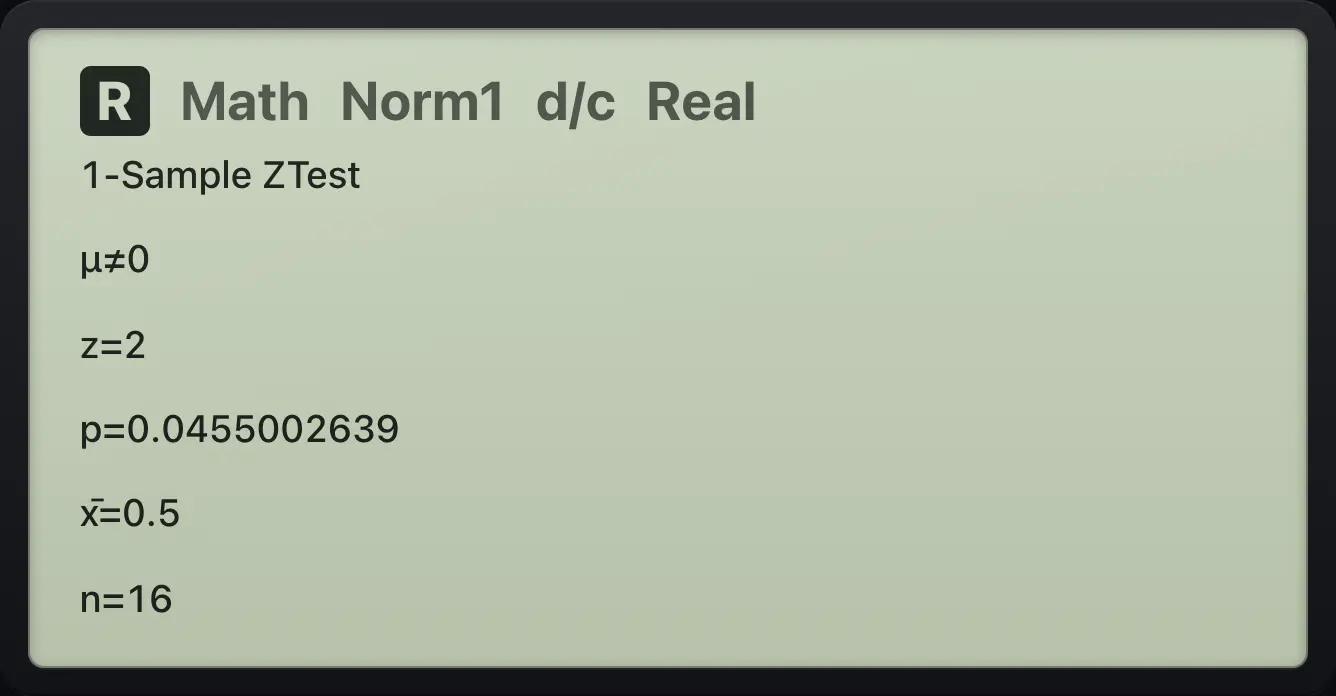
z=2 p=0.04550026391-Prop Z test
x = 60, n = 100, p0 = 0.5.
MENU2F3F1F3▼▼60EXE100EXEEXE
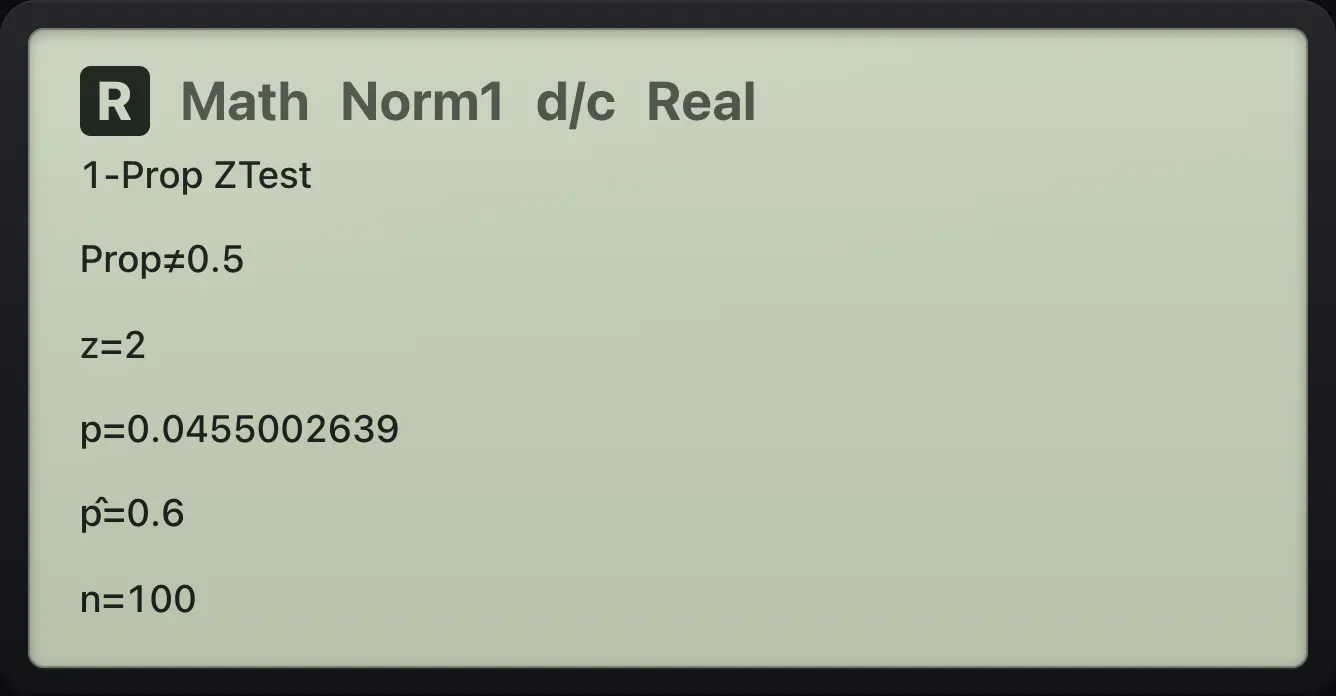
z=21-Sample t test from a list
Data 1 to 5; 1-Sample t, List.
MENU21EXE2EXE3EXE4EXE5EXEF3F2F1▼▼F1
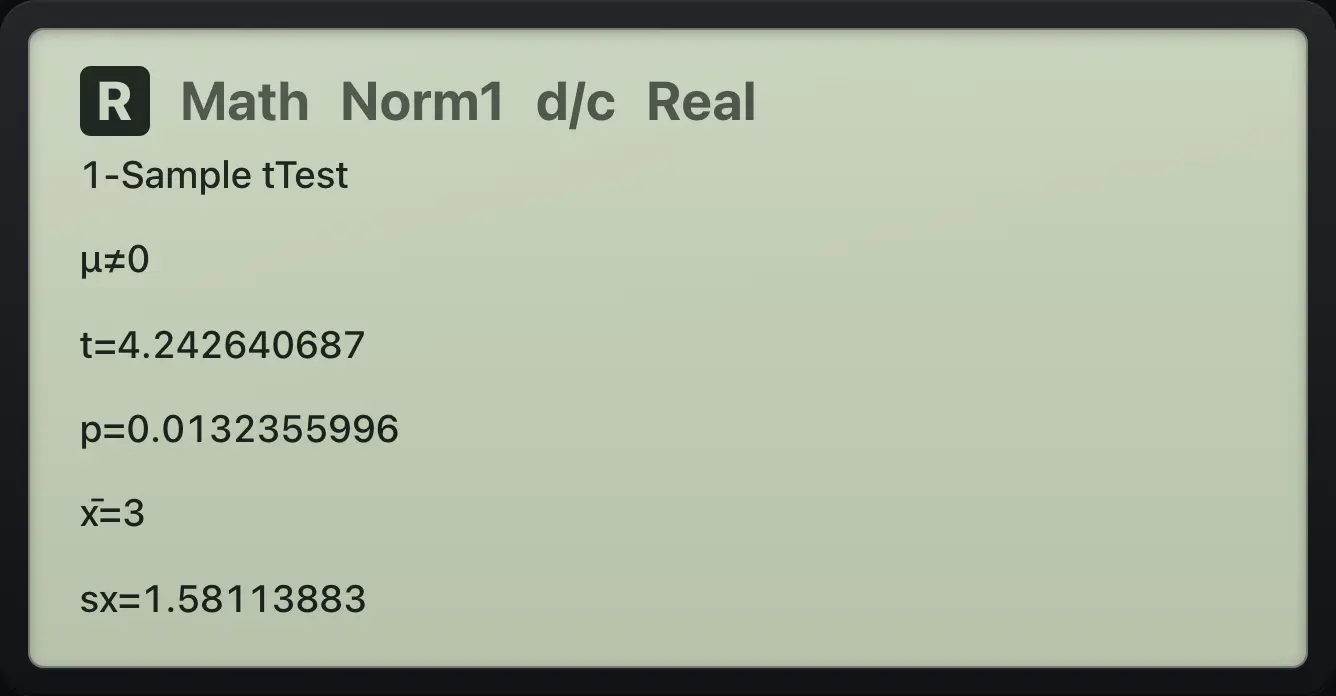
t=4.242640687Chi-squared goodness of fit
Observed 10, 20, 30 and expected 20, 20, 20.
MENU210EXE20EXE30EXE▲▲▲▶20EXE20EXE20EXEF3F3F1▼▼2EXEEXE
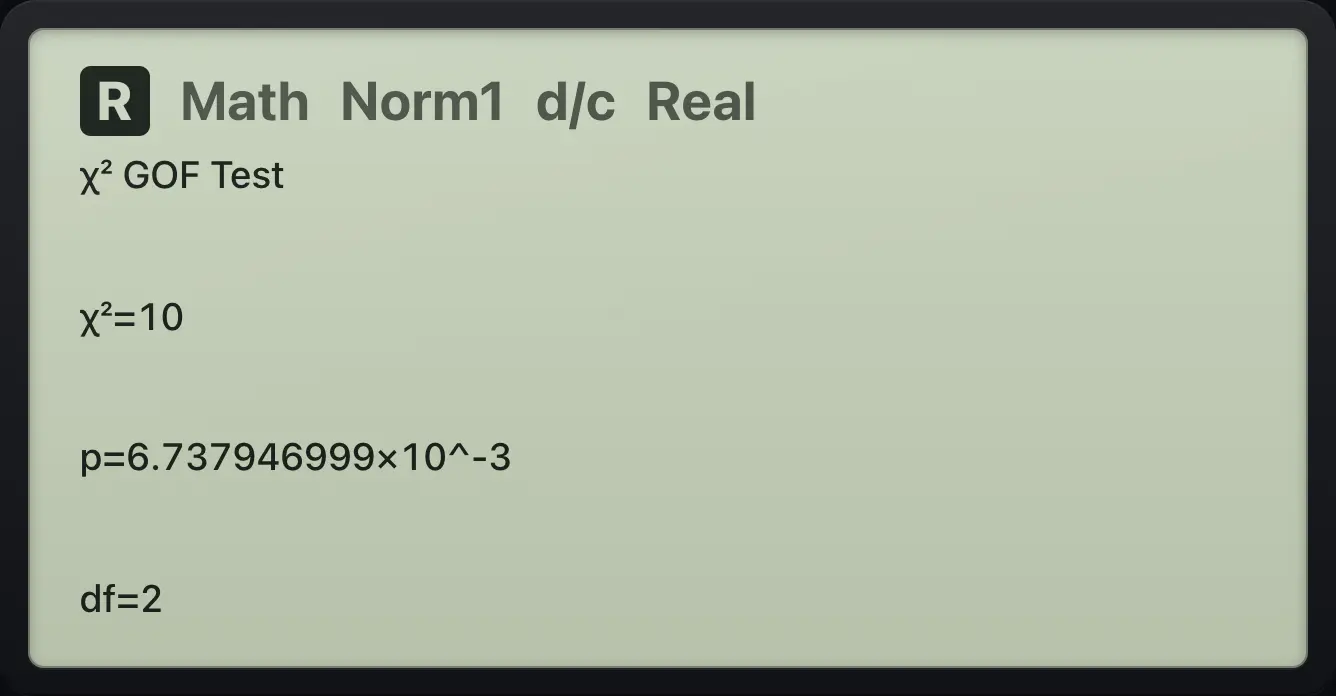
χ²=10 df=215.2Confidence intervals (INTR)#
Press F4 (INTR). The groups mirror the tests: Z and t intervals. The result shows Left and Right limits.
1-Sample t interval
Data 1 to 5.
MENU21EXE2EXE3EXE4EXE5EXEF4F2F1▼F1
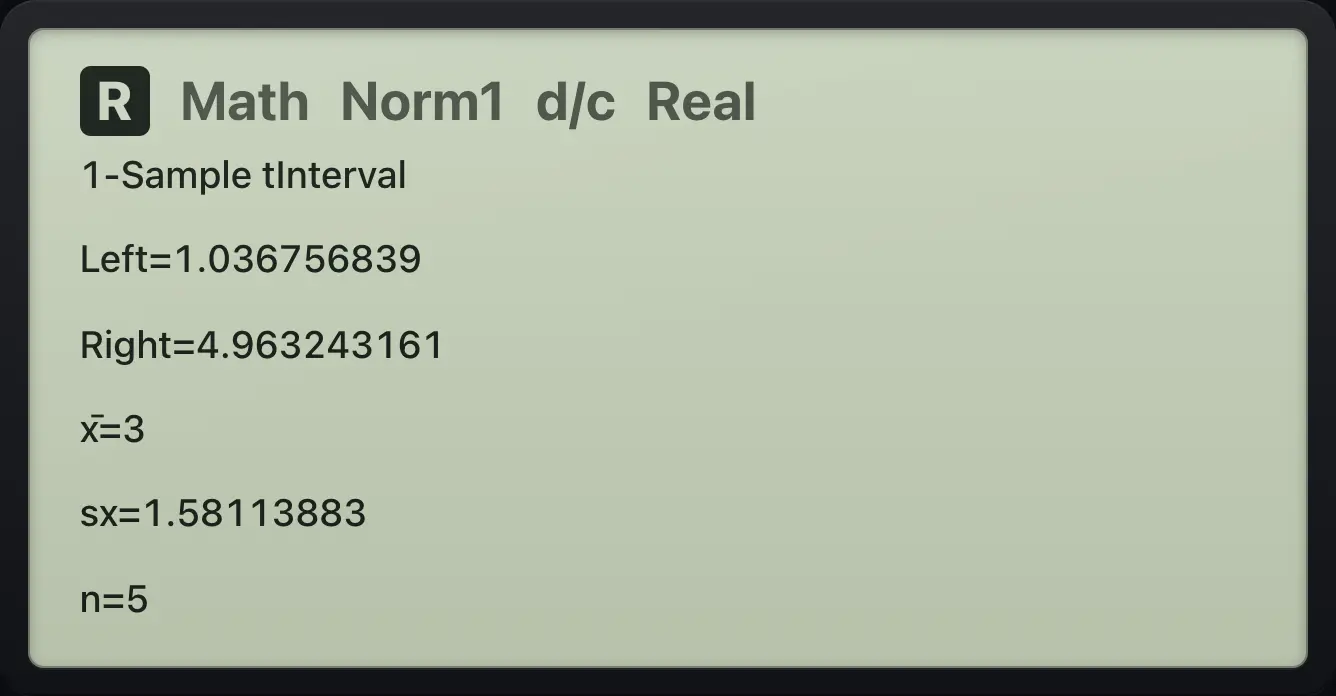
Left=1.036756839 Right=4.9632431611-Prop Z interval
x = 50, n = 100.
MENU2F4F1F3▼50EXE100EXEEXE
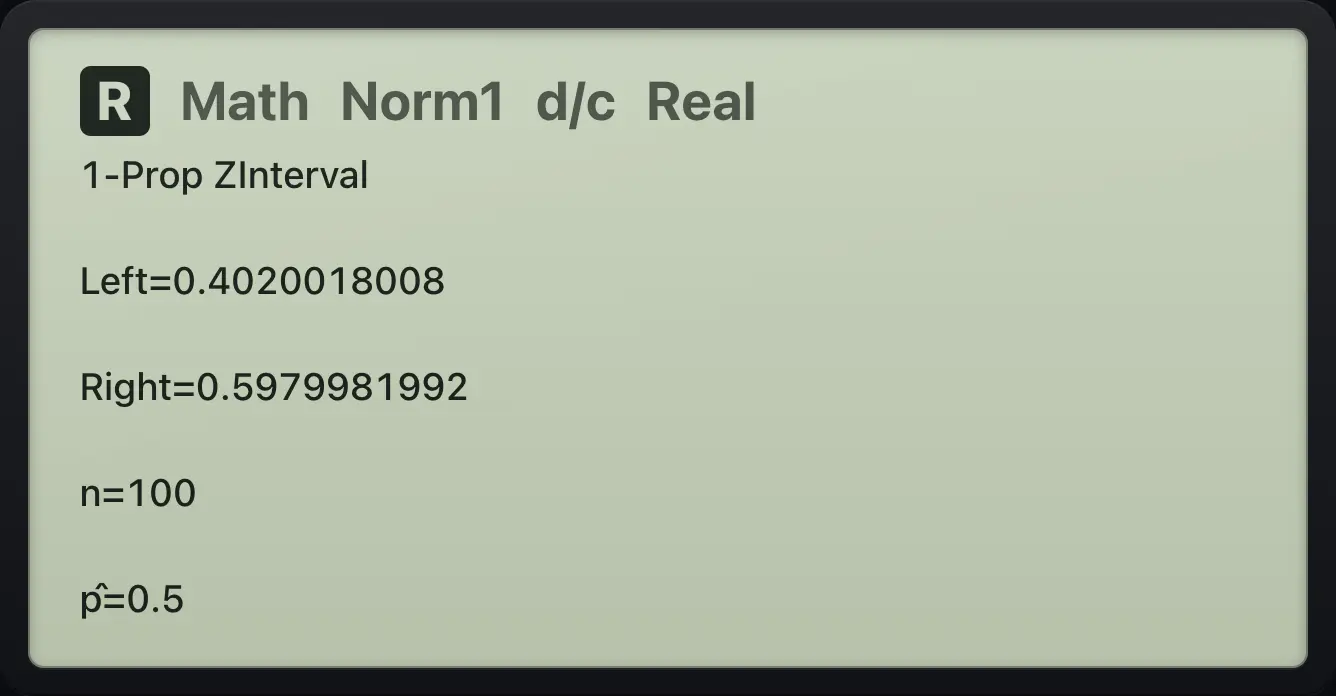
Left=0.4020018008fx-CG50 is a trademark of Casio Computer Co., Ltd.. Trident Calculator is an independent product by South View Studios and is not affiliated with, sponsored by or endorsed by Casio. The name is used only to describe the kind of calculator this model resembles; Trident's names, keys, display, fonts and software are its own clean-room design.