
Natural Color Graphing manual · Chapter 13 of 18
Statistical graphs
Scatter plots, line plots, histograms, box plots and normal curves.
13.1Draw a scatter plot#
With data in the lists press F1 (GRAPH) then F1 (GPH1). The window is chosen for you. GPH2 and GPH3 draw the other two statistical graphs. F4 (SELECT) turns them on or off and draws several at once. F6 (SET) chooses the graph type, the lists, the mark and the color.
A scatter plot
x = 1 to 4, y = 2, 3, 5, 4; GRAPH, GPH1.
MENU21EXE2EXE3EXE4EXE▲▲▲▲▶2EXE3EXE5EXE4EXEF1F1
EXIT returns to the GRAPH bar.
EXIT
![Result of the example "A scatter plot" The display shows: List 1 | List 2 | List 3 | List 4 | List 5 | List 6 / 1 | 2 | | | | / 2 | 3 | | | | / 3 | 5 | | | | / 4 | 4 | | | | / | | | | | / List 2[5]= / GPH1 GPH2 GPH3 SELECT · SET.](/trident/app/help/manual/img/d812b847s.webp)
GPH1 GPH2 GPH3![The GRAPH bar in Statistics The display shows: List 1 | List 2 | List 3 | List 4 | List 5 | List 6 / | | | | | / List 1[1]= / GPH1 GPH2 GPH3 SELECT · SET.](/trident/app/help/manual/img/78e4087cs.webp)
13.2Histogram, box plot and more#
In SET (GRAPH, SET) the Graph Type can be Scatter, xyLine, Hist, MedBox, NDist and more. Choose the type with the F keys, EXIT, then GPH1.
A histogram
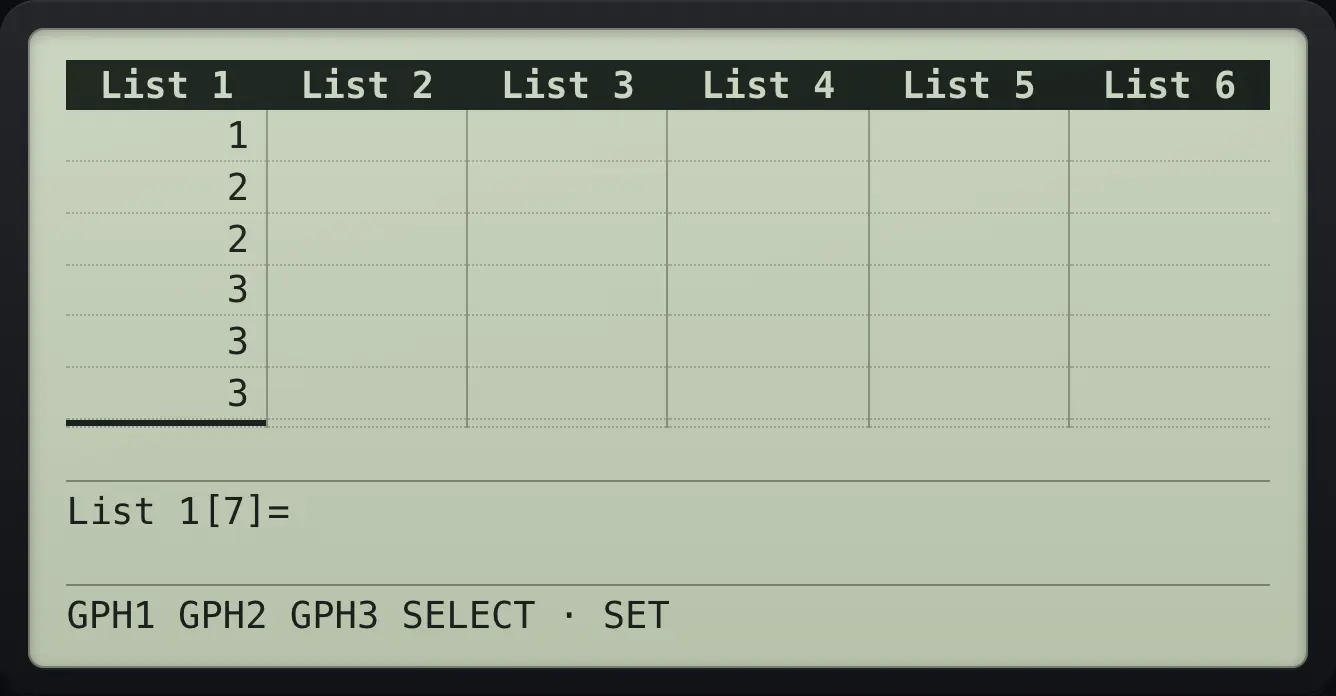
Data 1, 2, 2, 3, 3, 3; SET, Hist; GPH1.
MENU21EXE2EXE2EXE3EXE3EXE3EXEF1F6▼F3EXITF1F1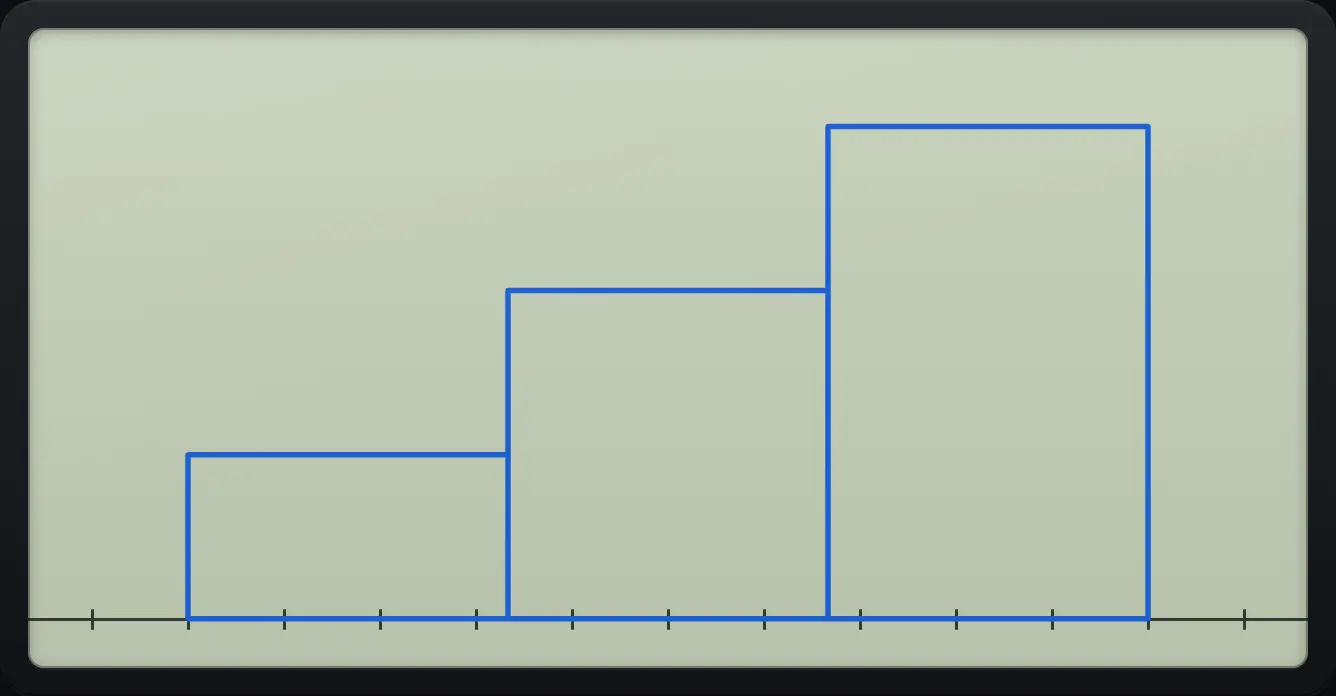
EXIT returns to the GRAPH bar.
EXIT
GPH1 GPH2 GPH3A box plot
Data 1 to 5; SET, MedBox; GPH1.
MENU21EXE2EXE3EXE4EXE5EXEF1F6▼F4EXITF1F1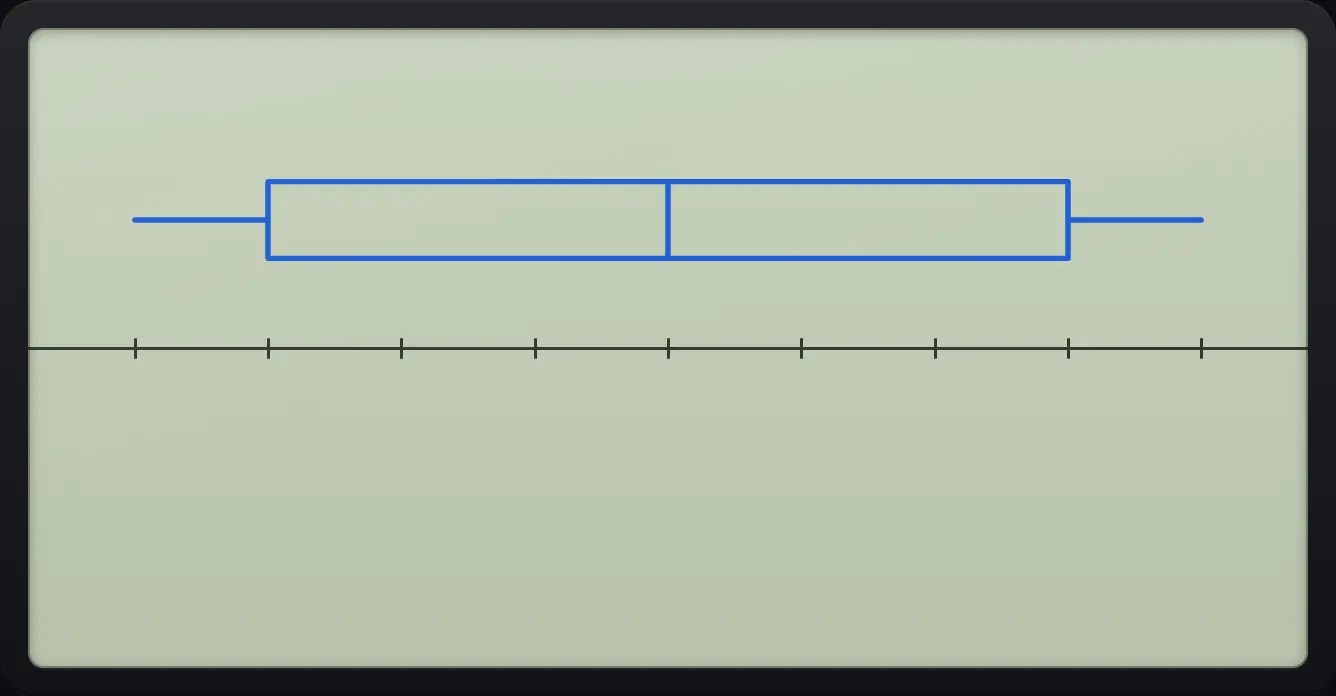
EXIT returns to the GRAPH bar.
EXIT
![Result of the example "A box plot" The display shows: List 1 | List 2 | List 3 | List 4 | List 5 | List 6 / 1 | | | | | / 2 | | | | | / 3 | | | | | / 4 | | | | | / 5 | | | | | / | | | | | / List 1[6]=.](/trident/app/help/manual/img/814f0385s.webp)
GPH1 GPH2 GPH3The normal curve
Data 1 to 5; SET, NDist; GPH1.
MENU21EXE2EXE3EXE4EXE5EXEF1F6▼F5EXITF1F1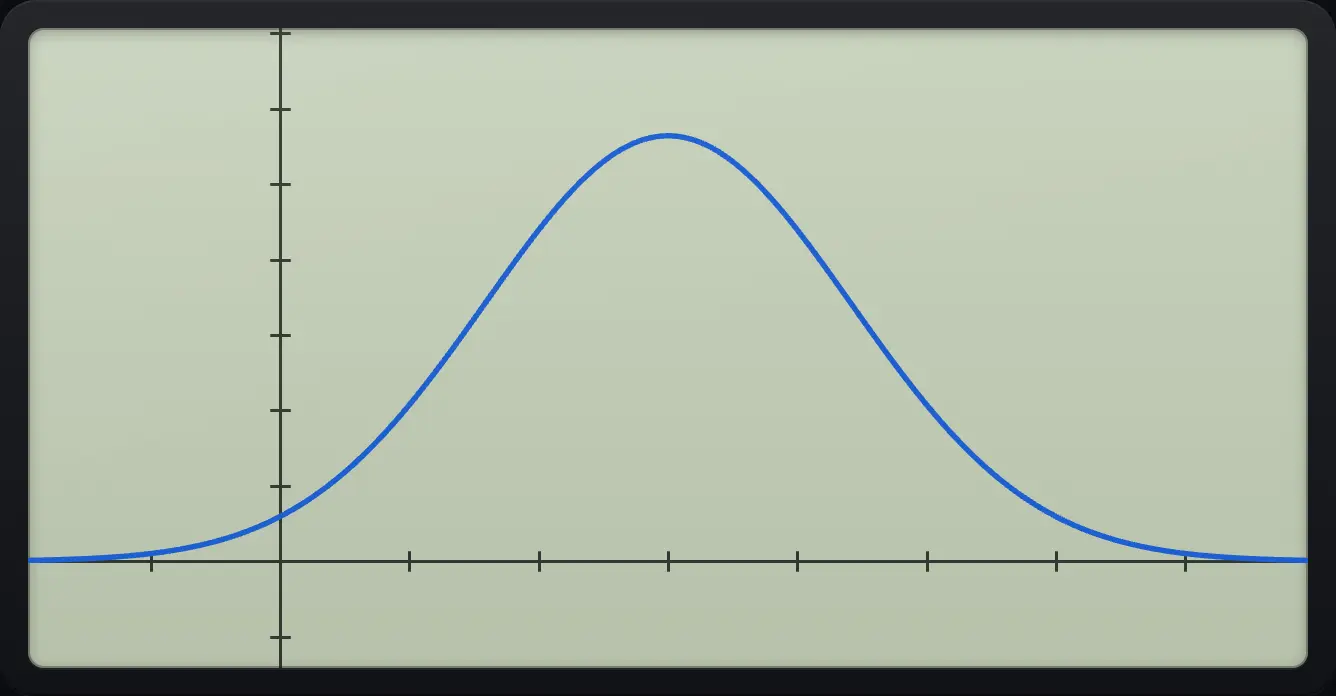
EXIT returns to the GRAPH bar.
EXIT
![Result of the example "The normal curve" The display shows: List 1 | List 2 | List 3 | List 4 | List 5 | List 6 / 1 | | | | | / 2 | | | | | / 3 | | | | | / 4 | | | | | / 5 | | | | | / | | | | | / List 1[6]=.](/trident/app/help/manual/img/92ac7c70s.webp)
GPH1 GPH2 GPH3fx-CG50 is a trademark of Casio Computer Co., Ltd.. Trident Calculator is an independent product by South View Studios and is not affiliated with, sponsored by or endorsed by Casio. The name is used only to describe the kind of calculator this model resembles; Trident's names, keys, display, fonts and software are its own clean-room design.