
Natural Color Graphing manual · Chapter 12 of 18
Statistics: lists and calculations
Enter data in six lists, then get one-variable and two-variable statistics and regression.
12.1Enter data in the list editor#
Press MENU then 2. Six lists, List 1 to List 6, appear as columns. Type a number and press EXE; it is stored and the cursor drops to the next row. Use the arrows to move around. The bottom bar offers GRAPH, CALC, TEST, INTR, DIST and, on page 2 (F6), DEL, DEL-ALL and INS.
Enter 1, 2, 3
Open Statistics and type three values.
MENU21EXE2EXE3EXE![After step 1: Open Statistics and type three values. The display shows: List 1 | List 2 | List 3 | List 4 | List 5 | List 6 / 1 | | | | | / 2 | | | | | / 3 | | | | | / | | | | | / List 1[4]= / GRAPH CALC TEST INTR DIST ▷.](/trident/app/help/manual/img/aa1c57d9s.webp)
List 1[4]=Delete a row
Enter 1, 2, 3, go up twice, then DEL (page 2).
MENU21EXE2EXE3EXE▲▲F6F1
![Result of the example "Delete a row" The display shows: List 1 | List 2 | List 3 | List 4 | List 5 | List 6 / 1 | | | | | / 3 | | | | | / | | | | | / List 1[2]=3 / DEL DEL-ALL INS · · ▷.](/trident/app/help/manual/img/e6c4c170s.webp)
List 1[2]=3Insert a row
Enter 1, 2, 3, go up twice, then INS.
MENU21EXE2EXE3EXE▲▲F6F3
![Result of the example "Insert a row" The display shows: List 1 | List 2 | List 3 | List 4 | List 5 | List 6 / 1 | | | | | / 0 | | | | | / 2 | | | | | / 3 | | | | | / | | | | | / List 1[2]=0 / DEL DEL-ALL INS · · ▷.](/trident/app/help/manual/img/f4b75f4es.webp)
List 1[2]=0Clear a list
Enter 1, 2, 3, then DEL-ALL.
MENU21EXE2EXE3EXEF6F2
![Result of the example "Clear a list" The display shows: List 1 | List 2 | List 3 | List 4 | List 5 | List 6 / | | | | | / List 1[1]= / DEL DEL-ALL INS · · ▷.](/trident/app/help/manual/img/ddfbd5a5s.webp)
List 1[1]=Lists are shared with Run-Matrix
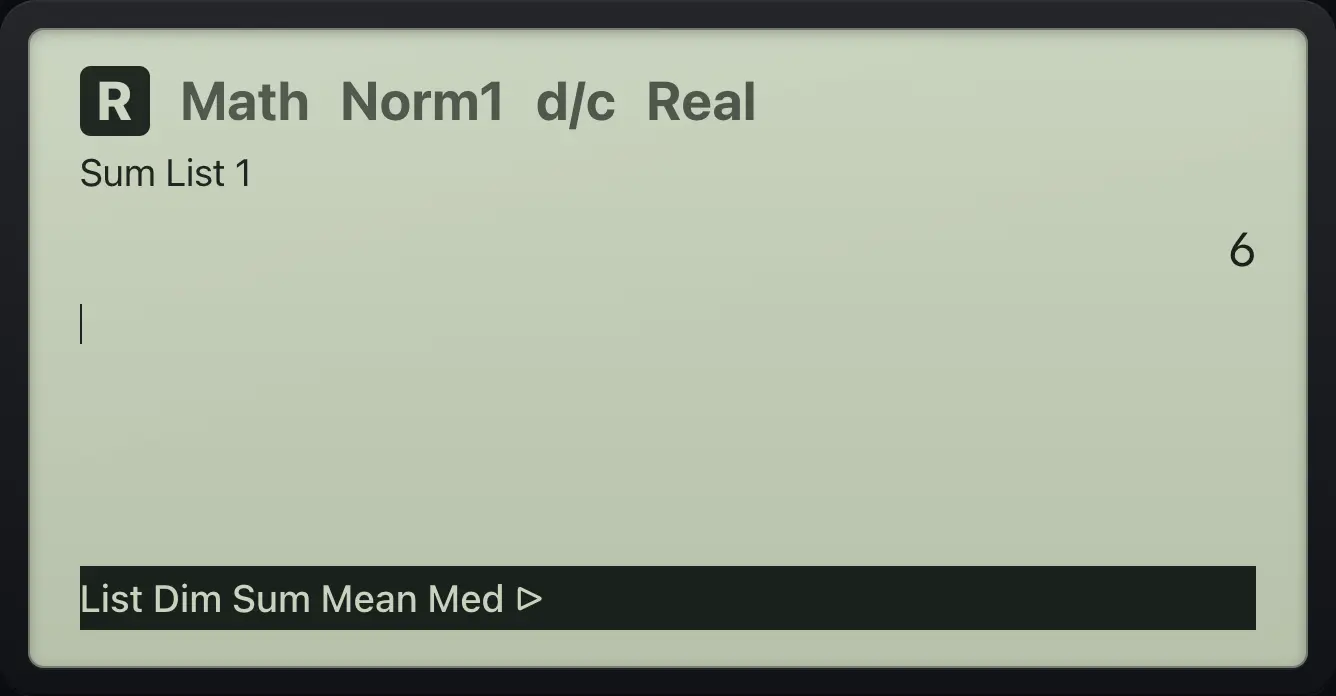
Enter 1, 2, 3, then in Run-Matrix take the Sum of List 1.
MENU21EXE2EXE3EXEMENU1OPTNF1F3OPTNF1F11EXE
612.2One-variable statistics#
With data in List 1 press F2 (CALC) then F1 (1-VAR). Scroll with ▼. The results are x̄, Σx, Σx², σx, sx, n, minX, Q1, Med, Q3, maxX.
Mean and spread of 1 to 5
Enter 1 to 5 and choose 1-VAR.
MENU21EXE2EXE3EXE4EXE5EXEF2F1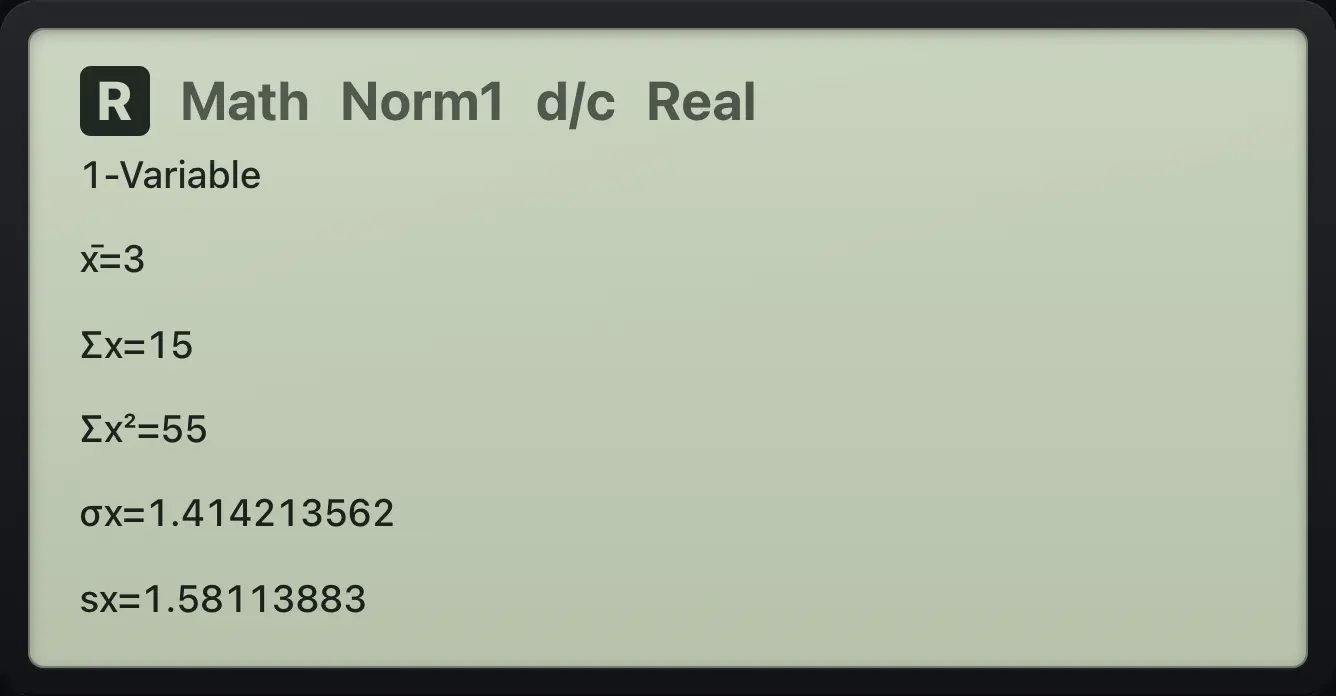
1-Variable x̄=3 Σx=15 Σx²=55 σx=1.414213562 sx=1.58113883Quartiles
Scroll down to the end of the list.
MENU21EXE2EXE3EXE4EXE5EXEF2F1▼▼▼▼▼▼▼▼▼▼▼
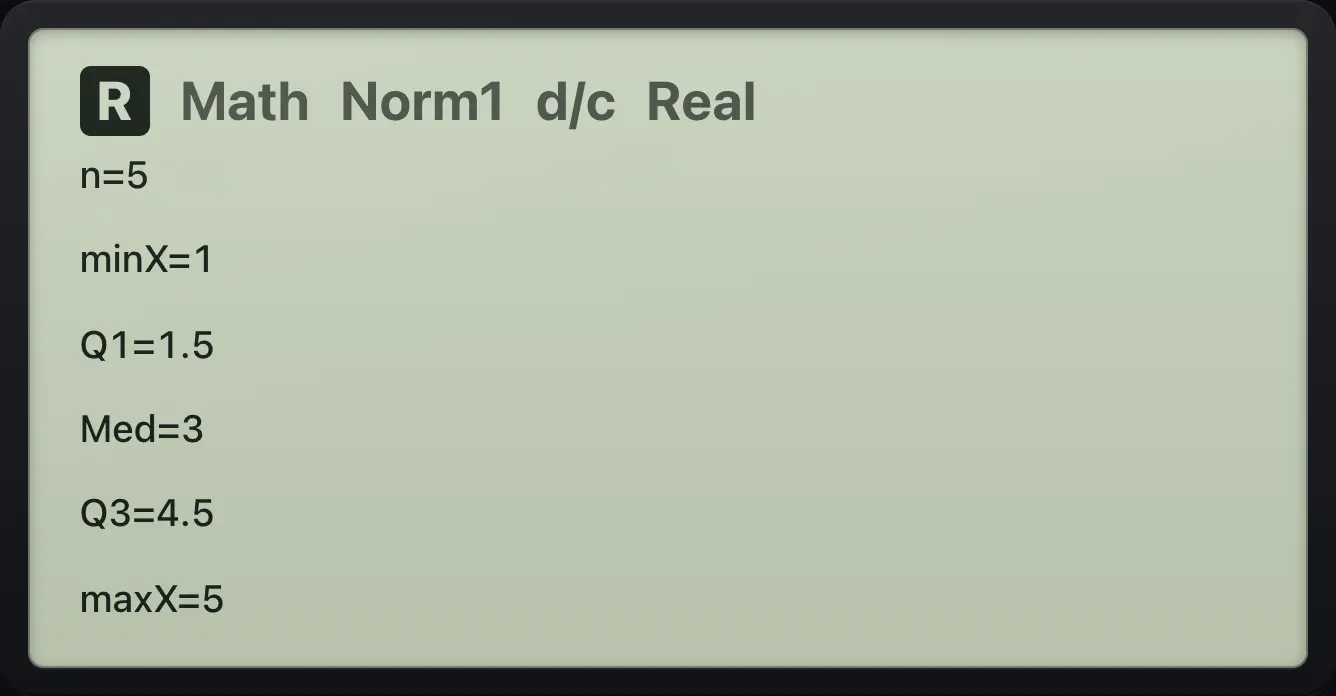
Q1=1.5 Med=3 Q3=4.5 maxX=5A frequency list
List 1 = 1, 2 and List 2 = 3, 1. In CALC, SET, move to 1Var Freq and choose List 2.
MENU21EXE2EXE▲▲▶3EXE1EXEF2F4▼2EXEEXITF1
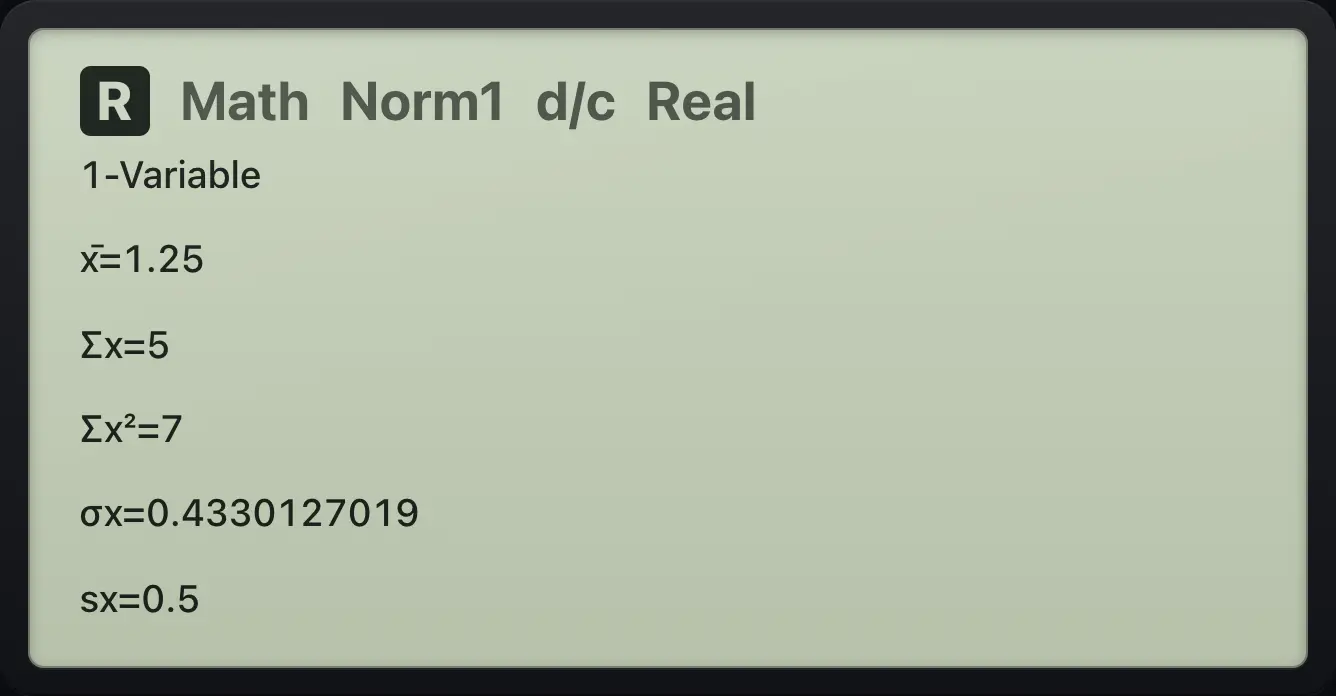
x̄=1.25 Σx=512.3Two-variable statistics#
Put x in List 1 and y in List 2 (type all of List 1, go up to the top, press right, and type List 2). Choose F2 (CALC) then F2 (2-VAR).
2-VAR results
x = 1, 2, 3 and y = 2, 4, 7.
MENU21EXE2EXE3EXE▲▲▲▶2EXE4EXE7EXEF2F2▼▼▼▼▼▼▼▼
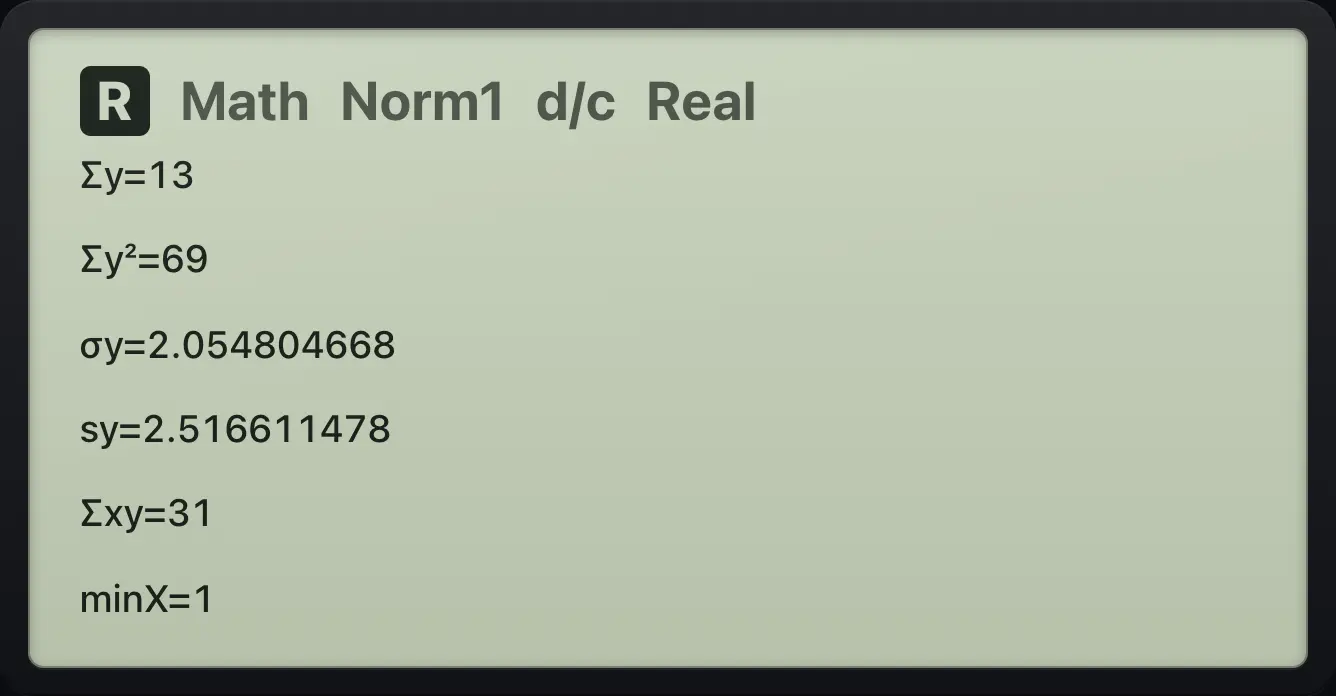
Σxy=3112.4Regression lines and curves#
With x and y data, press F2 (CALC), then F3 (REG) and pick a model. The fit is shown with its coefficients. F1 (COPY) copies the equation to the function list, and F6 (DRAW) draws the data and the curve.
| F key | Model | Coefficients shown |
|---|---|---|
| F1 then F1 or F2 | X: ax+b or a+bx | a, b, r, r² |
| F2 | Med-Med line | a, b |
| F3 | X² quadratic | a, b, c, r² |
| F4 | X³ cubic | a, b, c, d |
| F5 | X⁴ quartic | a, b, c, d, e |
| F6 then F1 | Log | a, b |
| F6 then F2 | Exp: ae^bx or ab^x | a, b |
| F6 then F3 | Power | a, b |
| F6 then F4 | Sin | a, b, c, d |
| F6 then F5 | Logistic | a, b, c |
A perfect line
x = 1 to 5, y = 3, 5, 7, 9, 11; CALC, REG, X, ax+b.
MENU21EXE2EXE3EXE4EXE5EXE▲▲▲▲▲▶3EXE5EXE7EXE9EXE11EXEF2F3F1F1
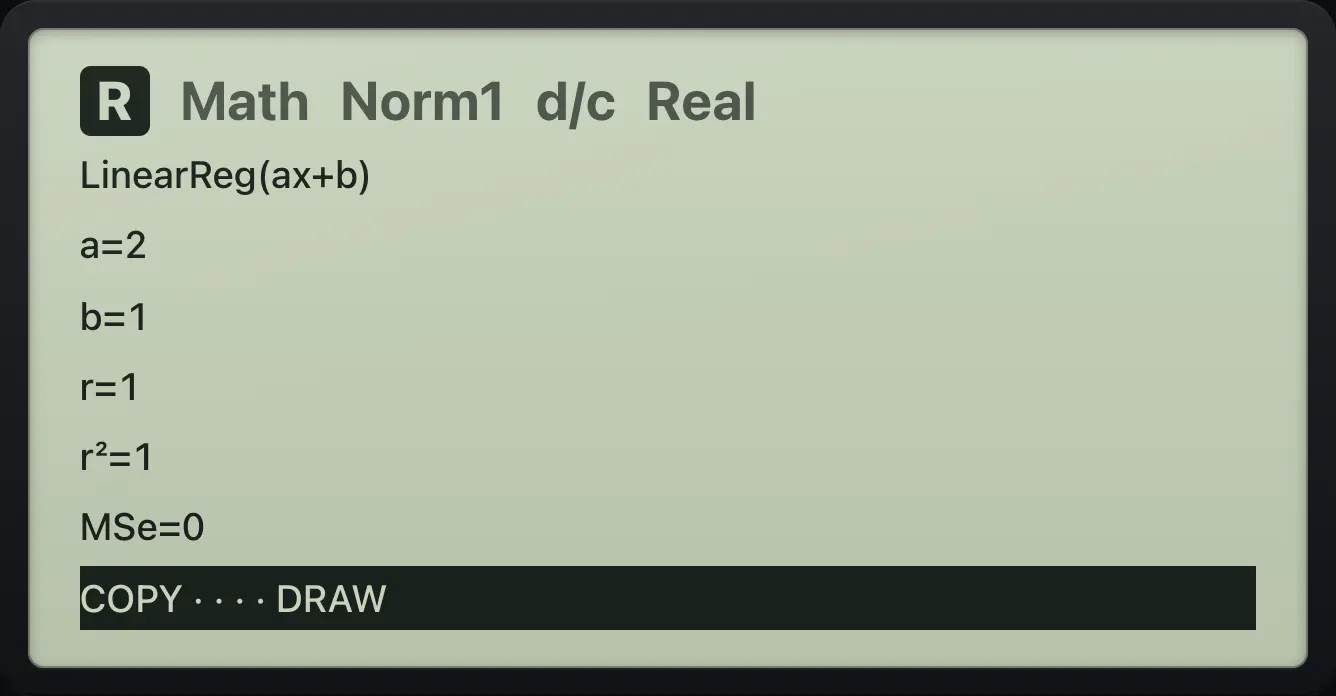
LinearReg(ax+b) a=2 b=1 r=1Quadratic fit
x = 1 to 4, y = 2, 5, 10, 17; REG, X².
MENU21EXE2EXE3EXE4EXE▲▲▲▲▶2EXE5EXE10EXE17EXEF2F3F3
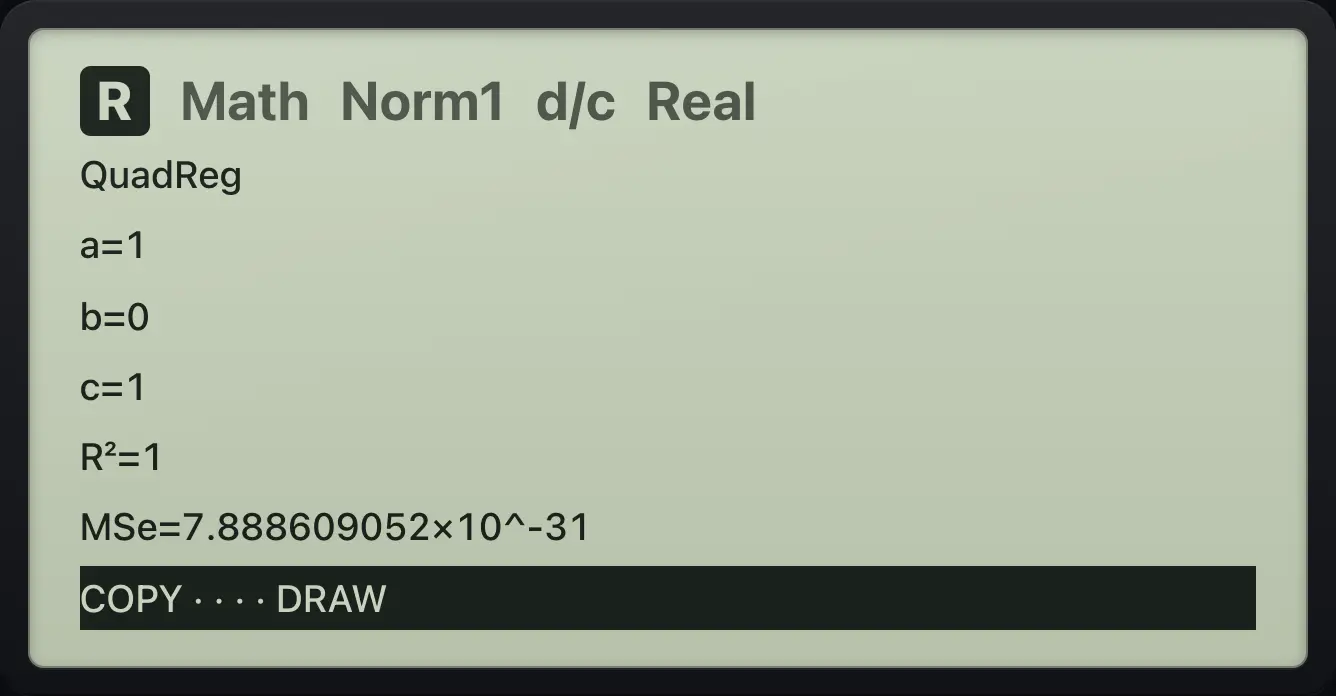
a=1 b=0 c=1Copy the fit to Y=
Linear fit, then COPY.
MENU21EXE2EXE3EXE4EXE5EXE▲▲▲▲▲▶3EXE5EXE7EXE9EXE11EXEF2F3F1F1F1
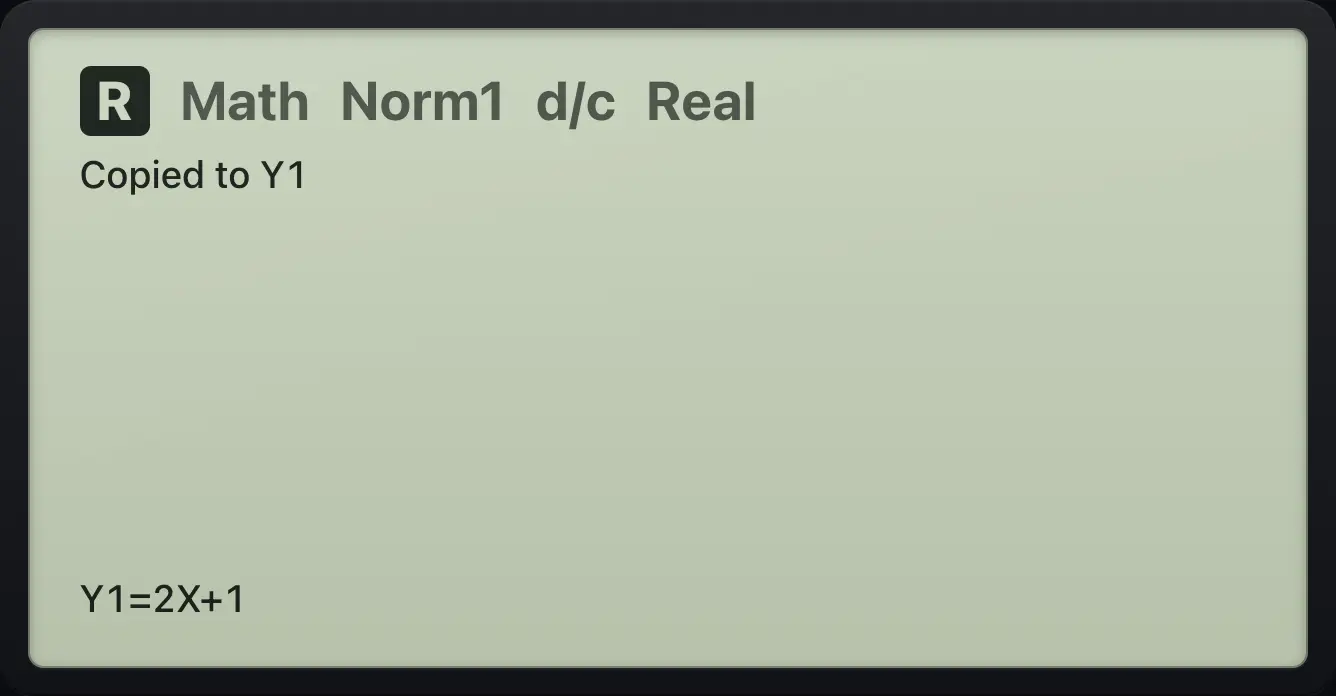
Copied to Y1Exponential fit
x = 0 to 3, y = 3, 6, 12, 24; REG, Exp, ab^x.
MENU20EXE1EXE2EXE3EXE▲▲▲▲▶3EXE6EXE12EXE24EXEF2F3F6F2F2
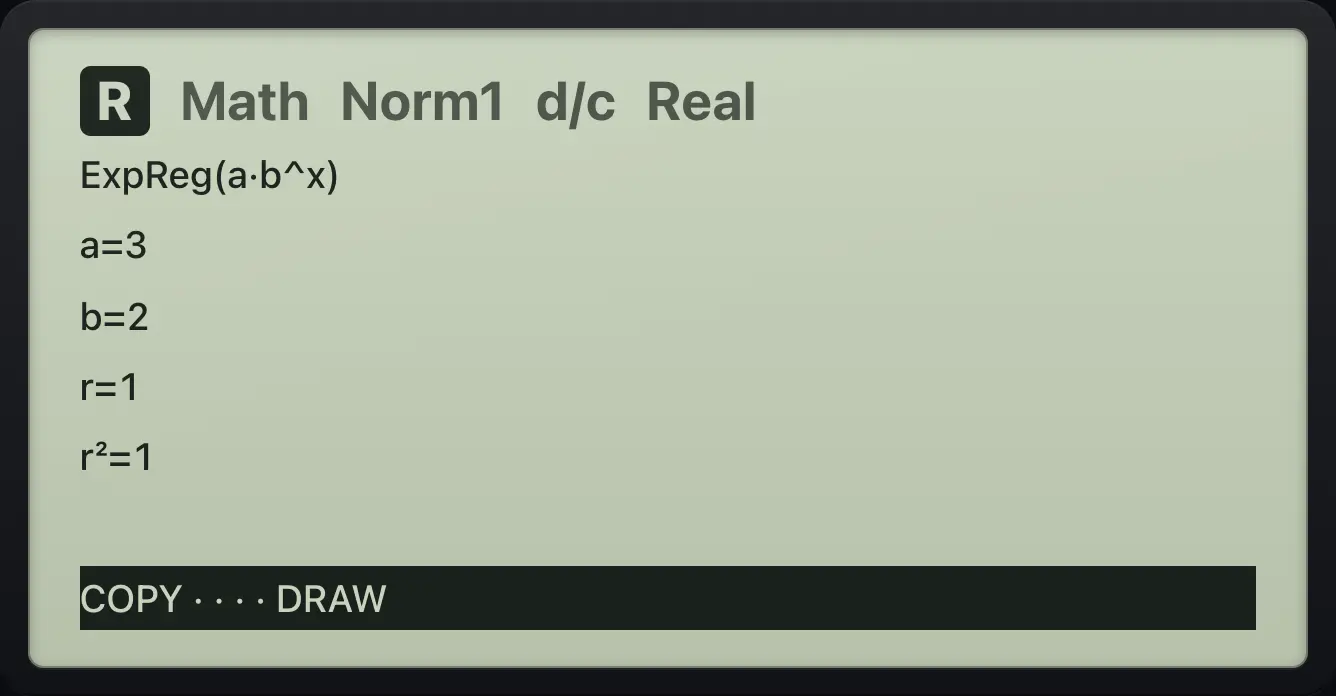
a=3 b=2Power fit
x = 1 to 4, y = 2, 16, 54, 128; REG, Power.
MENU21EXE2EXE3EXE4EXE▲▲▲▲▶2EXE16EXE54EXE128EXEF2F3F6F3
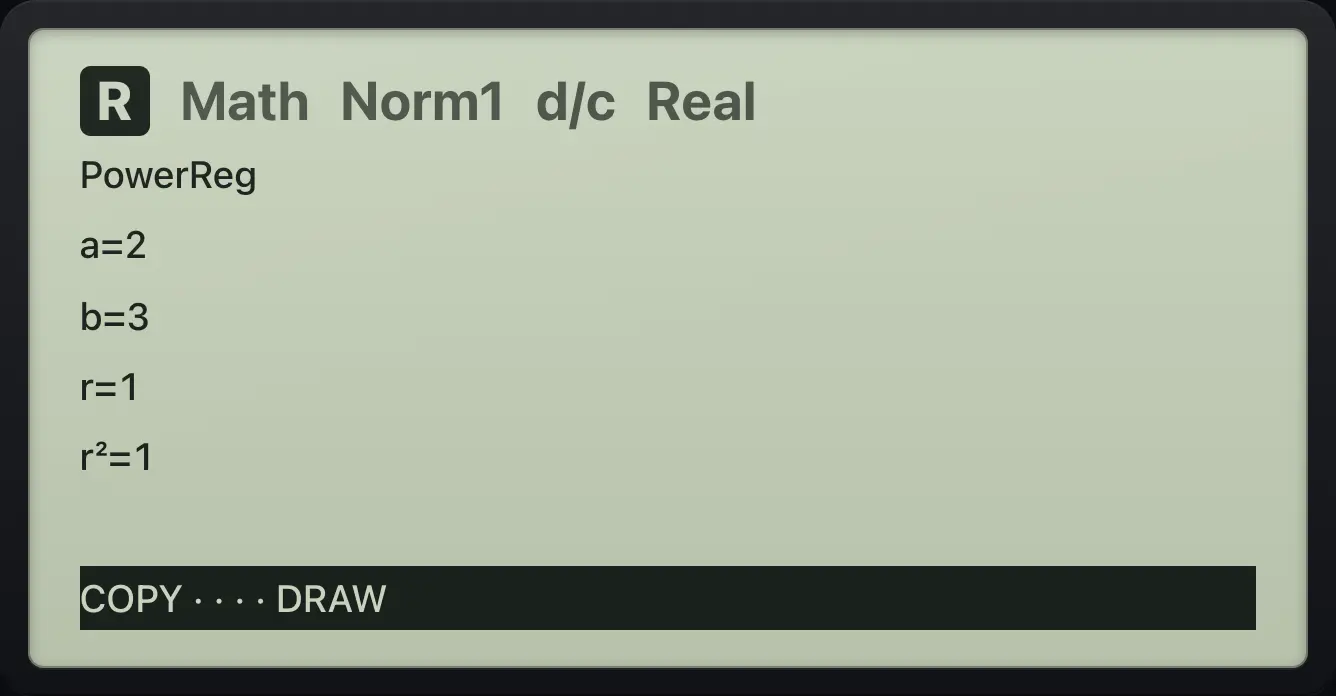
a=2 b=312.5No data#
CALC with empty lists
Open Statistics and choose CALC, 1-VAR with nothing entered.
MENU2F2F1
![Result of the example "CALC with empty lists" The display shows: Dimension ERROR / Press:[EXIT].](/trident/app/help/manual/img/b0b4ad8as.webp)
Dimension ERRORfx-CG50 is a trademark of Casio Computer Co., Ltd.. Trident Calculator is an independent product by South View Studios and is not affiliated with, sponsored by or endorsed by Casio. The name is used only to describe the kind of calculator this model resembles; Trident's names, keys, display, fonts and software are its own clean-room design.