
Natural Color Graphing manual · Chapter 9 of 18
Graphing functions
Enter functions, draw them in color, set the window, zoom, trace, solve and sketch.
9.1Enter a function#
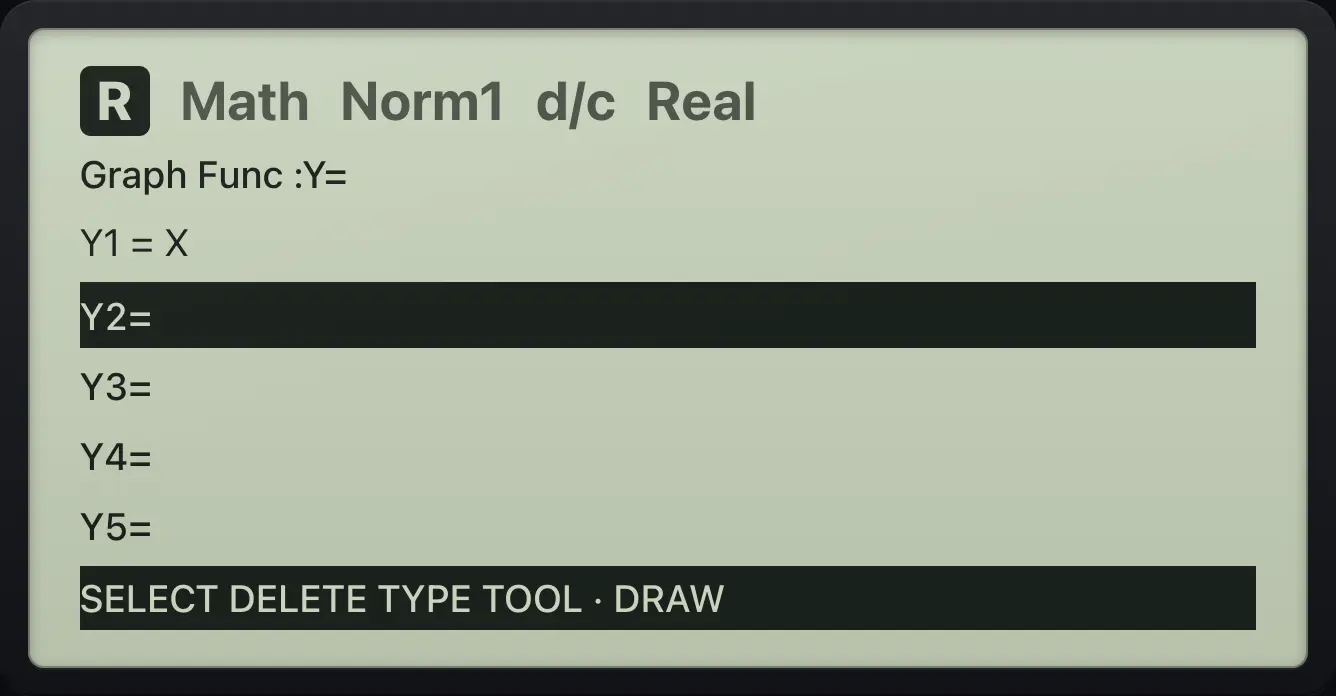
Press MENU then 3 to open the Graph app. The list holds Y1, Y2 and so on. Type a function using X,θ,T for X and press EXE: it is stored and the cursor moves to the next line.
- MENU 3
- Type f(x) EXE
- F6 DRAW
- F1 TRACE
Enter two functions
Open Graph and type X² − 4, then X + 2.
MENU3X,θ,Tx²−4EXEX,θ,T+2EXE
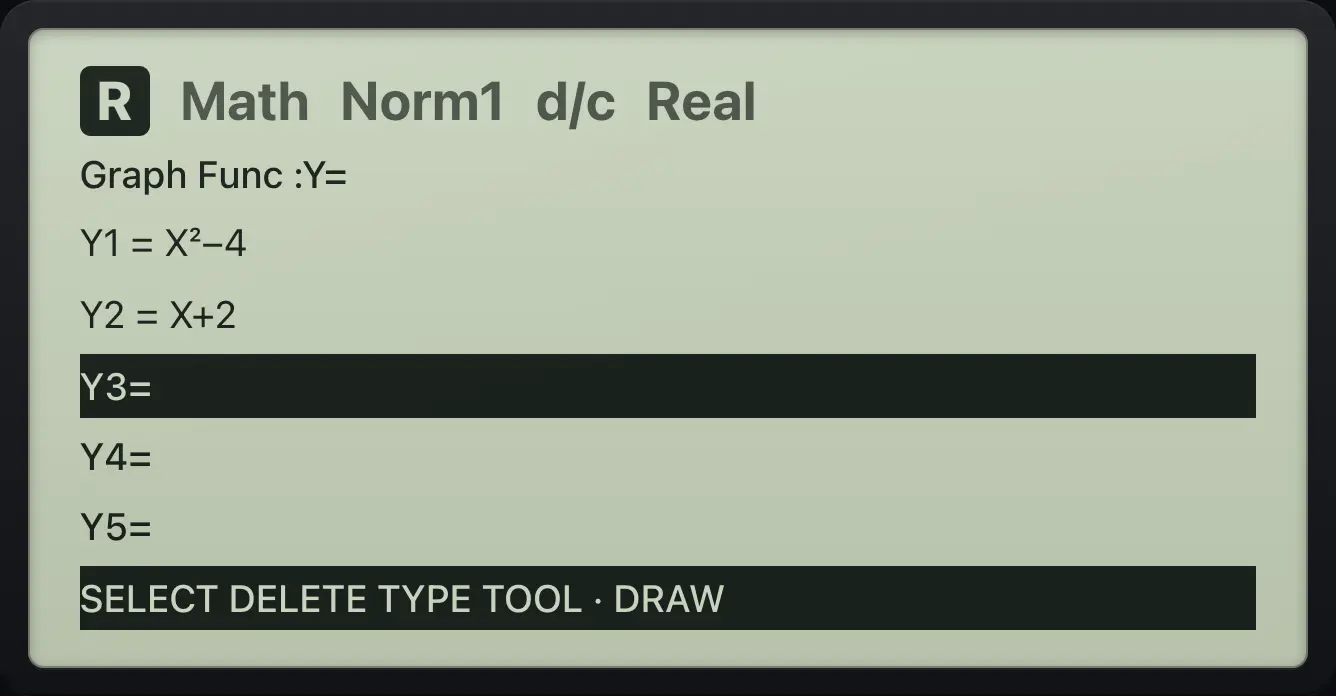
Y1=X²−4 Y2=X+2| F key | Label | What it does |
|---|---|---|
| F1 | SELECT | Turns the highlighted function on or off for drawing. |
| F2 | DELETE | Clears the highlighted function. |
| F3 | TYPE | Chooses Y=, r=, Parm or X= for the line. |
| F4 | TOOL | Chooses the color. |
| F6 | DRAW | Draws the graph. |
9.2Edit, delete, select and color#
Edit a function
Enter X², go up and right, add 1.
MENU3X,θ,Tx²EXE▲▶+1EXE
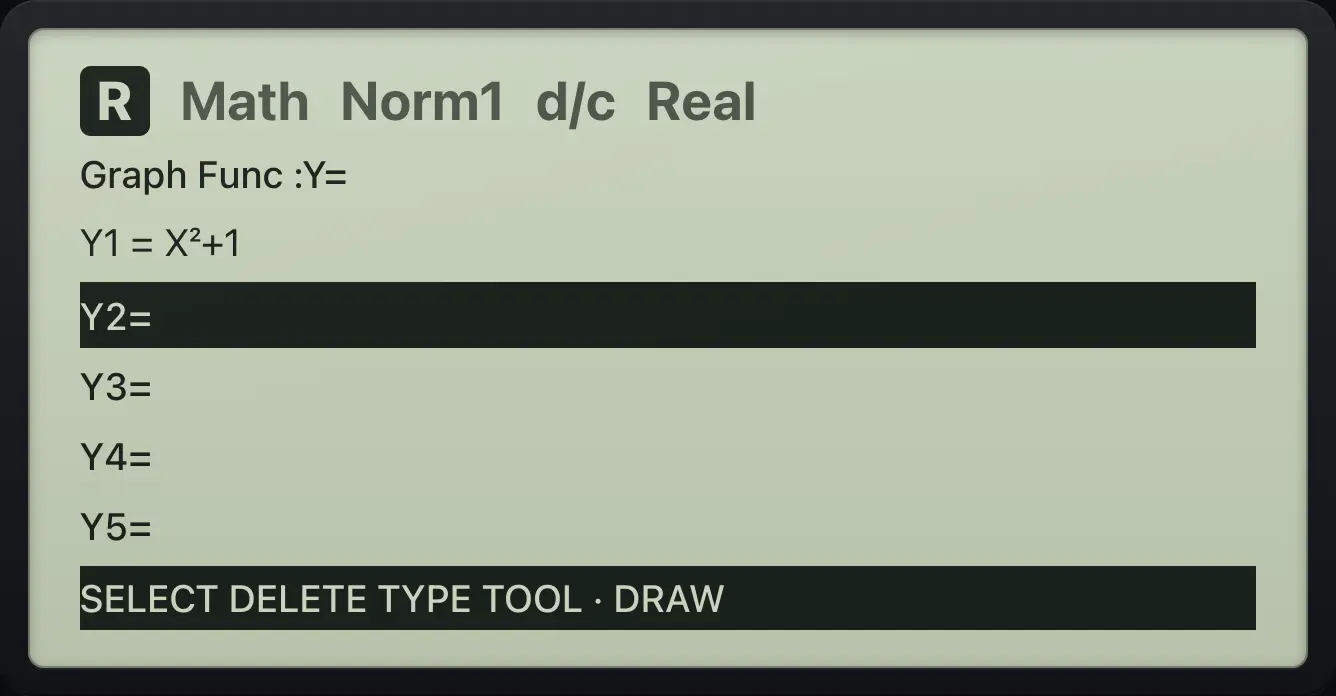
Y1=X²+1Delete a function
Enter X², go up, press DELETE.
MENU3X,θ,Tx²EXE▲F2
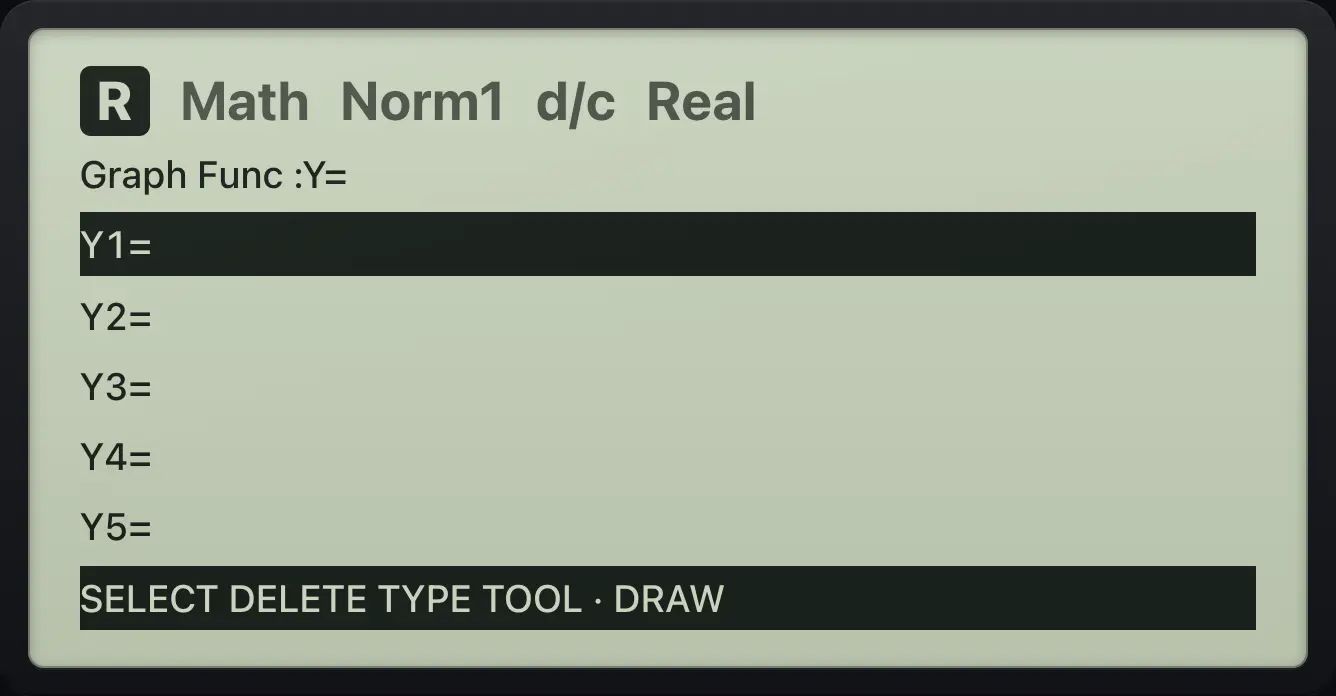
Y1=Turn a function off
Enter X², go up and press SELECT, then DRAW: nothing is drawn.
MENU3X,θ,Tx²EXE▲F1F6
TRACEDefault colors are blue, red and green for Y1, Y2 and Y3. Press F4 (TOOL) and choose Blue, Red, Green, Magnt (magenta) or Black.
Choose a color
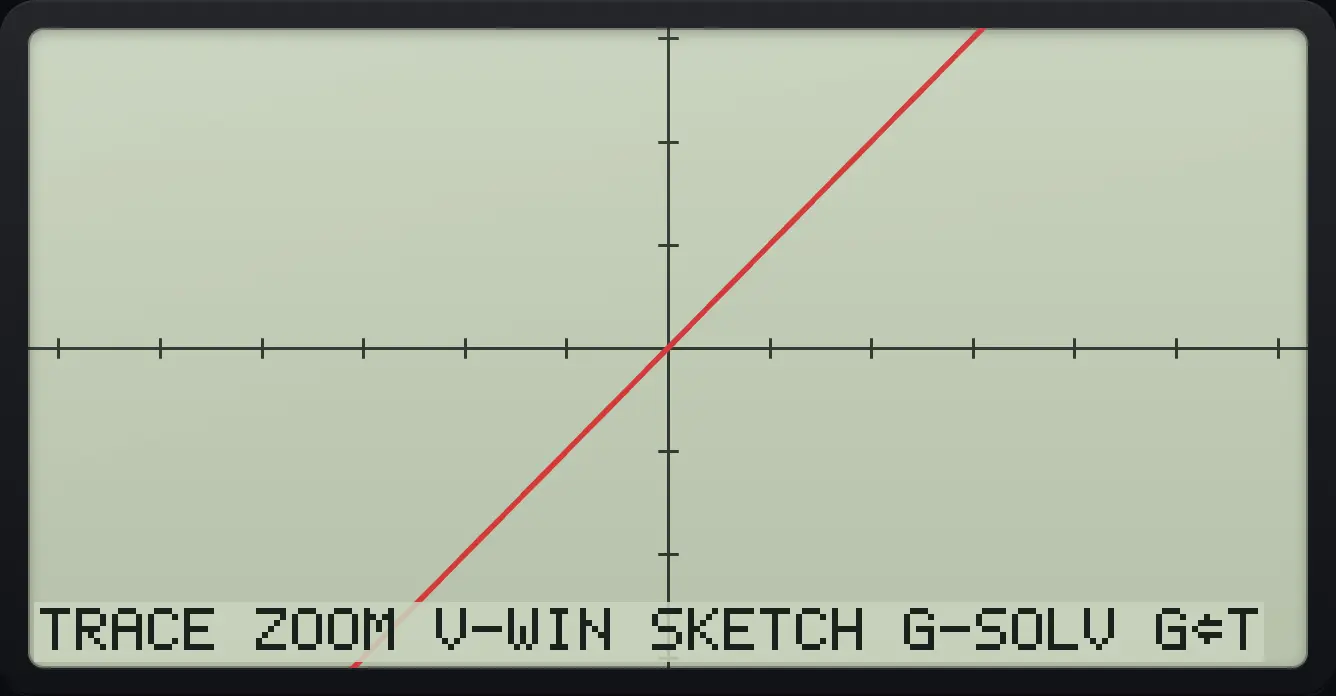
Enter X, go up, TOOL, F2 (Red), then DRAW.
MENU3X,θ,TEXE▲F4F2F6
TRACE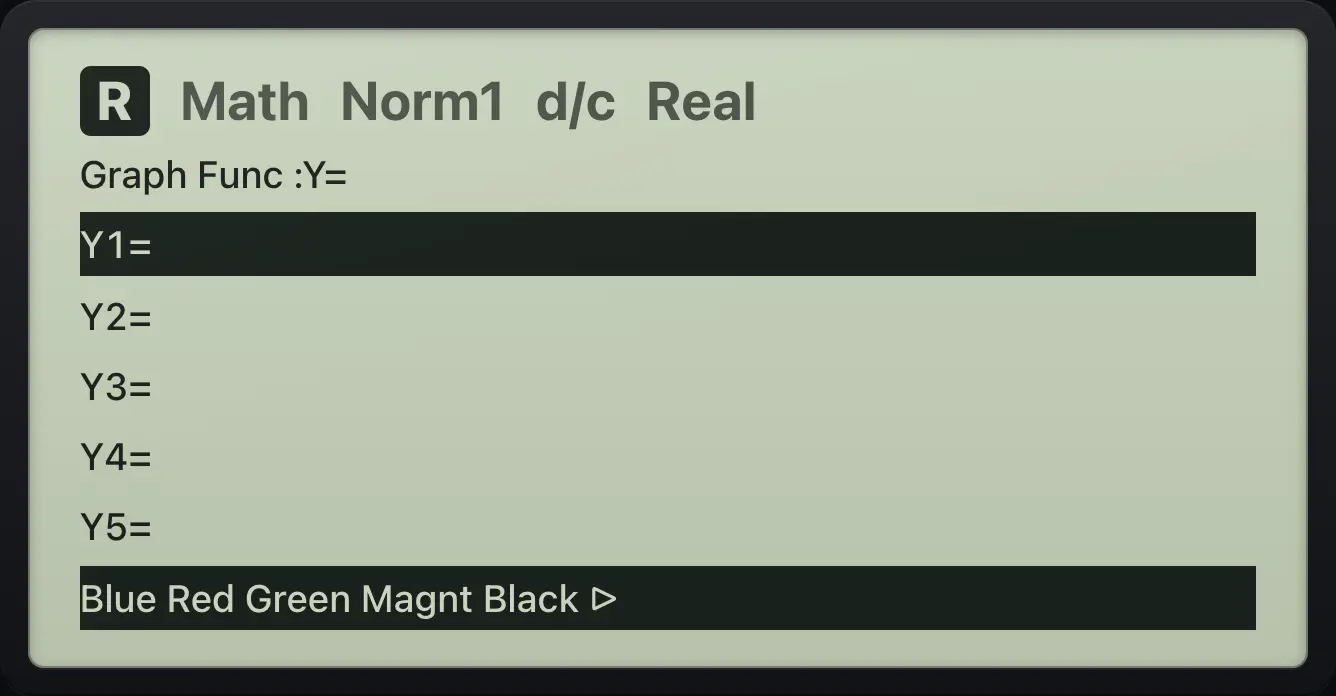
9.3Draw a graph#
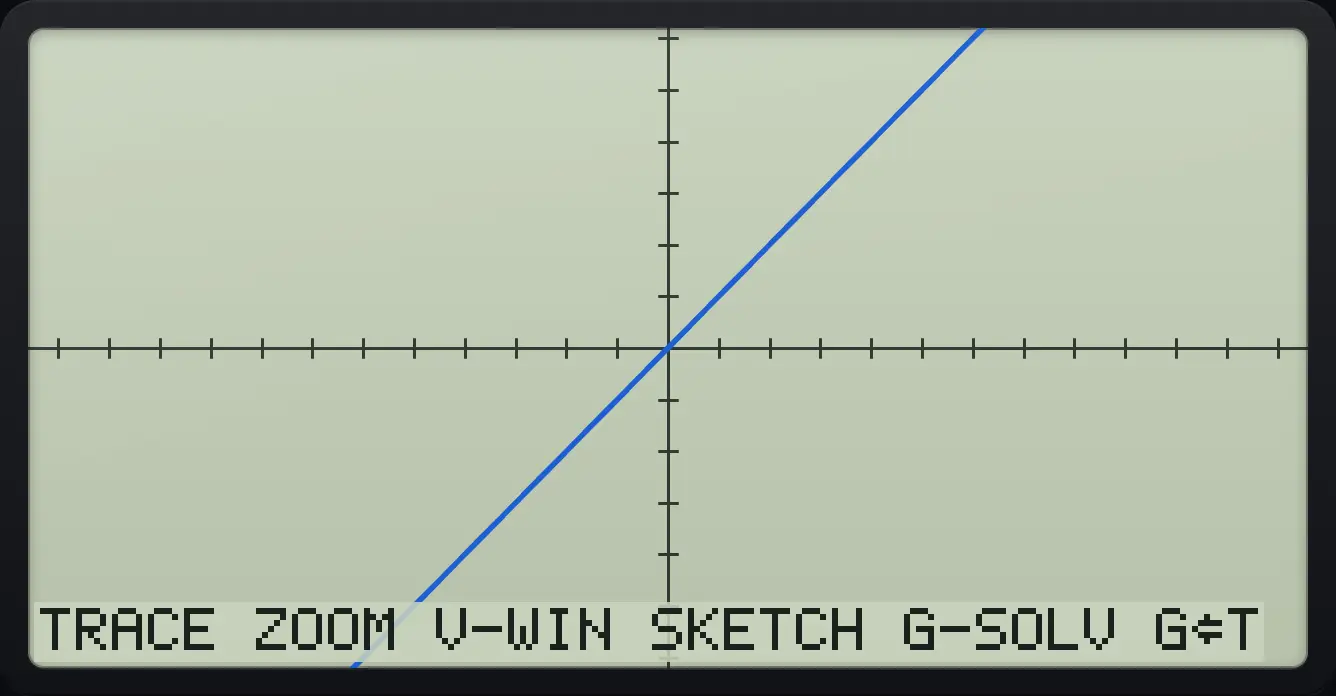
Press F6 (DRAW). The graph appears with the bar TRACE, ZOOM, V-WIN, SKETCH, G-SOLV, G⇔T. The default window shows X from -6.3 to 6.3 and Y from -3.1 to 3.1. The arrow keys scroll the window. EXIT or F6 (G⇔T) returns to the function list.
Draw a parabola
Enter X² − 4 and press DRAW.
MENU3X,θ,Tx²−4EXEF6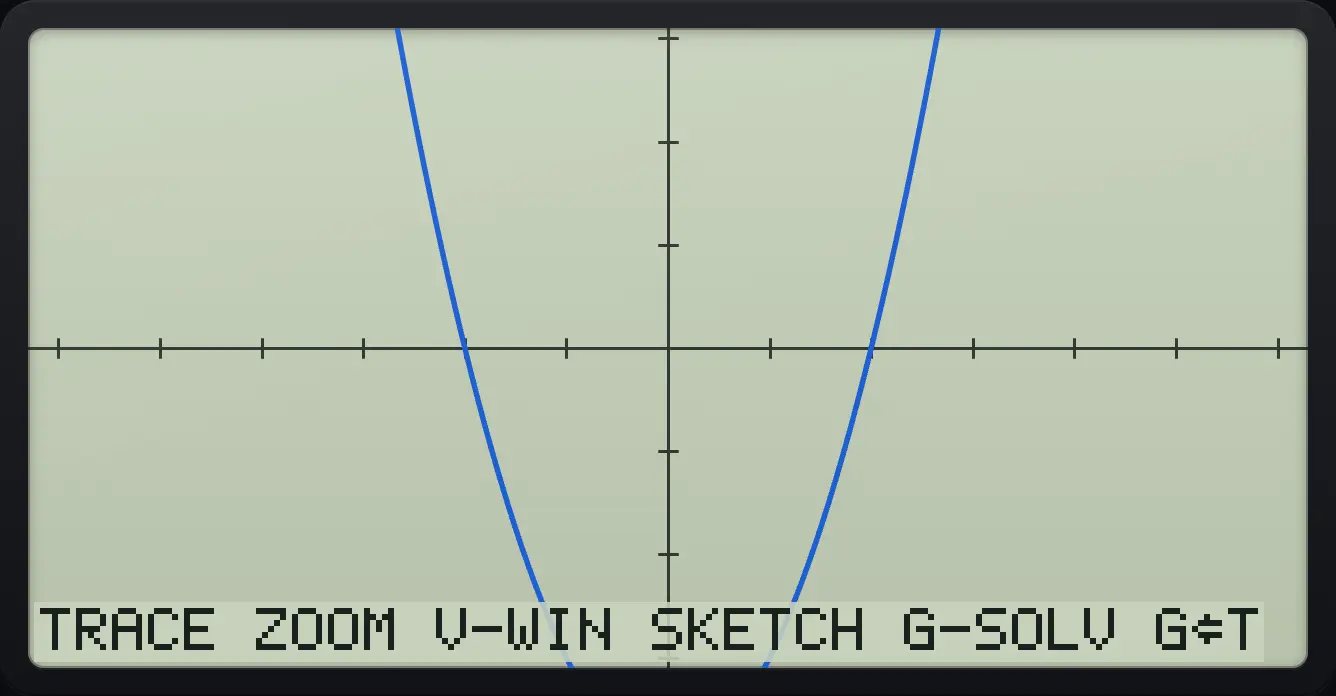
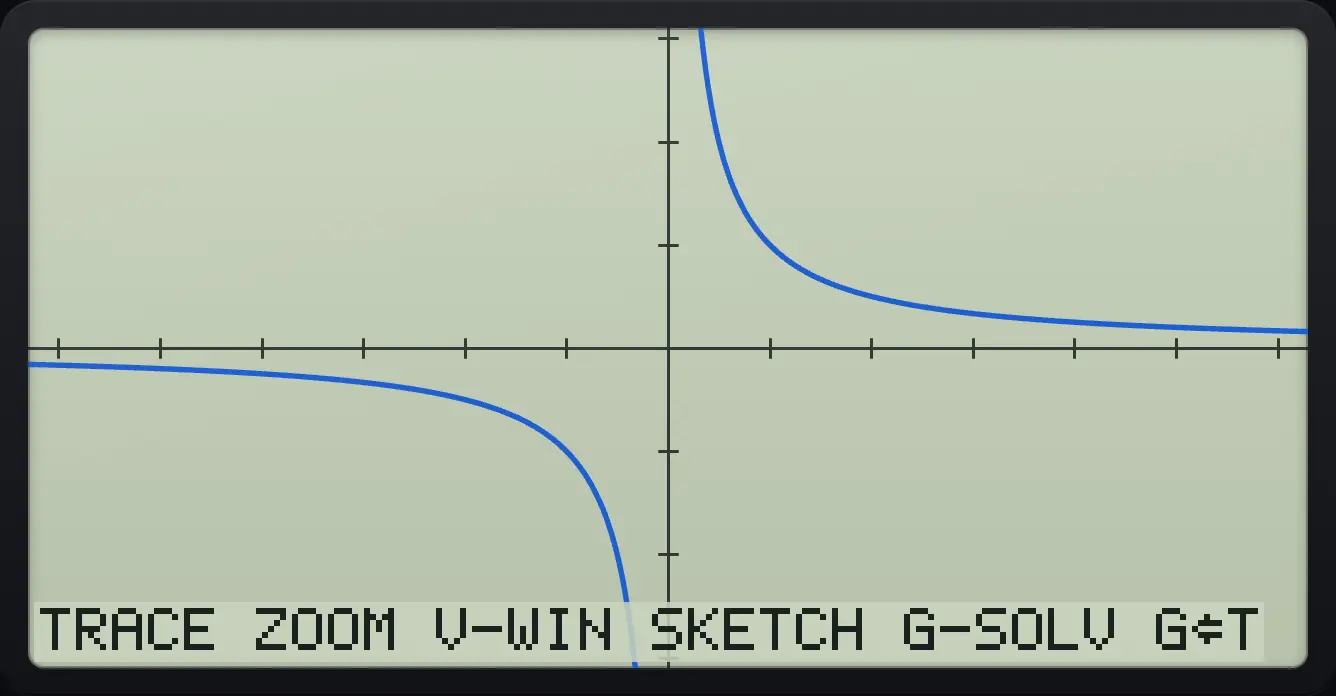
TRACE ZOOM V-WIN SKETCH G-SOLVDraw a hyperbola
Enter 1/X and draw.
MENU31/X,θ,TEXEF6
TRACEBack to the list
Draw, then EXIT.
MENU3X,θ,TEXEF6EXIT
Graph Func9.4Set the View Window#
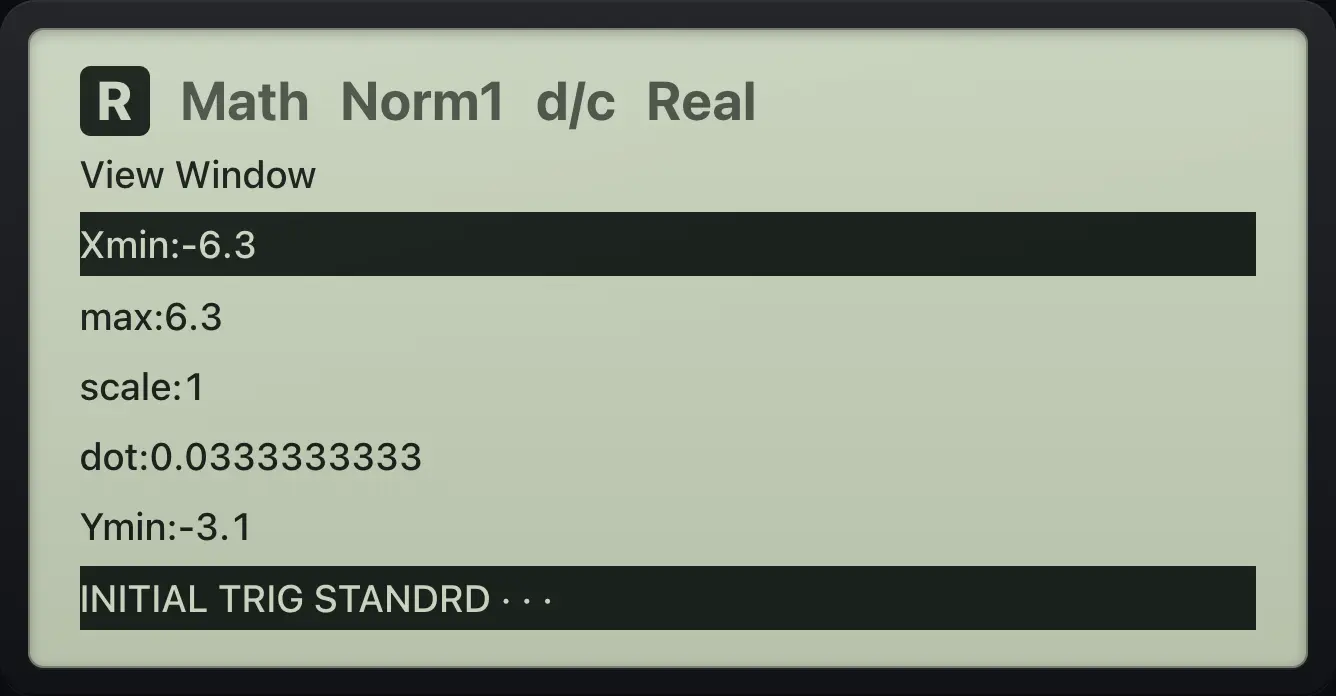
Press SHIFTV-WINF3 (V-WIN) for the View Window: Xmin, Xmax, scale, dot, Ymin and so on. Type a value and press EXE to go to the next line. The bar gives three presets.
| F key | Preset | Window |
|---|---|---|
| F1 | INITIAL | X from -6.3 to 6.3, Y from -3.1 to 3.1. |
| F2 | TRIG | X from -3π to 3π (or -540 to 540 in degrees), Y from -1.6 to 1.6. |
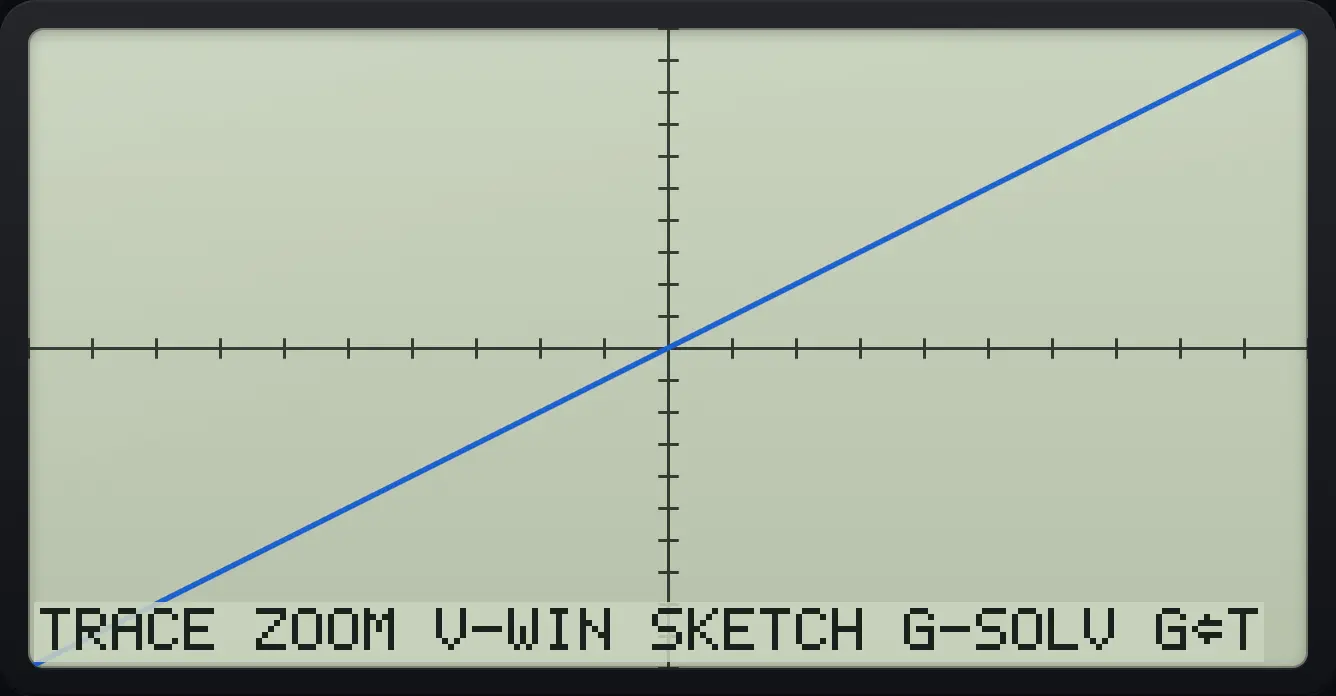
| F3 | STANDRD | X and Y from -10 to 10. |
Standard window
Enter X, open V-WIN, choose STANDRD, EXIT and draw.
MENU3X,θ,TEXESHIFTV-WINF3F3EXITF6
TRACEType your own window
V-WIN, Xmin -5, Xmax 5, EXIT.
MENU3X,θ,TEXESHIFTV-WINF3(−)5EXE5EXE
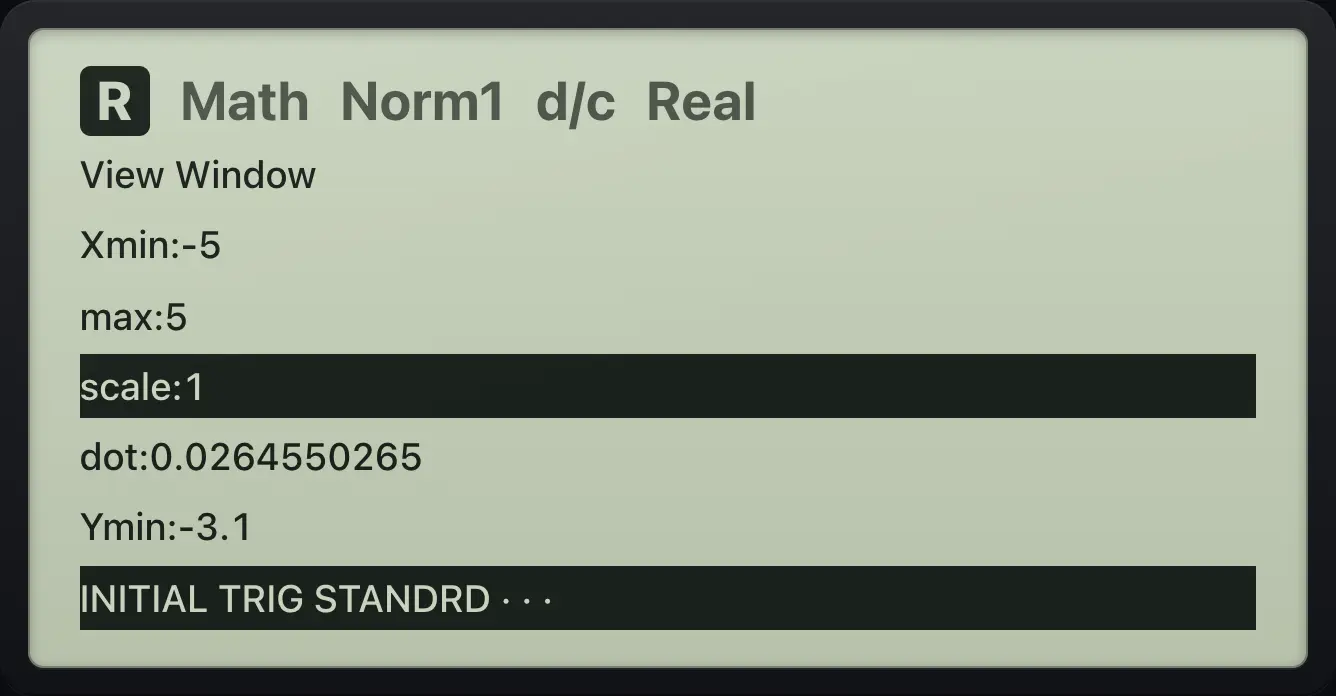
Xmin:-5An impossible window
Set Xmin to 9, which is above Xmax, then draw.
MENU3SHIFTV-WINF39EXEEXITF6
![Result of the example "An impossible window" The display shows: Range ERROR / Press:[EXIT].](/trident/app/help/manual/img/df70b1e4s.webp)
Range ERROR9.5Zoom in and out#
From the graph screen press F2 (ZOOM). Page 1: BOX, FACT, IN, OUT, AUTO. Page 2 (F6): ORIG, SQR, INTG, PRE.
| Label | What it does |
|---|---|
| BOX | Drag a box with the arrows: EXE at one corner, then at the opposite corner. |
| FACT | Sets the zoom factors for IN and OUT. |
| IN, OUT | Zoom around the centre (move the pointer with the arrows to zoom elsewhere), then EXE. |
| AUTO | Fits the Y range to the curve. |
| ORIG | Back to the window before zooming. |
| SQR | Equal units on both axes. |
| INTG | One unit per screen dot. |
| PRE | Swap with the previous window. |
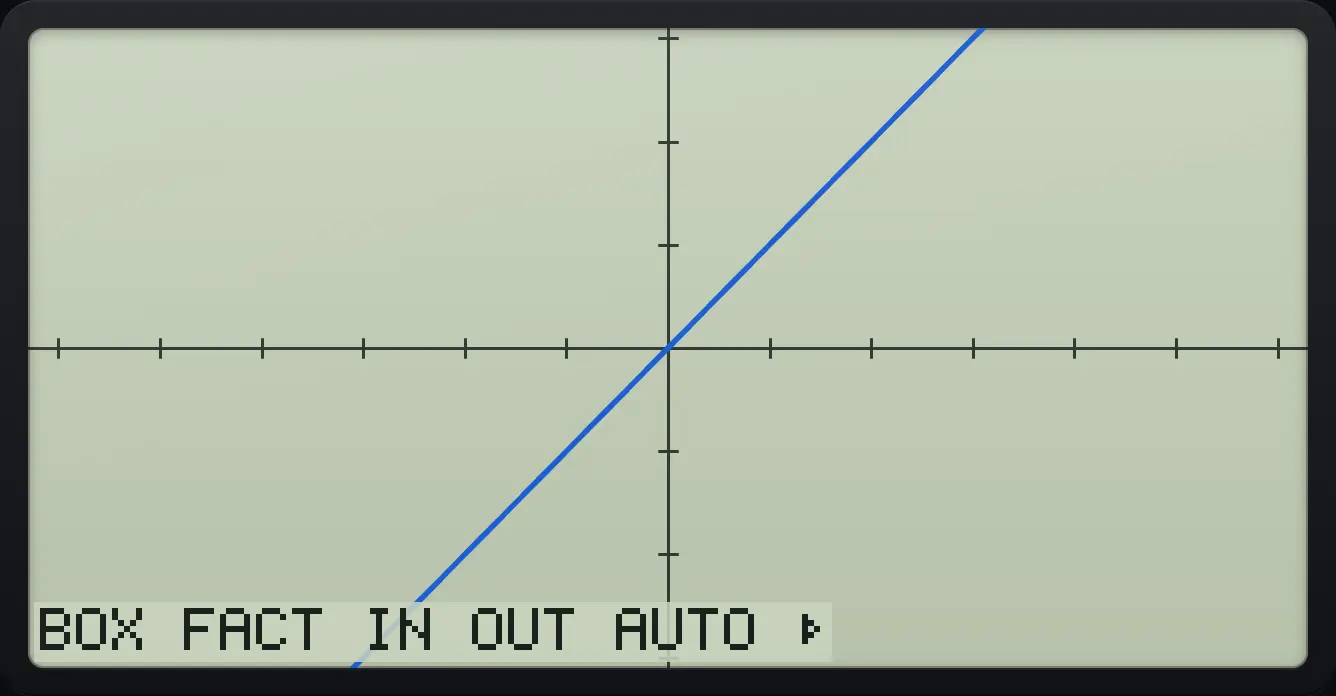
Zoom in
Draw X, ZOOM, IN, EXE.
MENU3X,θ,TEXEF6F2F3EXE
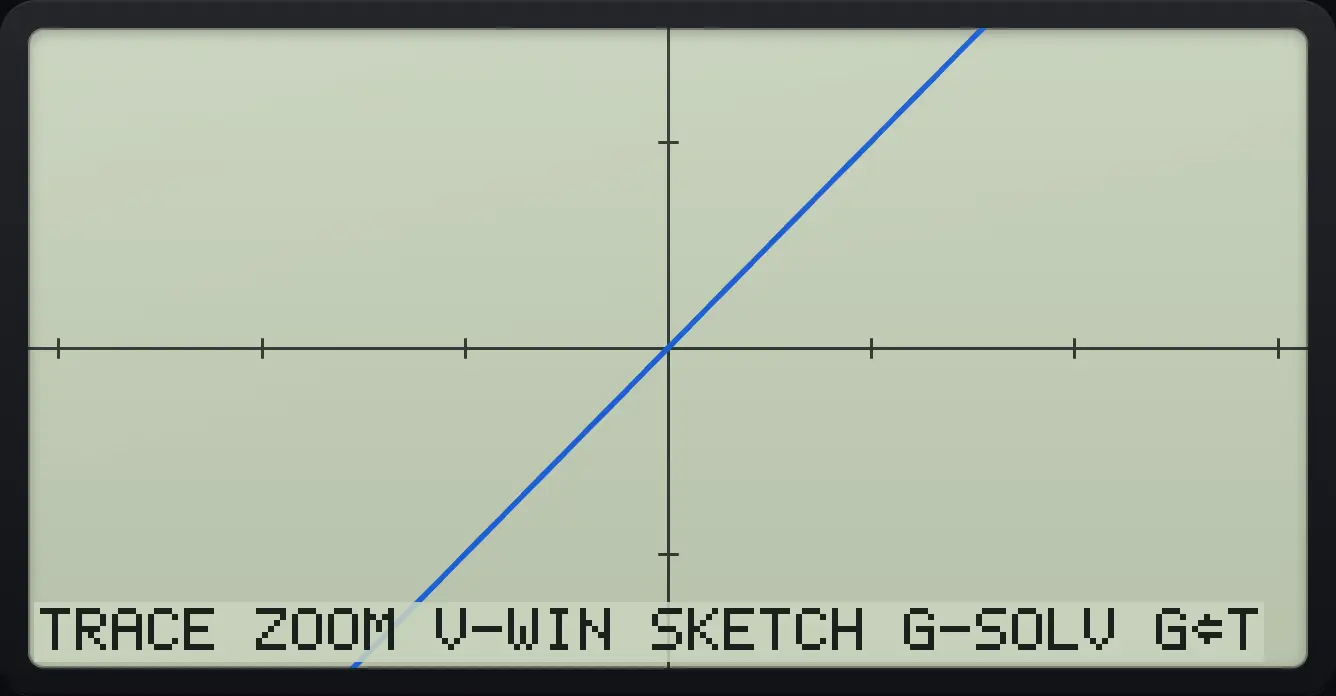
TRACEZoom out
Draw X, ZOOM, OUT, EXE.
MENU3X,θ,TEXEF6F2F4EXE
TRACEAuto zoom
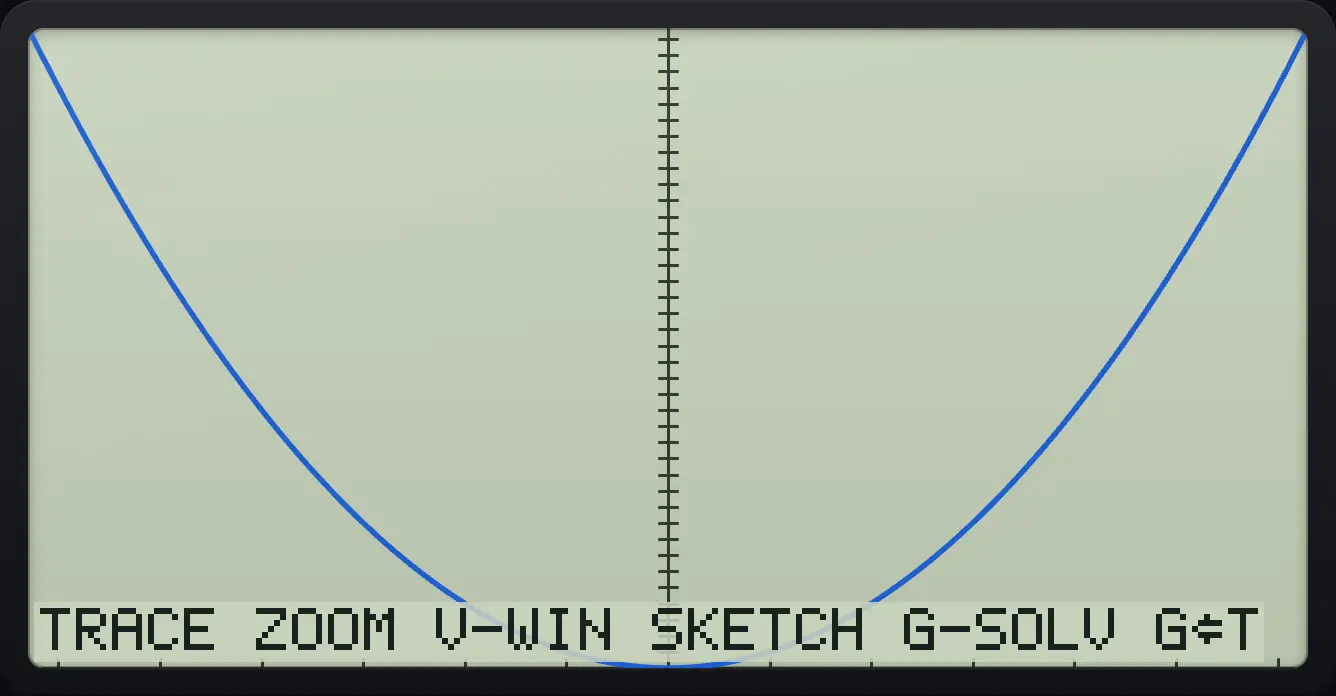
Draw X², ZOOM, AUTO.
MENU3X,θ,Tx²EXEF6F2F5
TRACE9.6Trace along a graph#
Press F1 (TRACE) or SHIFTTRACEF1. A cursor starts at the centre of the window. The top line names the function and the second line gives X and Y. ▶ and ◀ move one dot; type a number and press EXE to jump to that X; ▲ and ▼ switch between graphs. EXIT stops tracing.
Start tracing
Draw X² − 4 and press TRACE.
MENU3X,θ,Tx²−4EXEF6F1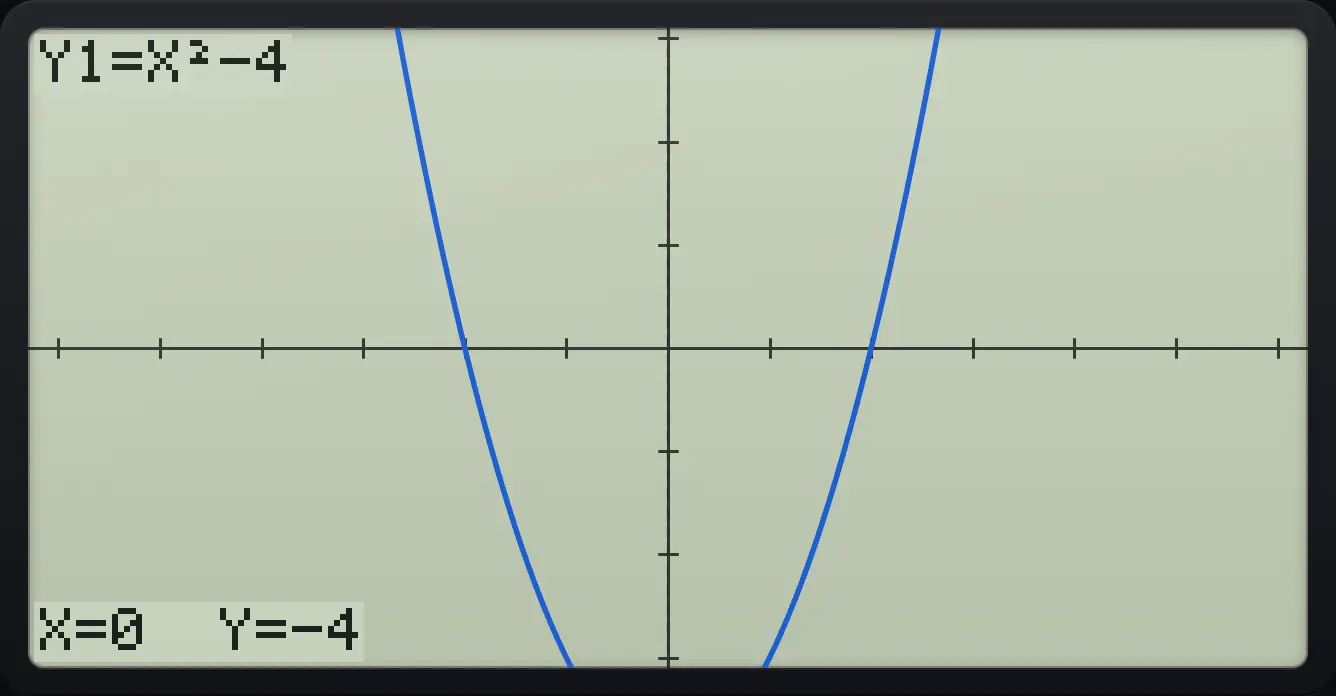
Y1=X²−4 X=0 Y=-4Jump to X = 3
Type 3 and EXE while tracing.
MENU3X,θ,Tx²−4EXEF6F13EXE
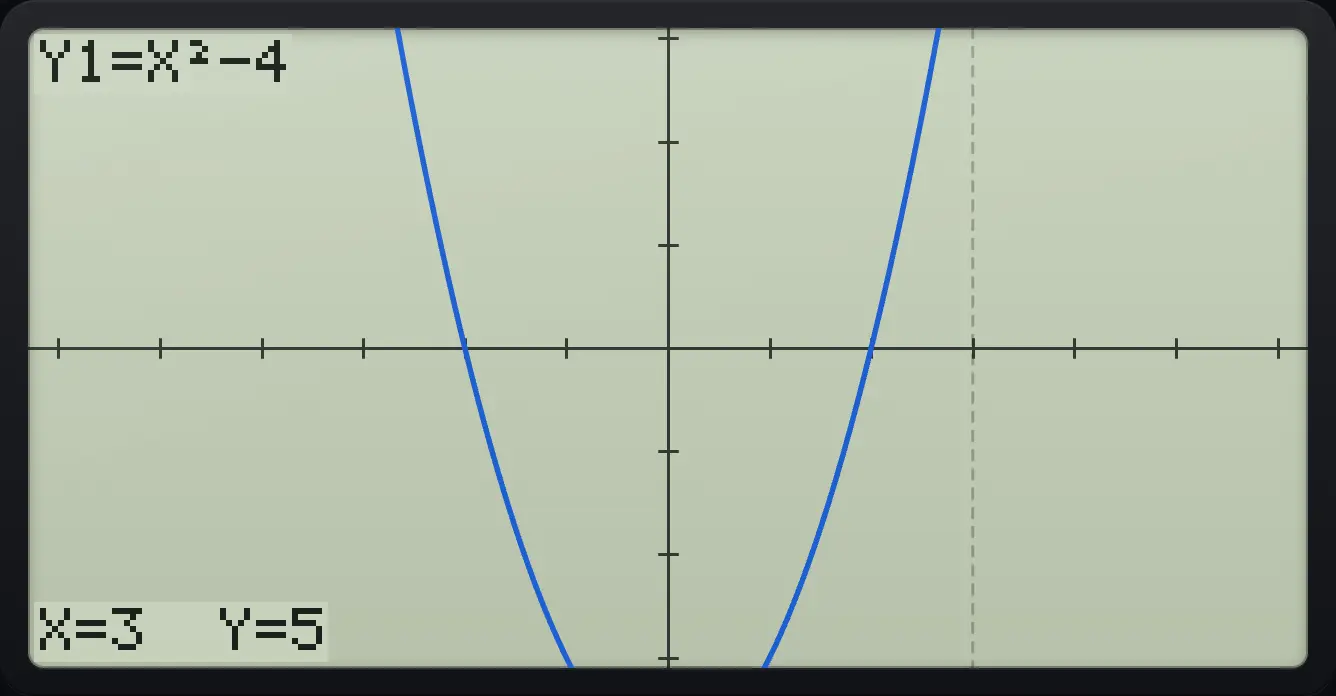
X=3 Y=5Step with the arrow keys
Press right.
MENU3X,θ,Tx²−4EXEF6F1▶
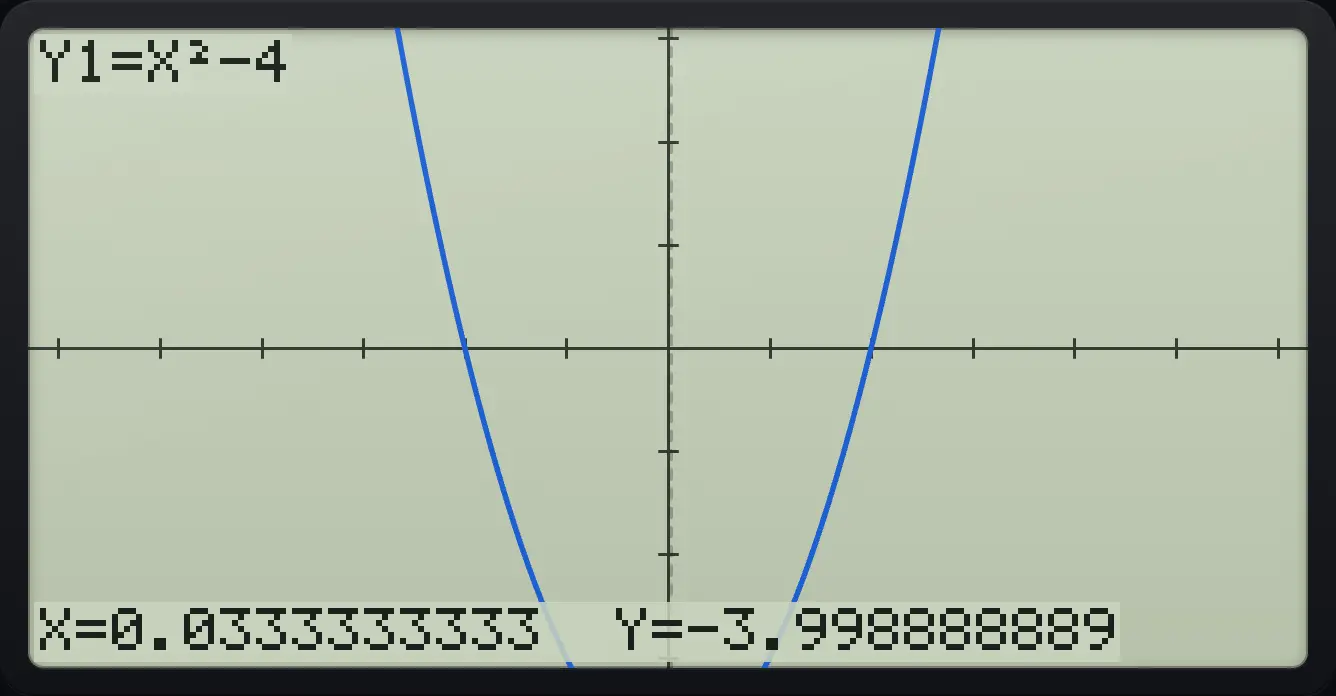
X=0.0333333333 Y=-3.998888889Switch between graphs
Two graphs; press down while tracing.
MENU3X,θ,Tx²EXEX,θ,T+2EXEF6F1▼
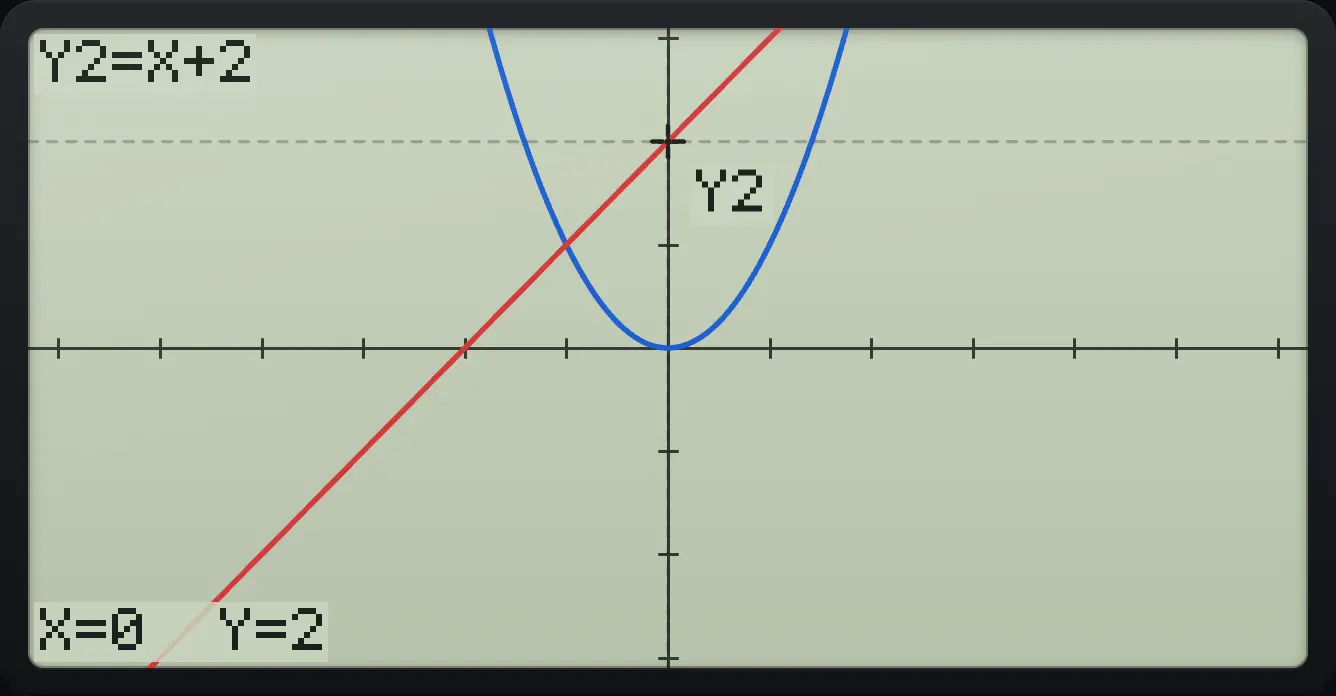
Y2=X+29.7Find roots, maximums and intersections (G-SOLV)#
From the graph screen press F5 (G-SOLV). Page 1: ROOT, MAX, MIN, Y-ICPT, ISECT. Page 2 (F6): Y-CAL, X-CAL, ∫dx. After a result, press ▶ or ◀ to see the next one.
| Label | Finds |
|---|---|
| ROOT | Where the graph crosses the X axis. |
| MAX, MIN | The highest or lowest point in the window. |
| Y-ICPT | Where the graph crosses the Y axis. |
| ISECT | Where two graphs cross. |
| Y-CAL | Y for an X you type. |
| X-CAL | Every X for a Y you type. |
| ∫dx | The area under the graph between two X values, shaded. |
Roots of x² − 4
Draw it and choose ROOT.
MENU3X,θ,Tx²−4EXEF6F5F1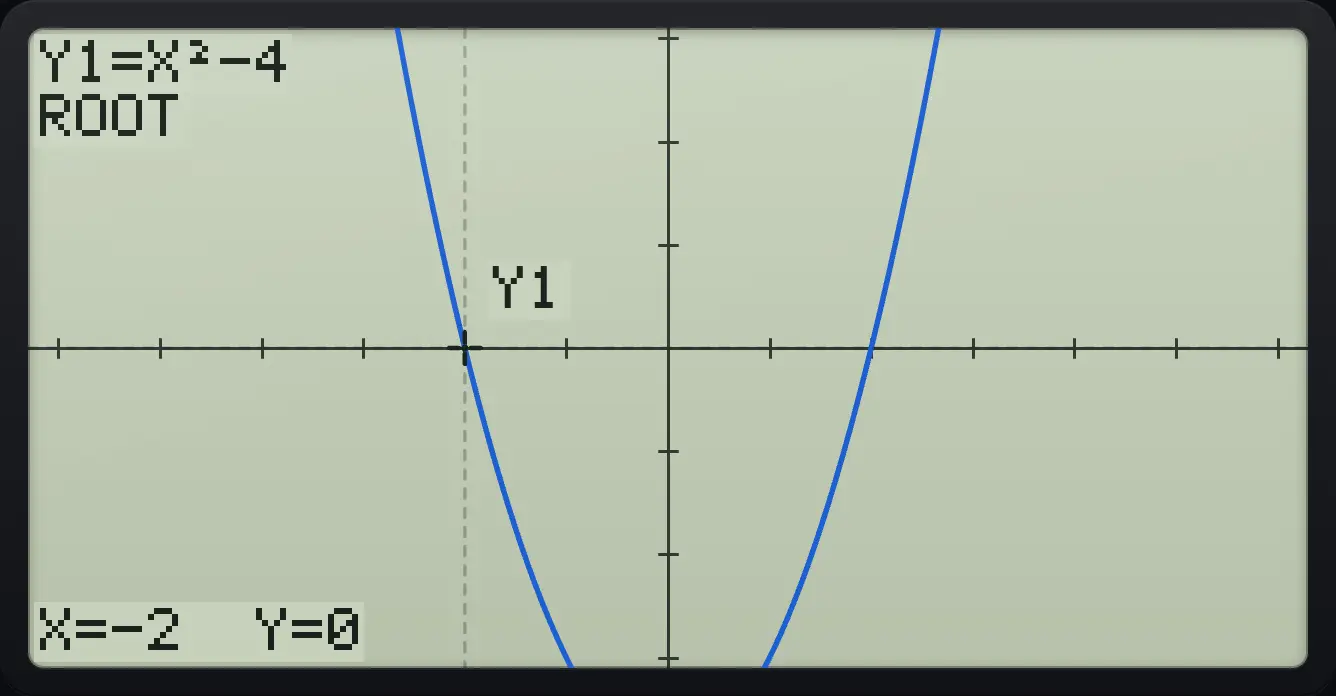
Press right for the next root.
▶
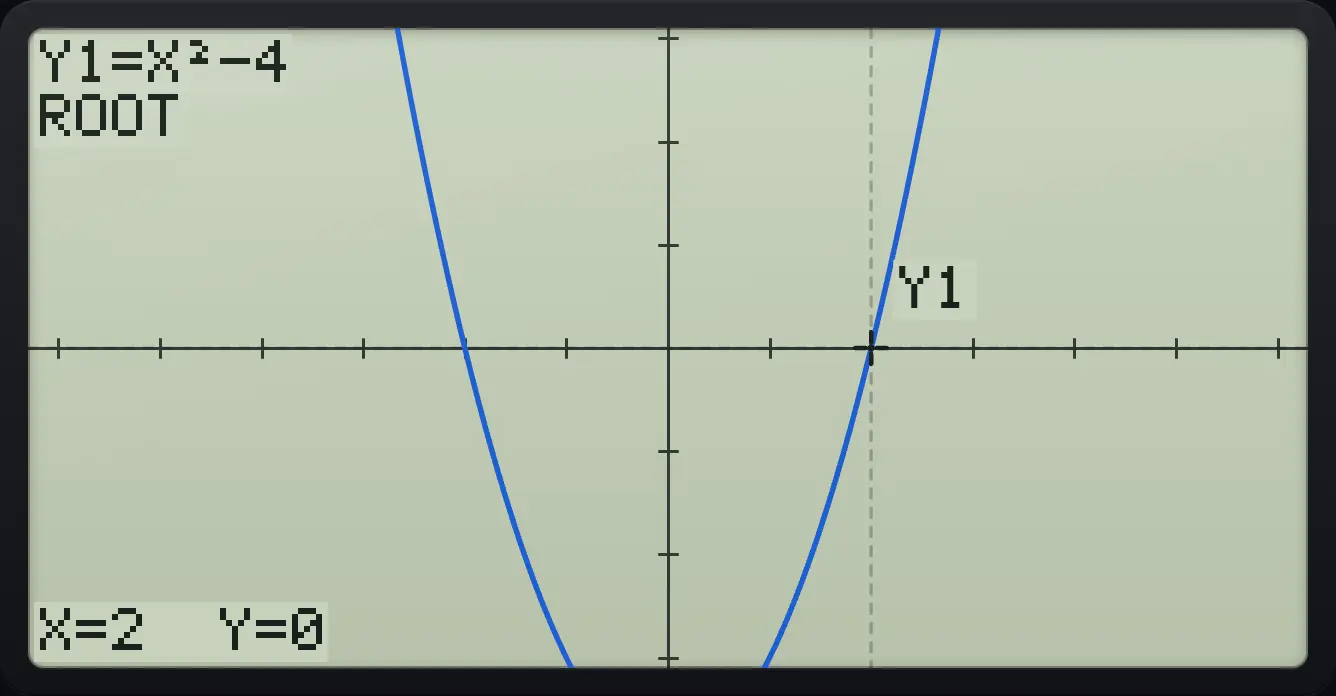
X=2 Y=0Minimum
MIN of X² − 4.
MENU3X,θ,Tx²−4EXEF6F5F3
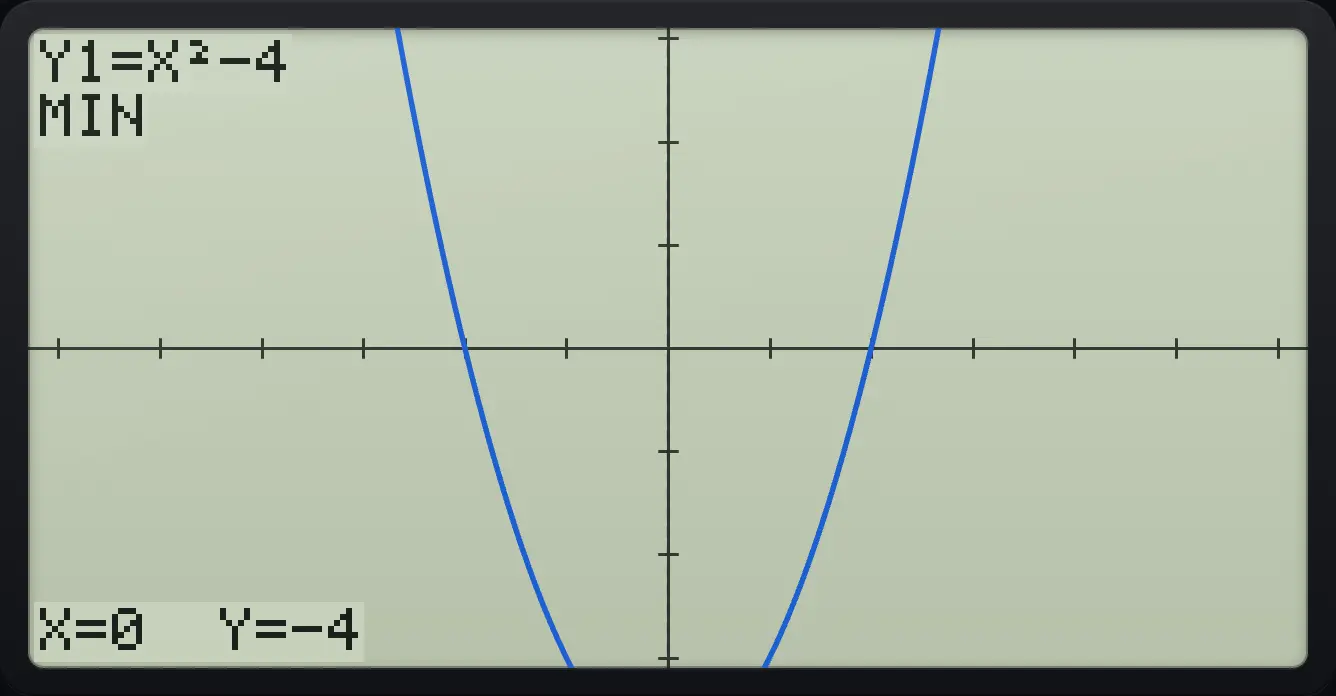
X=0 Y=-4Y-intercept
Y-ICPT of X² − 4.
MENU3X,θ,Tx²−4EXEF6F5F4
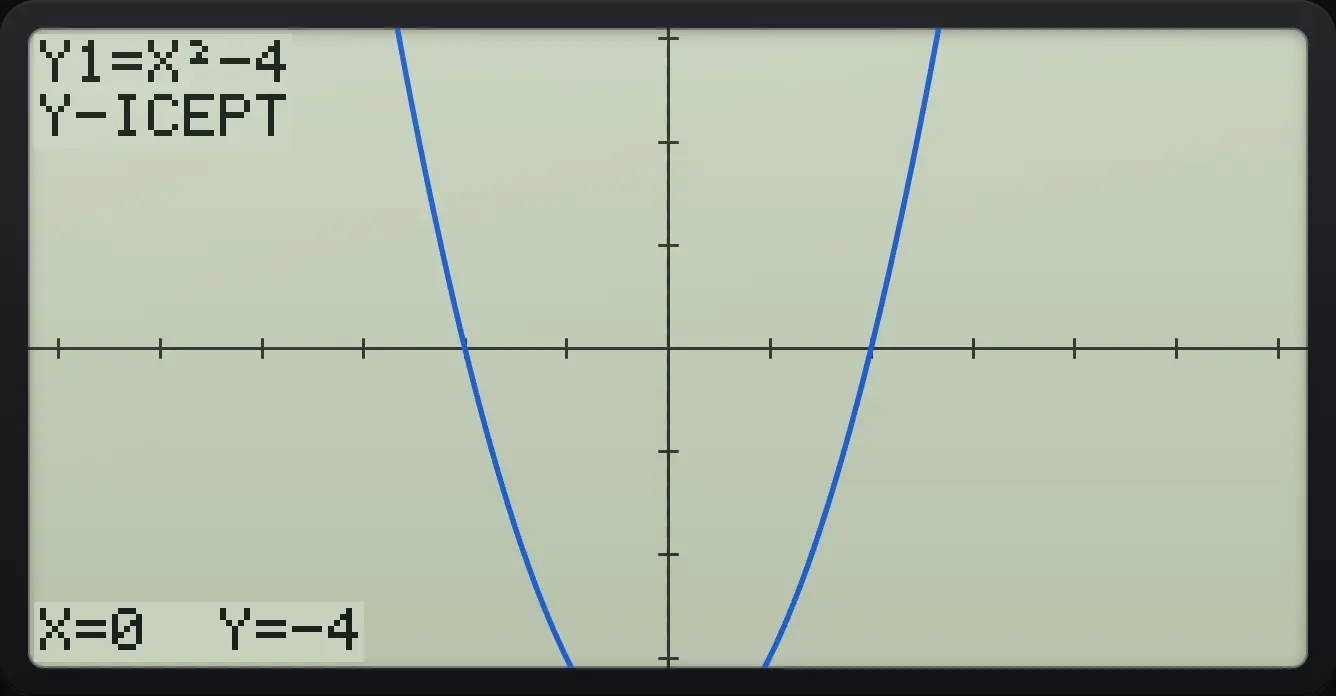
Y-ICEPT X=0 Y=-4Where two graphs cross
Draw X² and X + 2, choose ISECT.
MENU3X,θ,Tx²EXEX,θ,T+2EXEF6F5F5Right for the second crossing.
▶
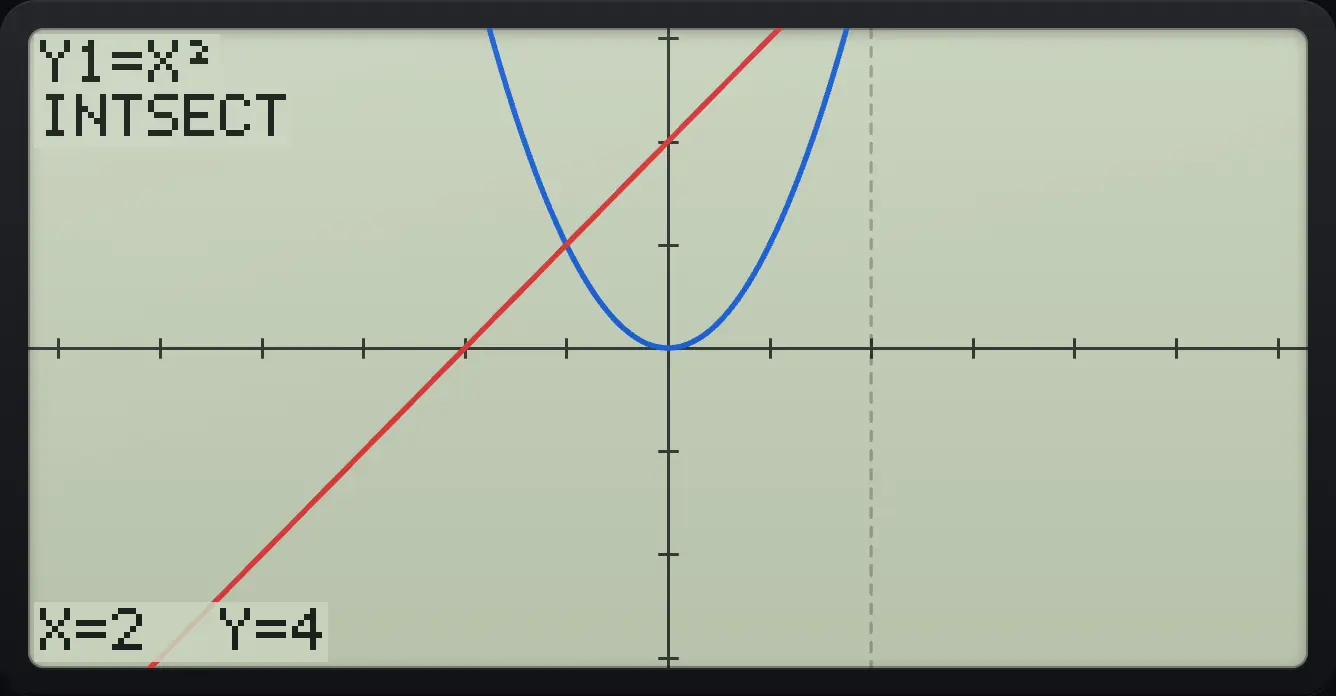
X=2 Y=4Y for a given X
Y-CAL with X = 3.
MENU3X,θ,Tx²−4EXEF6F5F6F13EXE
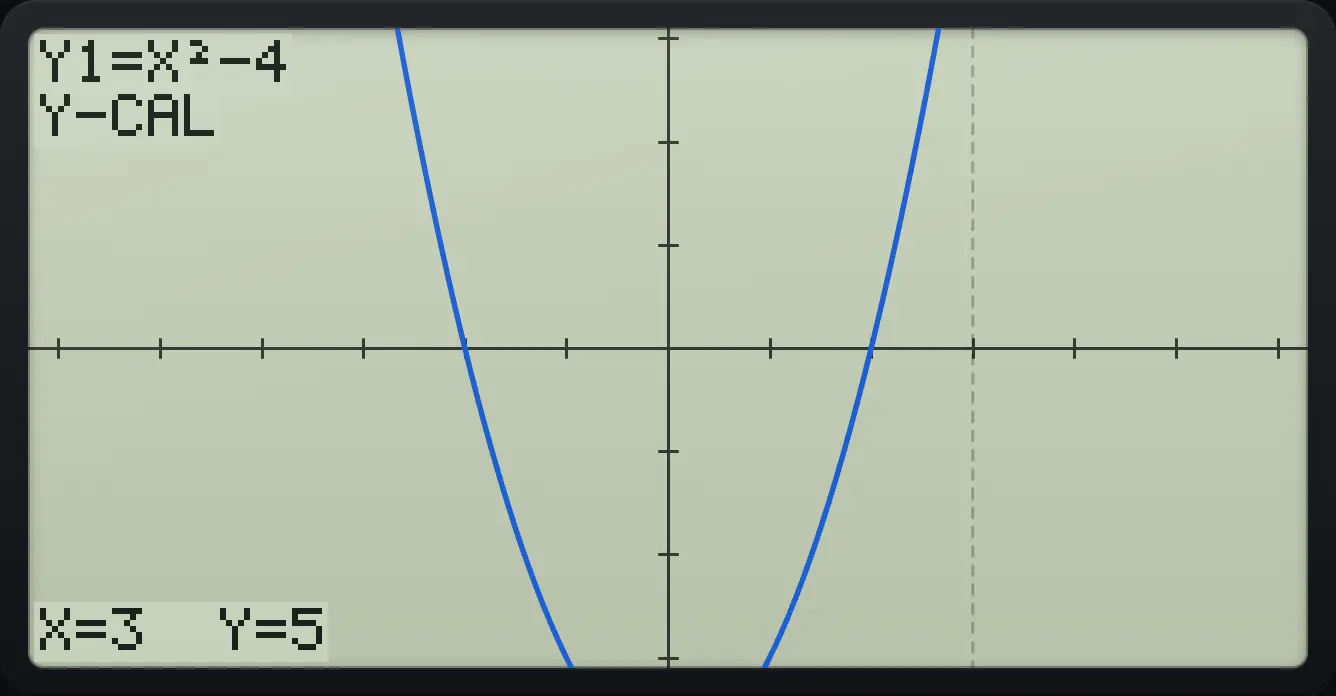
X=3 Y=5Area under a curve
∫dx from 0 to 1 for X².
MENU3X,θ,Tx²EXEF6F5F6F30EXE1EXE
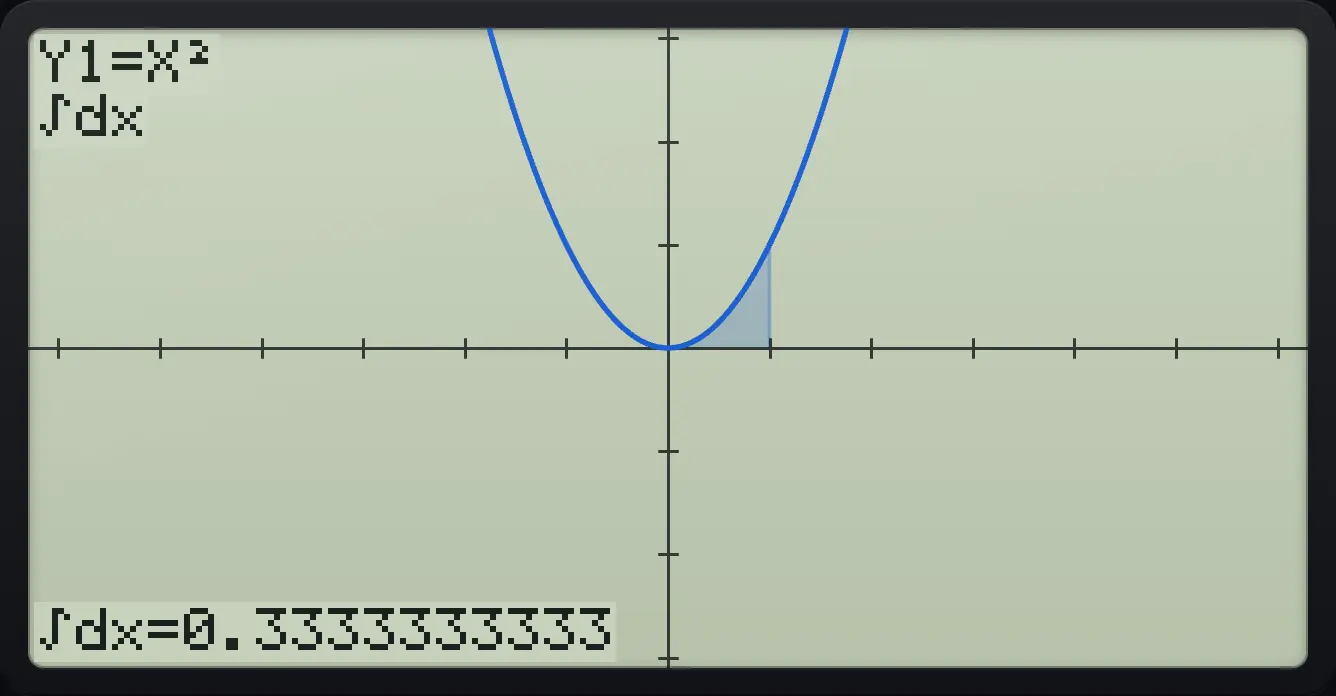
∫dx=0.3333333333No root exists
Draw X² + 1 and look for roots.
MENU3X,θ,Tx²+1EXEF6F5F1
![Result of the example "No root exists" The display shows: Not Found / Press:[EXIT].](/trident/app/help/manual/img/583df8cas.webp)
Not Found9.8Draw a tangent or normal line#
Press F4 (SKETCH): Cls clears sketches, Tang draws a tangent, Norm a normal. Type the X value and press EXE twice. The slope dy/dx is shown.
Tangent at x = 1
Draw X², SKETCH, Tang, 1, EXE, EXE.
MENU3X,θ,Tx²EXEF6F4F21EXEEXE
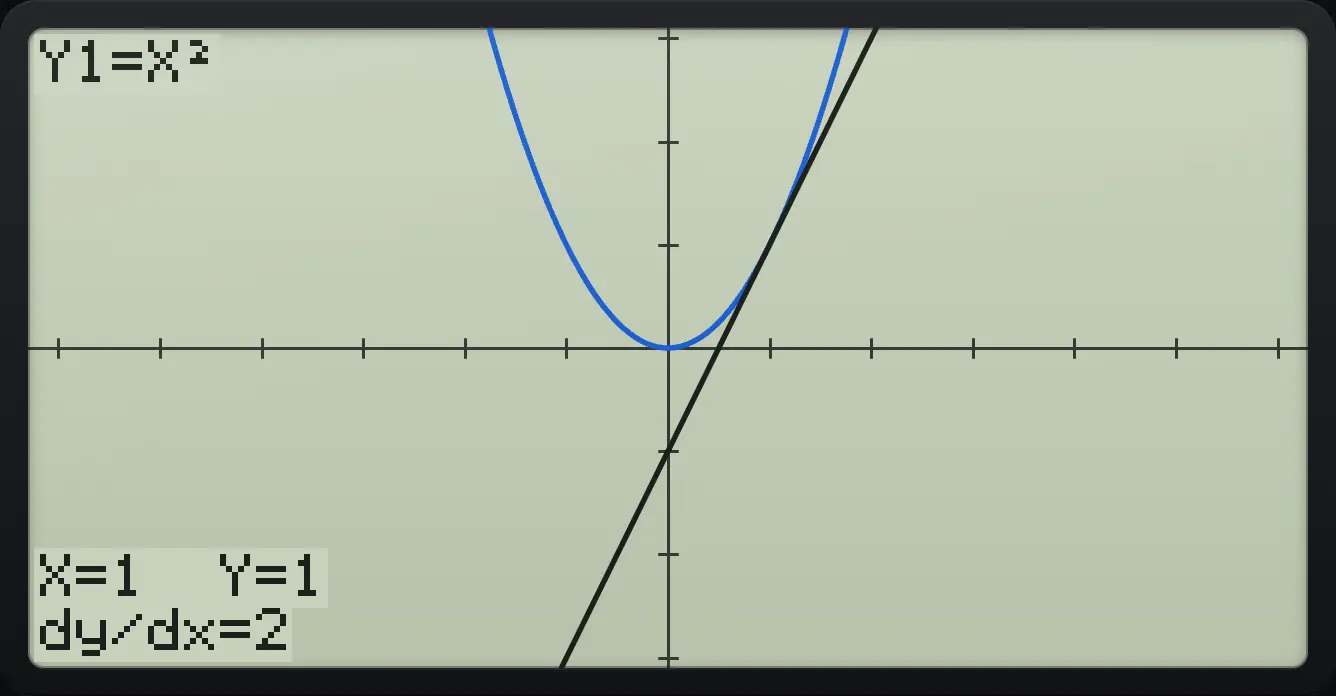
dy/dx=2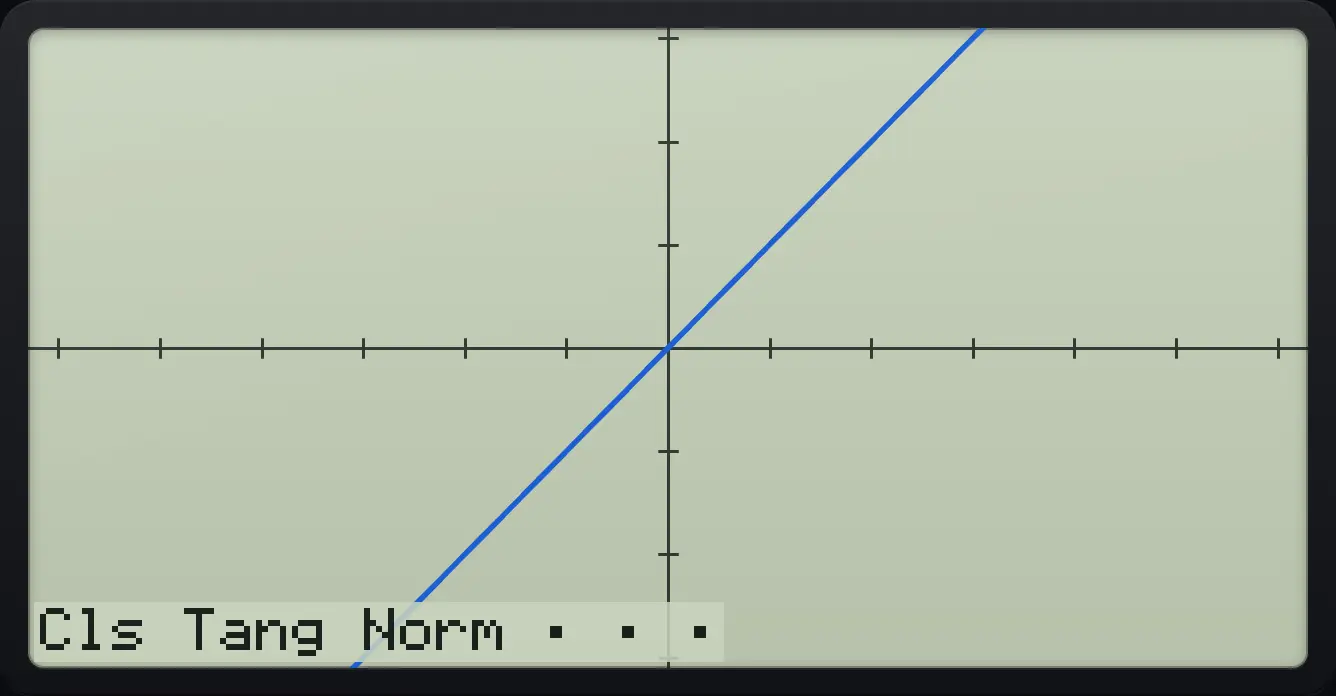
fx-CG50 is a trademark of Casio Computer Co., Ltd.. Trident Calculator is an independent product by South View Studios and is not affiliated with, sponsored by or endorsed by Casio. The name is used only to describe the kind of calculator this model resembles; Trident's names, keys, display, fonts and software are its own clean-room design.