
Natural Color Graphing manual · Chapter 11 of 18
Tables of values
Tabulate the functions you entered, over a range you choose.
11.1Make a table of values#
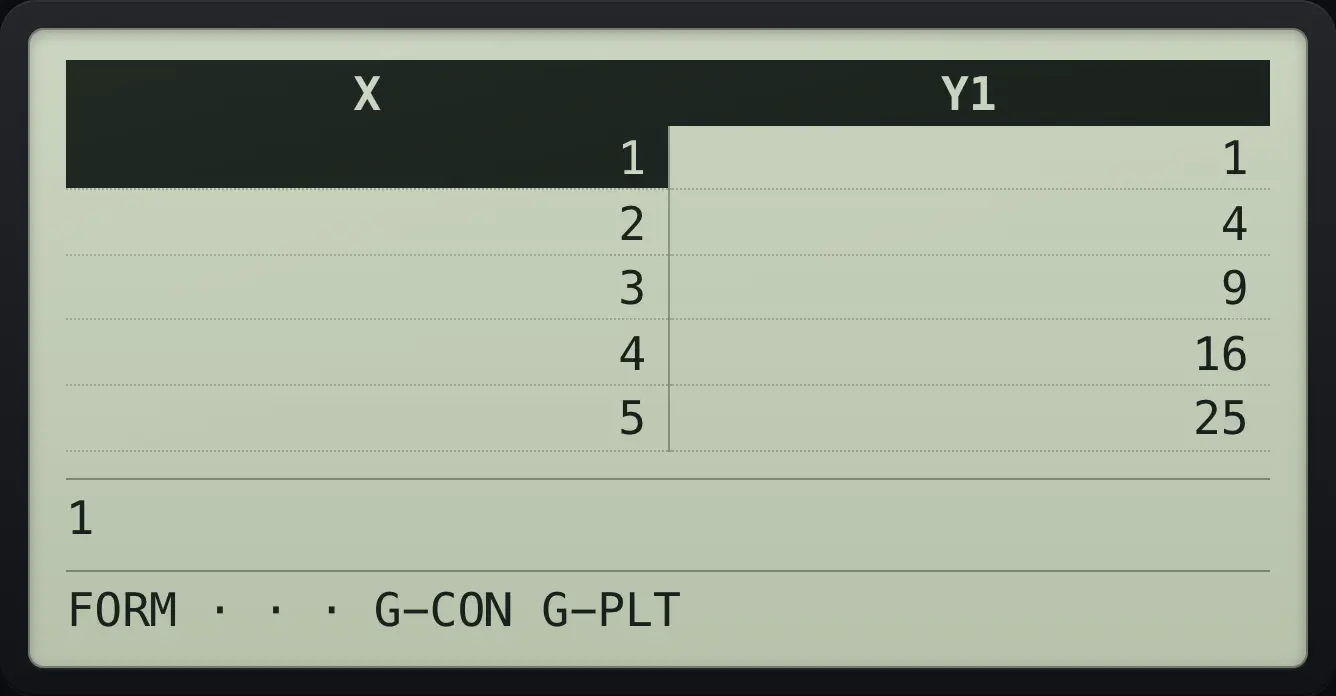
Press MENU then 4. The Table app uses the same function list as Graph. Type a function and press EXE, then press F6 (TABLE). The default range is Start 1, End 5, Step 1.
Squares from 1 to 5
Open Table, type X², EXE, TABLE.
MENU4X,θ,Tx²EXEF6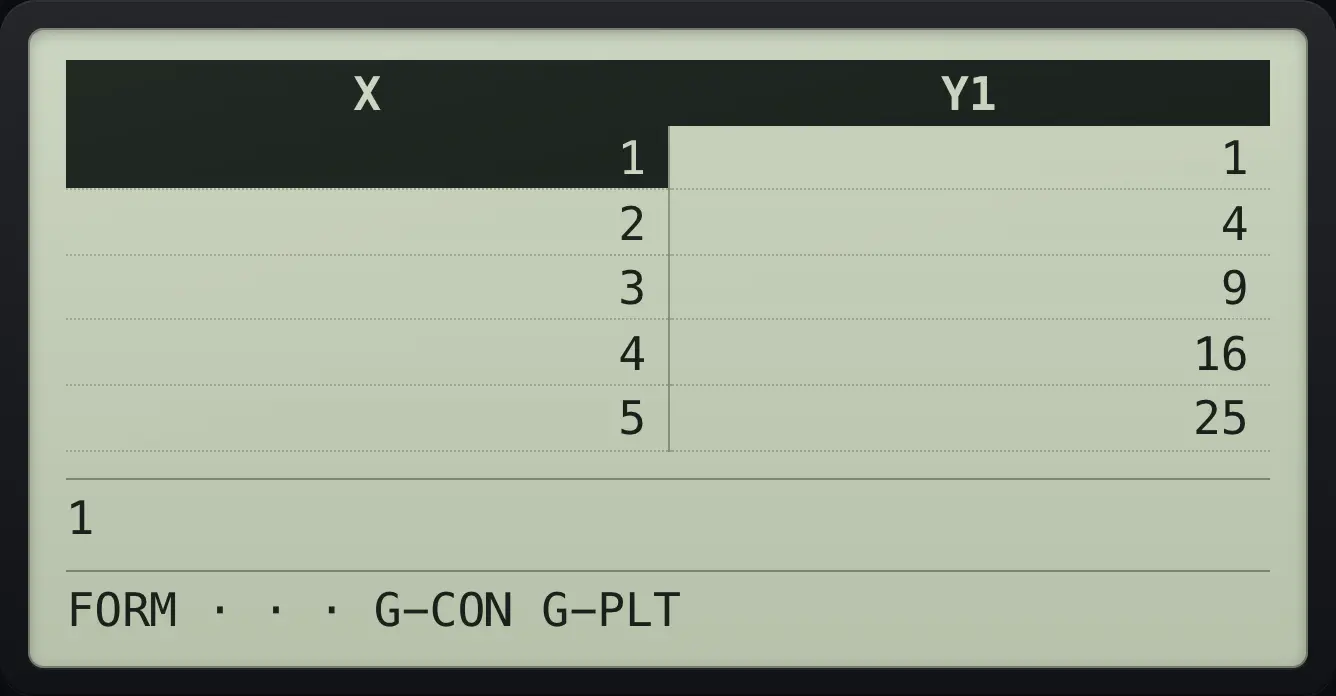
1 | 1 5 | 25Two functions side by side
Enter X² and 2X.
MENU4X,θ,Tx²EXE2X,θ,TEXEF6
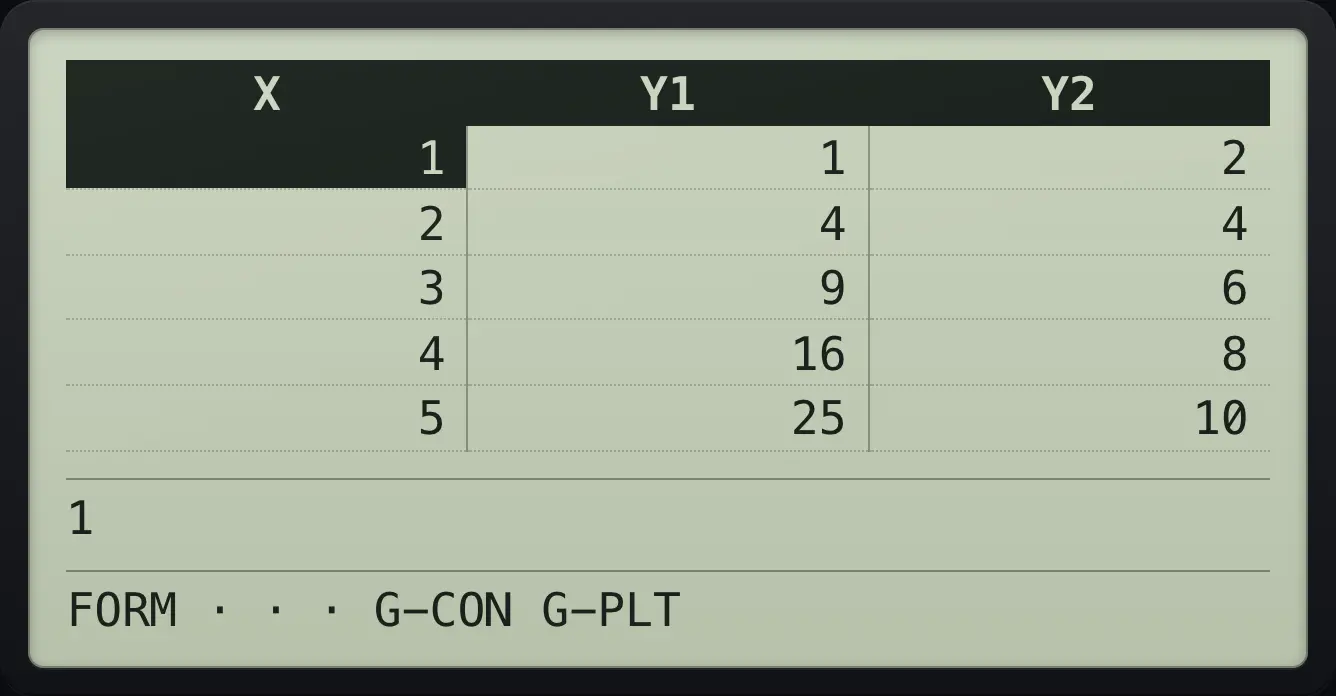
3 | 9 | 6| F key | Label | What it does |
|---|---|---|
| F5 | SET | Opens Start, End and Step. |
| F6 | TABLE | Shows the table. |
11.2Change the start, end and step#
Half steps
Enter X², press SET: Start 0, End 2, Step 0.5; EXIT; TABLE.
MENU4X,θ,Tx²EXEF50EXE2EXE0.5EXEEXITF6
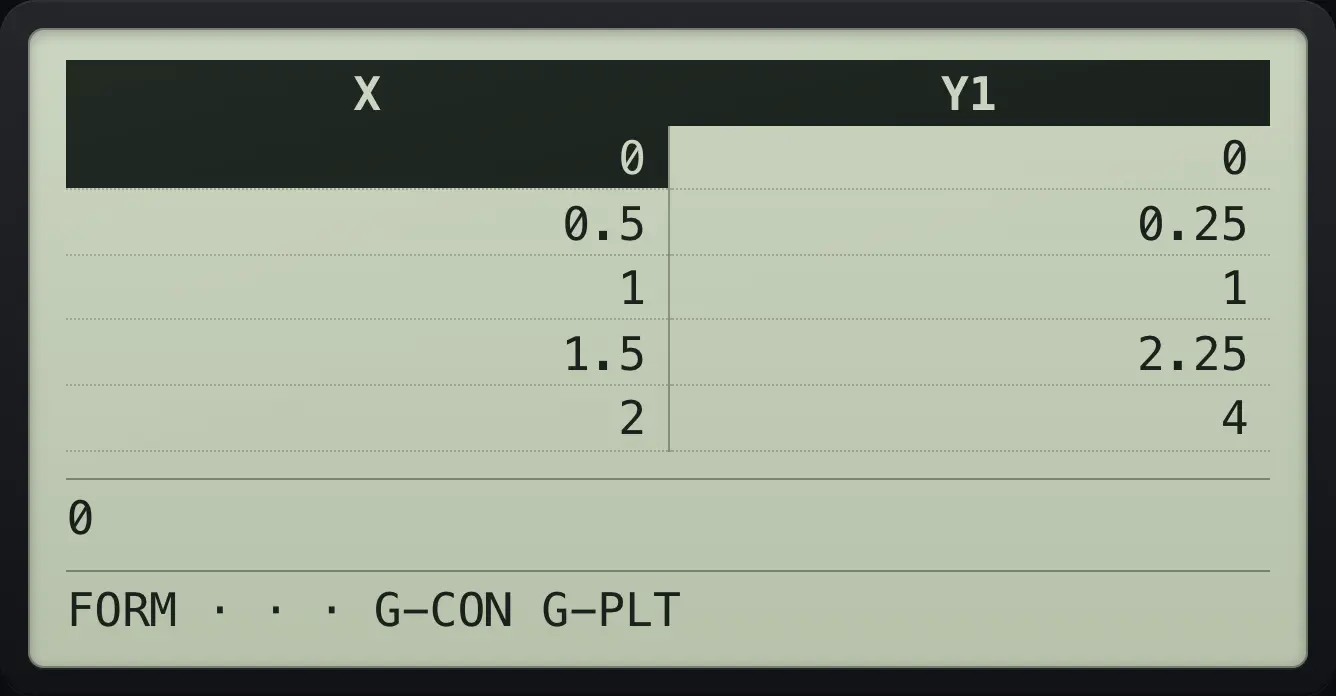
1.5 2.25 411.3Read a value and plot the table#
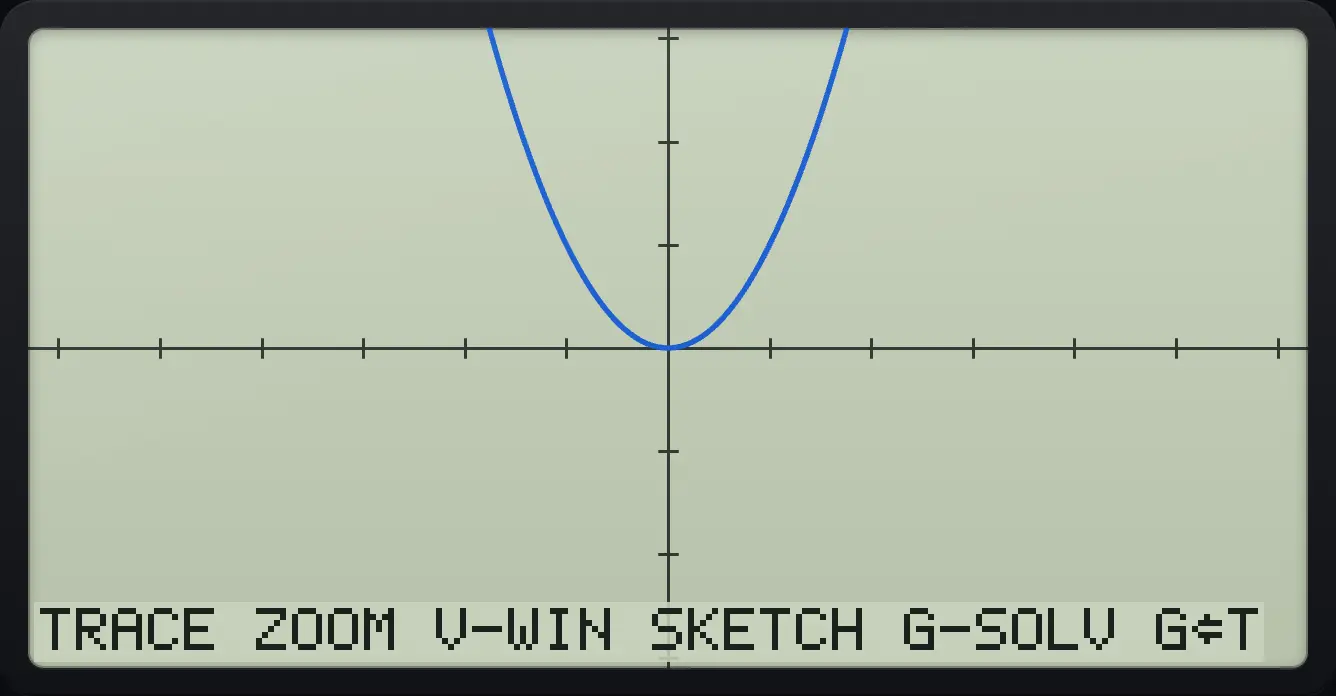
Cells are rounded to fit. The line below the table shows the full value of the selected cell. Type an X value and press EXE to recalculate a row. In the table bar, F1 (FORM) returns to the list, F5 (G-CON) draws the functions and F6 (G-PLT) plots the table points.
The full value
Y1 = X ÷ 3, move to the Y1 column.
MENU4X,θ,T÷3EXEF6▶
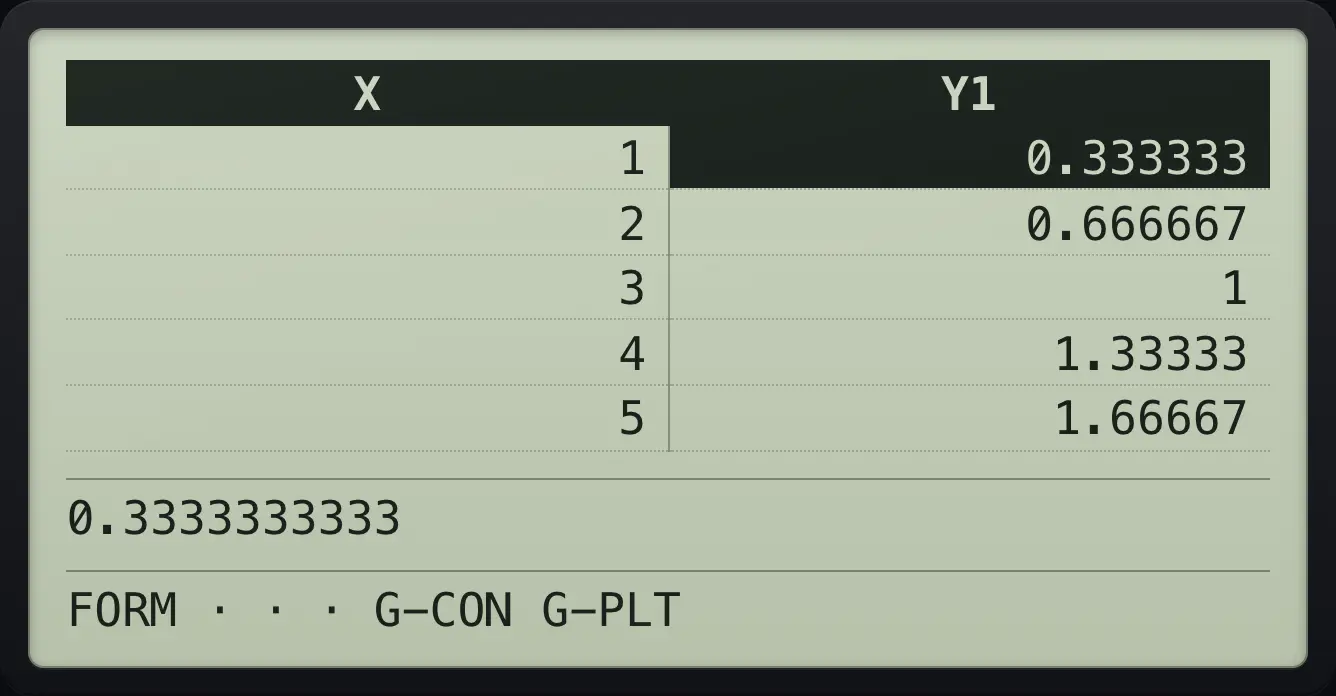
0.3333333333Draw from the table
Table of X², then G-CON.
MENU4X,θ,Tx²EXEF6F5
TRACEPlot the points
Table of X², then G-PLT.
MENU4X,θ,Tx²EXEF6F6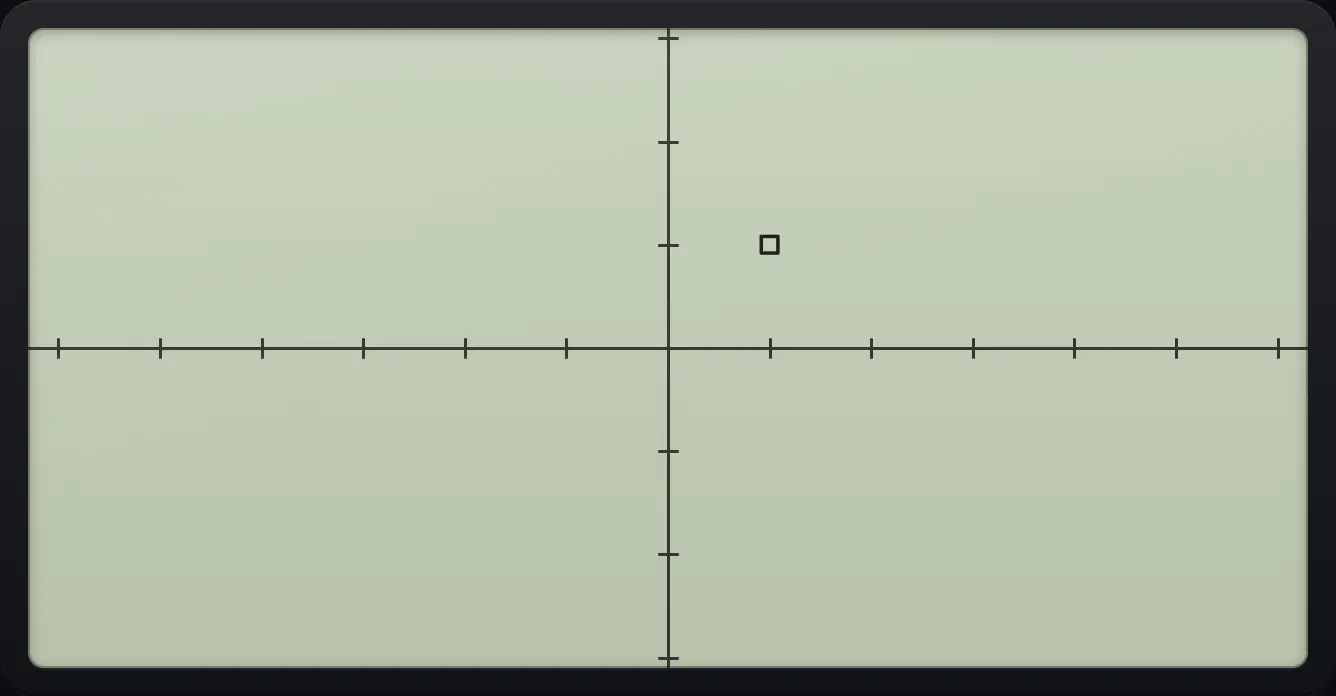
EXIT returns to the table.
EXIT
G-PLTNo function defined
Open Table and press TABLE with nothing entered.
MENU4F6
![Result of the example "No function defined" The display shows: Not Found / Press:[EXIT].](/trident/app/help/manual/img/c9e97409s.webp)
Not Foundfx-CG50 is a trademark of Casio Computer Co., Ltd.. Trident Calculator is an independent product by South View Studios and is not affiliated with, sponsored by or endorsed by Casio. The name is used only to describe the kind of calculator this model resembles; Trident's names, keys, display, fonts and software are its own clean-room design.