
RPN Power 48 manual · Chapter 13 of 20
Statistics
Collect data in ΣDAT, then mean, standard deviation, totals, line and curve fits, predictions and correlation from the STAT menu.
13.1Enter data with Σ+#
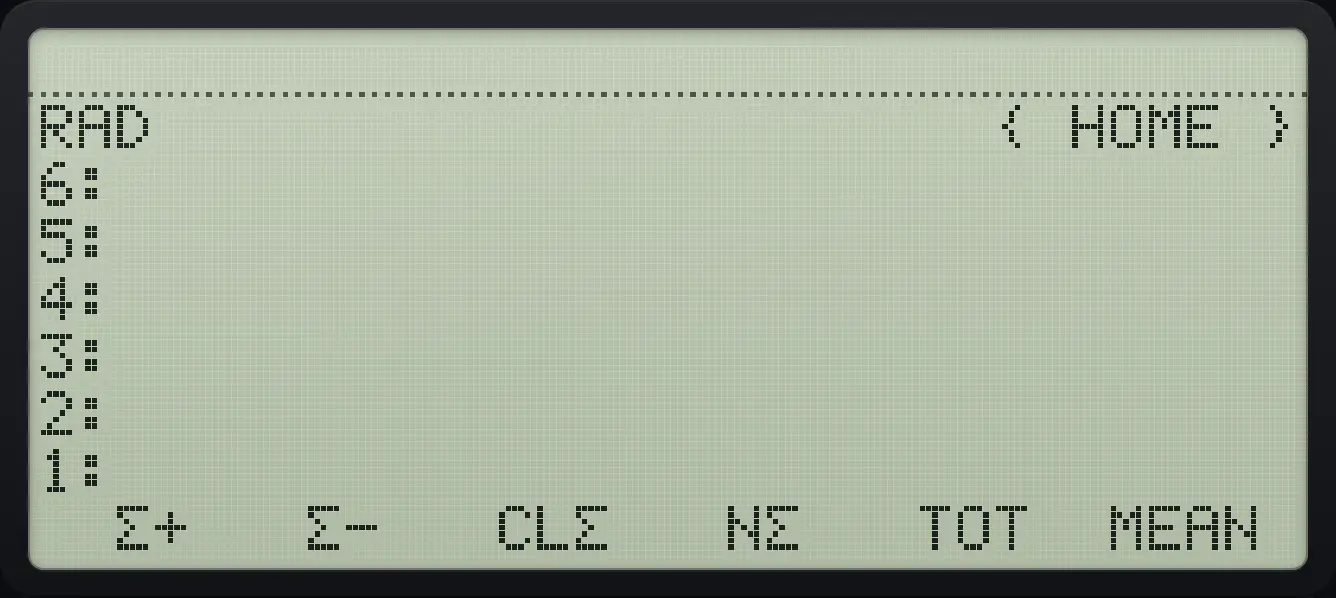
Statistics work on ΣDAT, a matrix variable with one row per data point. Σ+ adds the number on level 1 as a new row; a vector adds one row with several columns (x and y), and a matrix adds all its rows at once. Σ- removes the last row and puts it back on the stack, NΣ counts the rows and CLΣ deletes ΣDAT. The STAT menu is on the third page of APPS.
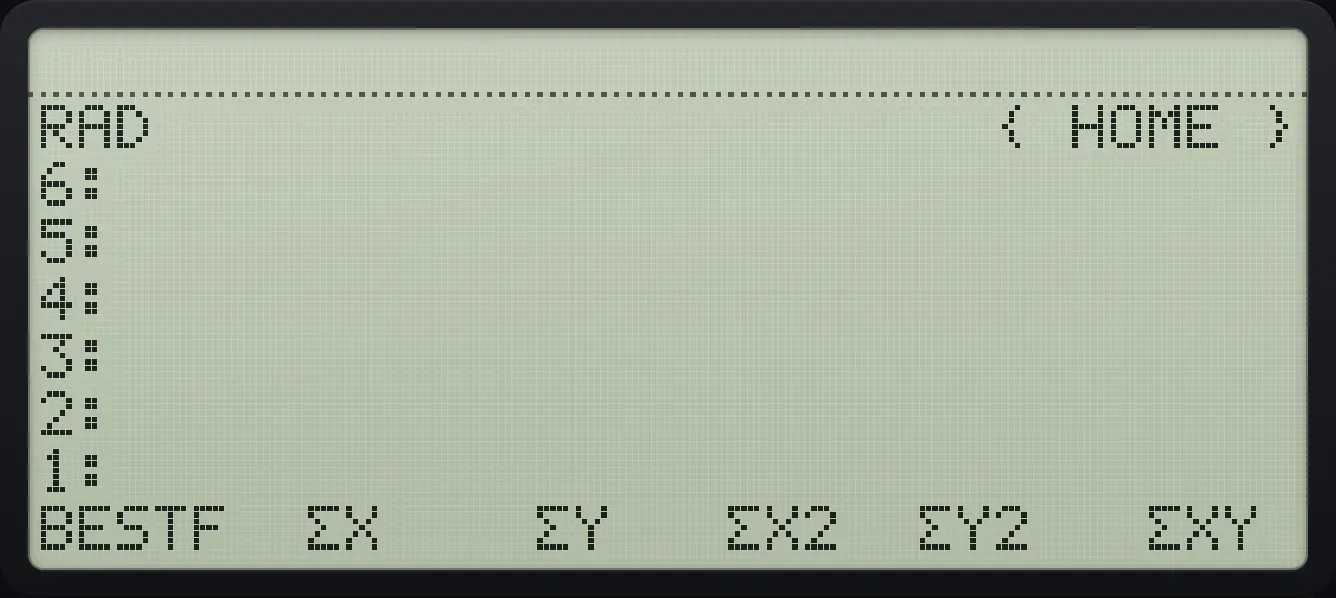
Enter three numbers and count them
Open STAT, then type each number and press Σ+ (first key). NΣ is the fourth key.
APPSNXTNXTF12F14F19F1F4
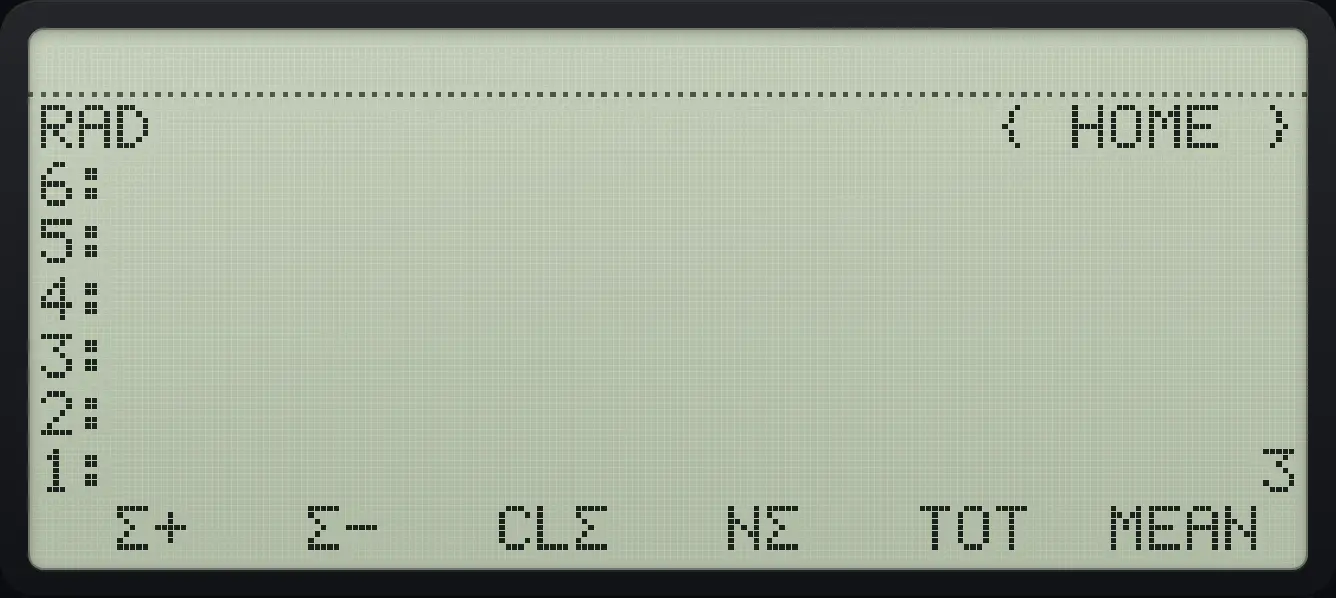
1: 3Take the last point back out
Σ- (second key) removes 9 from ΣDAT and returns it.
APPSNXTNXTF12F14F19F1F2
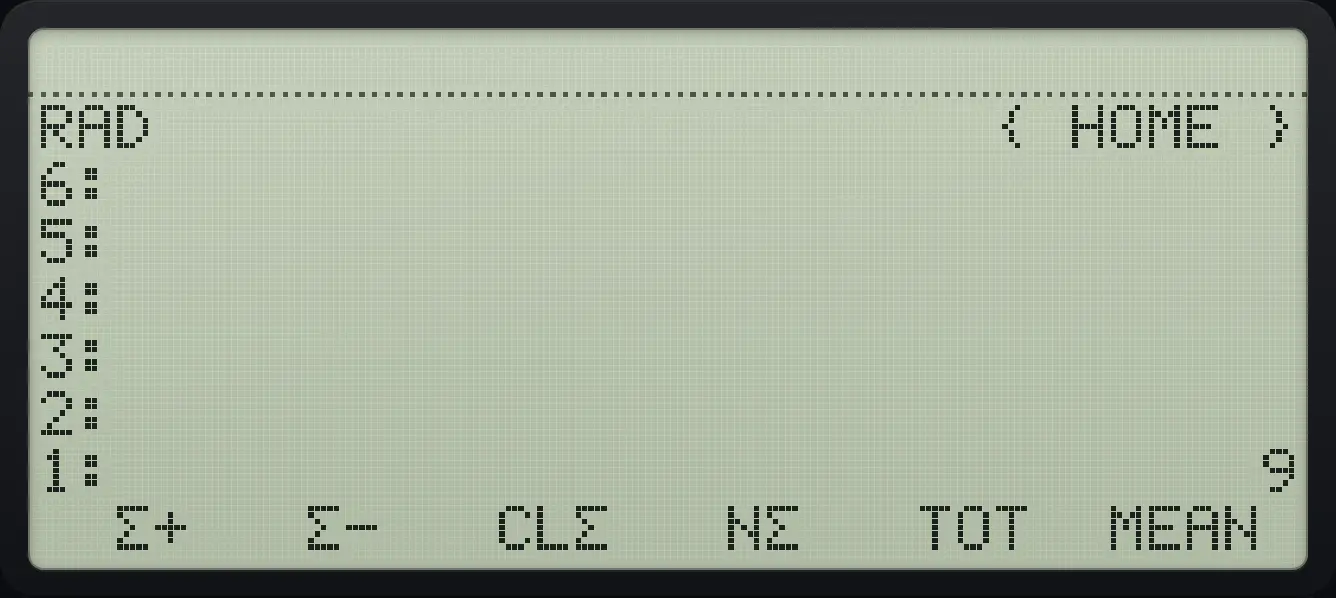
1: 913.2Mean, standard deviation and totals#
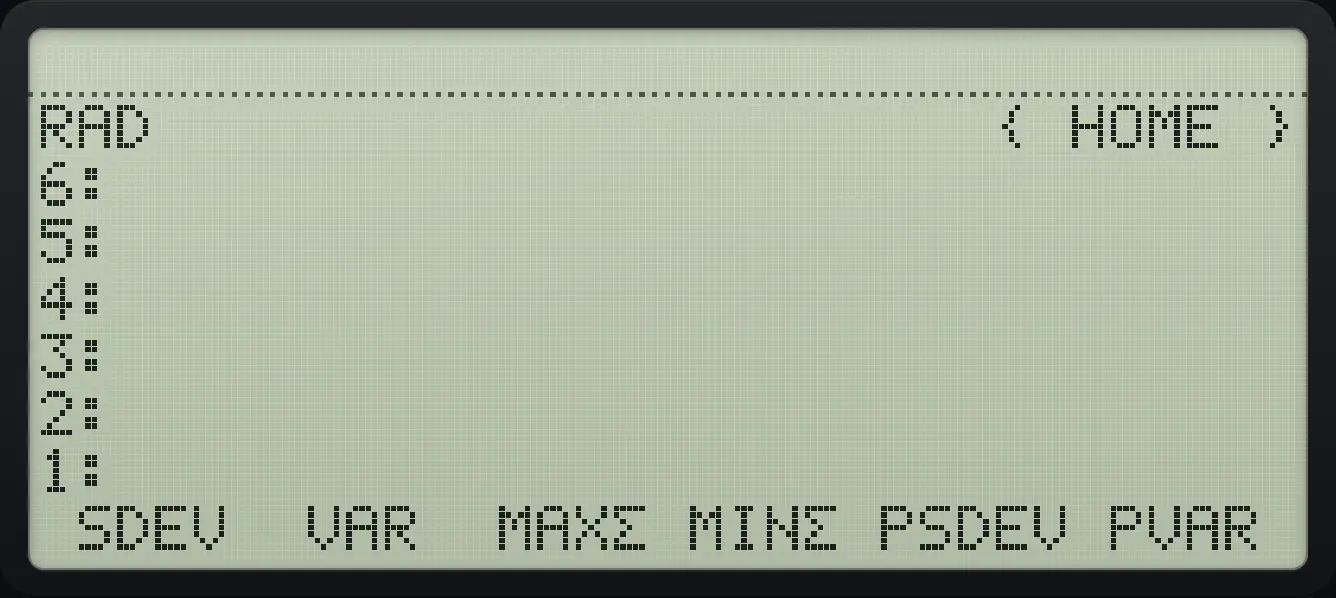
MEAN, TOT (the sum), MAXΣ and MINΣ work column by column: with one column the answer is a number, with several it is a vector. SDEV and VAR are the sample standard deviation and variance (dividing by n − 1); PSDEV and PVAR are the population versions (dividing by n).
Mean of 2, 4 and 9
Enter the data, then MEAN (sixth key).
APPSNXTNXTF12F14F19F1F6
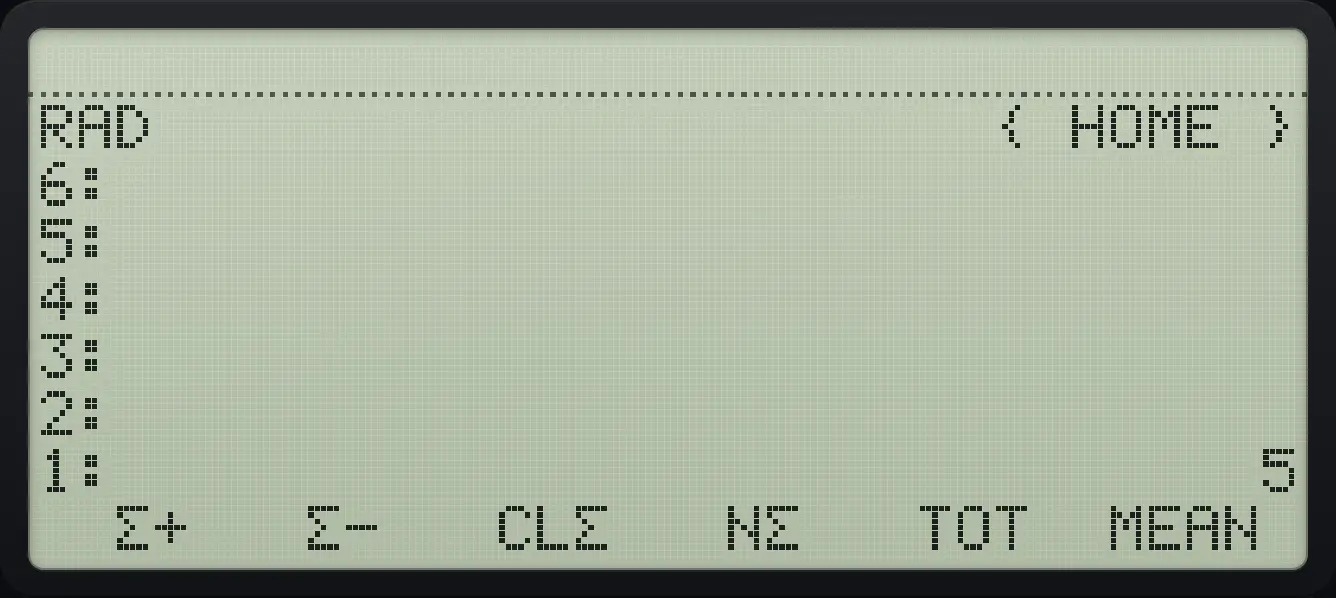
1: 5Sample standard deviation
SDEV is the first key on page 2.
APPSNXTNXTF12F14F19F1NXTF1
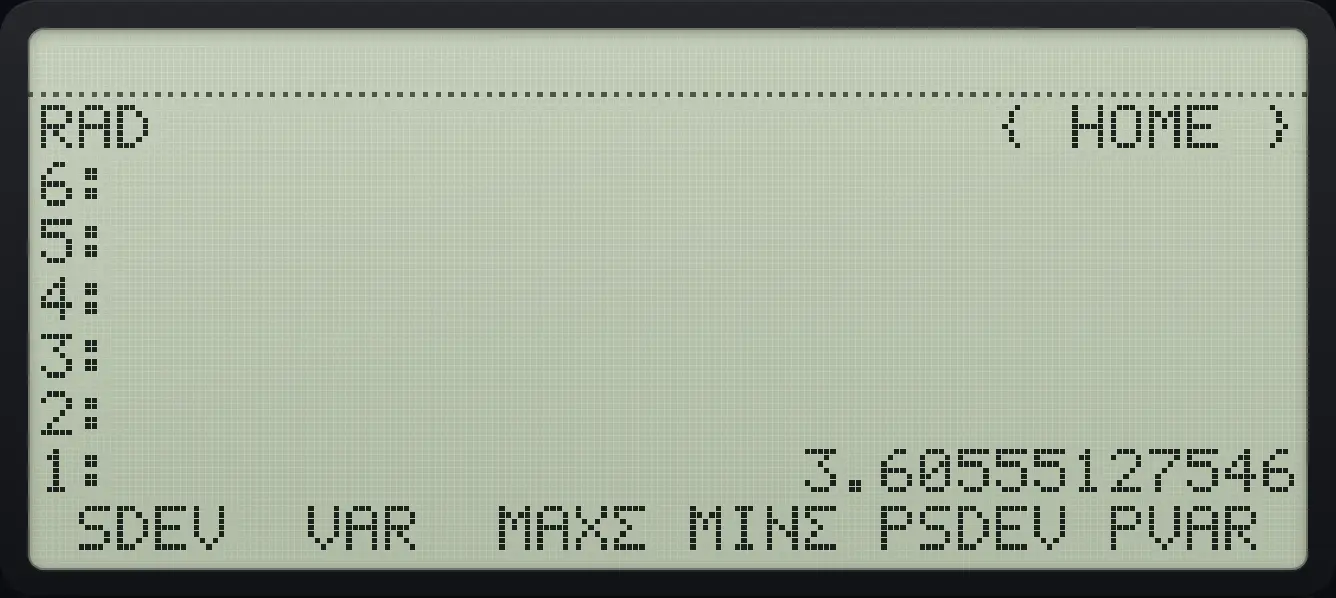
1: 3.60555127546Population standard deviation
PSDEV is the fifth key on page 2.
APPSNXTNXTF12F14F19F1NXTF5
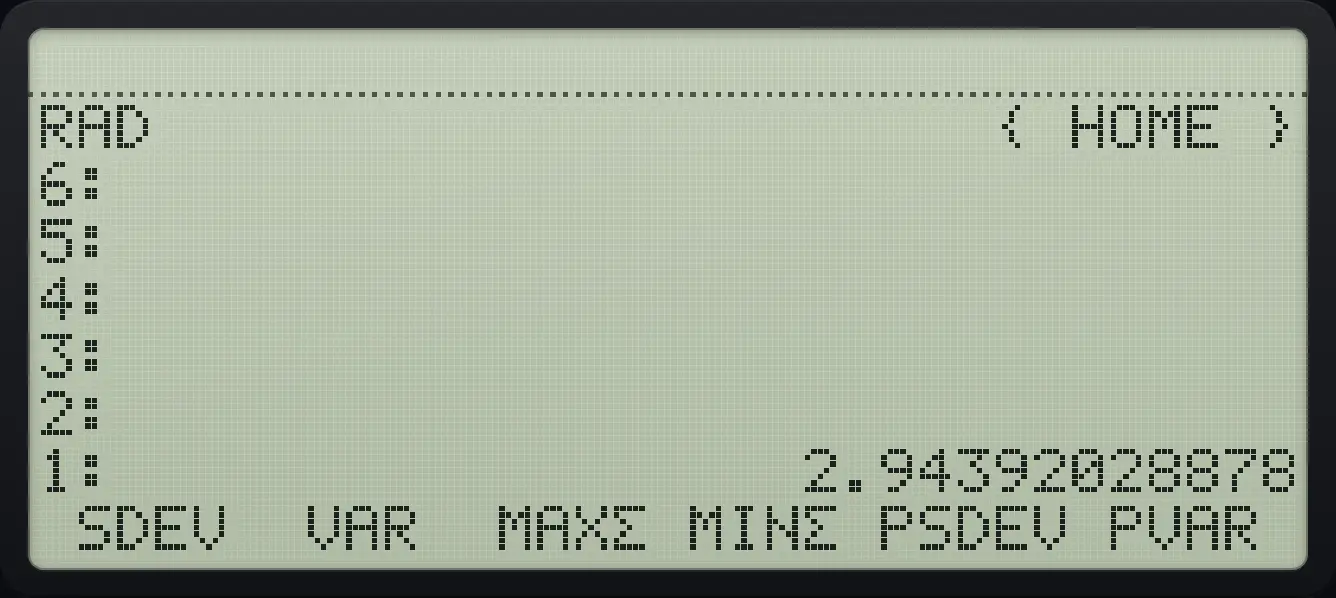
1: 2.94392028878Means of two columns
Enter the points (1, 2), (2, 4), (3, 7) as a matrix, Σ+, then MEAN: one mean per column.
◀[ ]9◀[ ]91SPC2▶▶◀[ ]92SPC4▶▶◀[ ]93SPC7ENTERAPPSNXTNXTF1F1F6
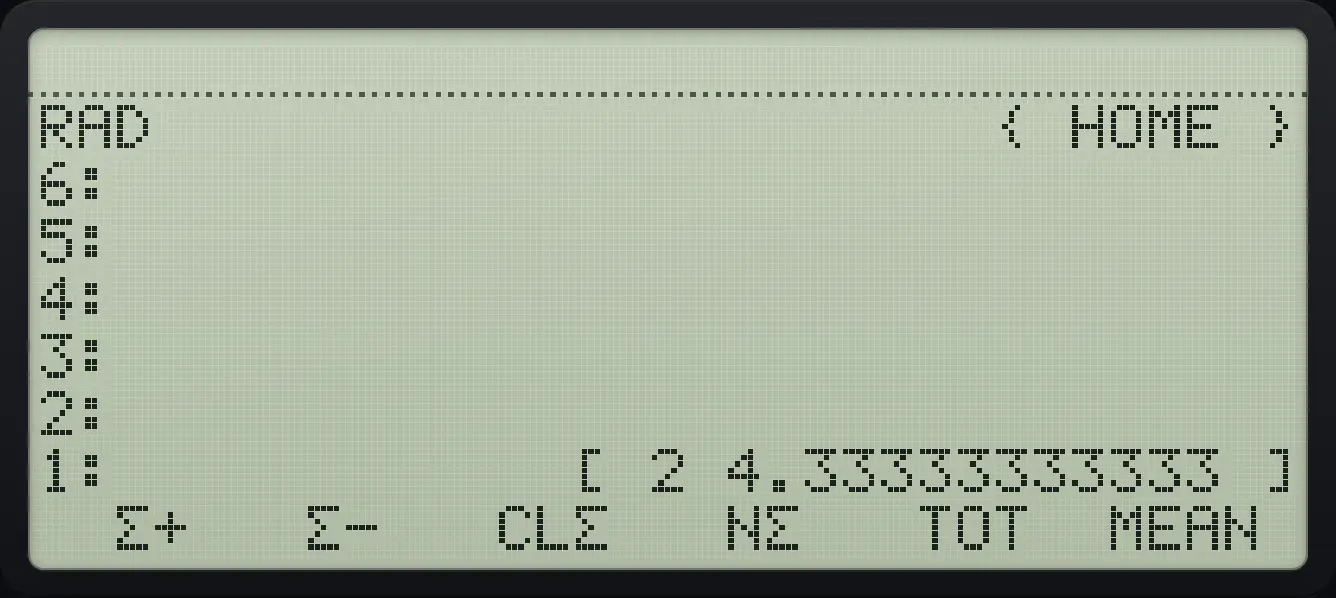
[ 2 4.33333333333 ]13.3Fit a line or curve and predict#
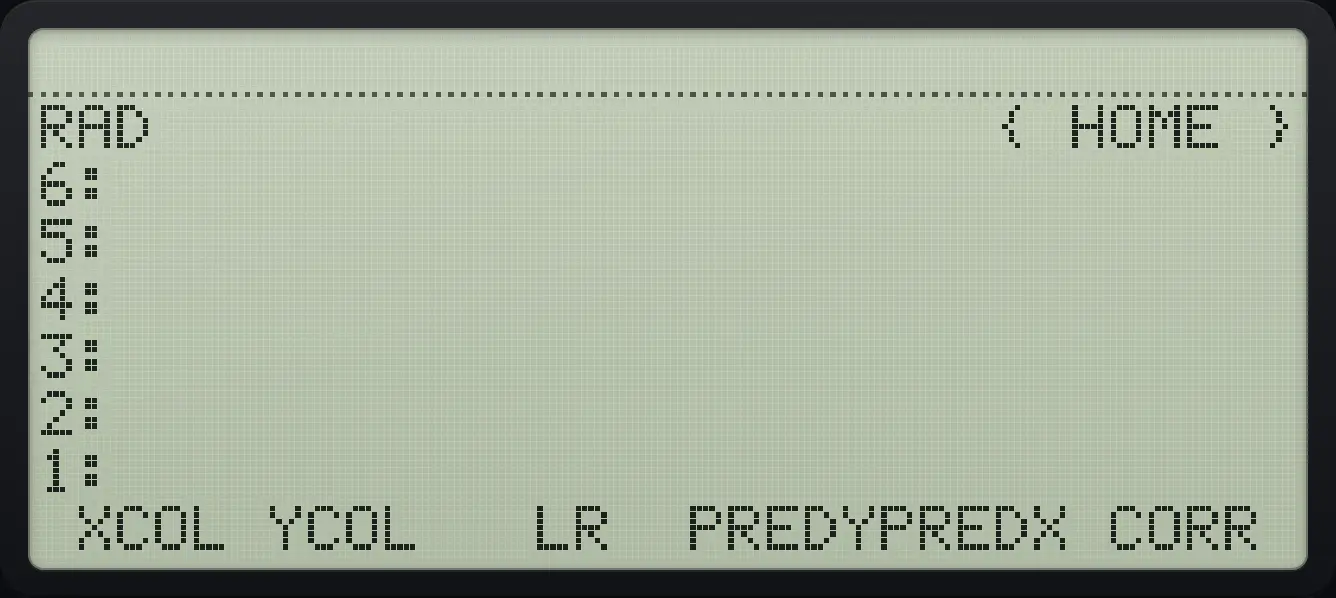
With two columns, LR fits y = b + m·x by least squares and returns the intercept and slope, tagged. They are also kept in ΣPAR, so PREDY gives the y for an x and PREDX the x for a y. CORR is the correlation coefficient, COV and PCOV the sample and population covariance. XCOL and YCOL choose which columns are x and y (1 and 2 at first).
Fit a line
Enter (1, 2), (2, 4), (3, 7), Σ+, then LR (page 3, third key).
◀[ ]9◀[ ]91SPC2▶▶◀[ ]92SPC4▶▶◀[ ]93SPC7ENTERAPPSNXTNXTF1F1NXTNXTF3
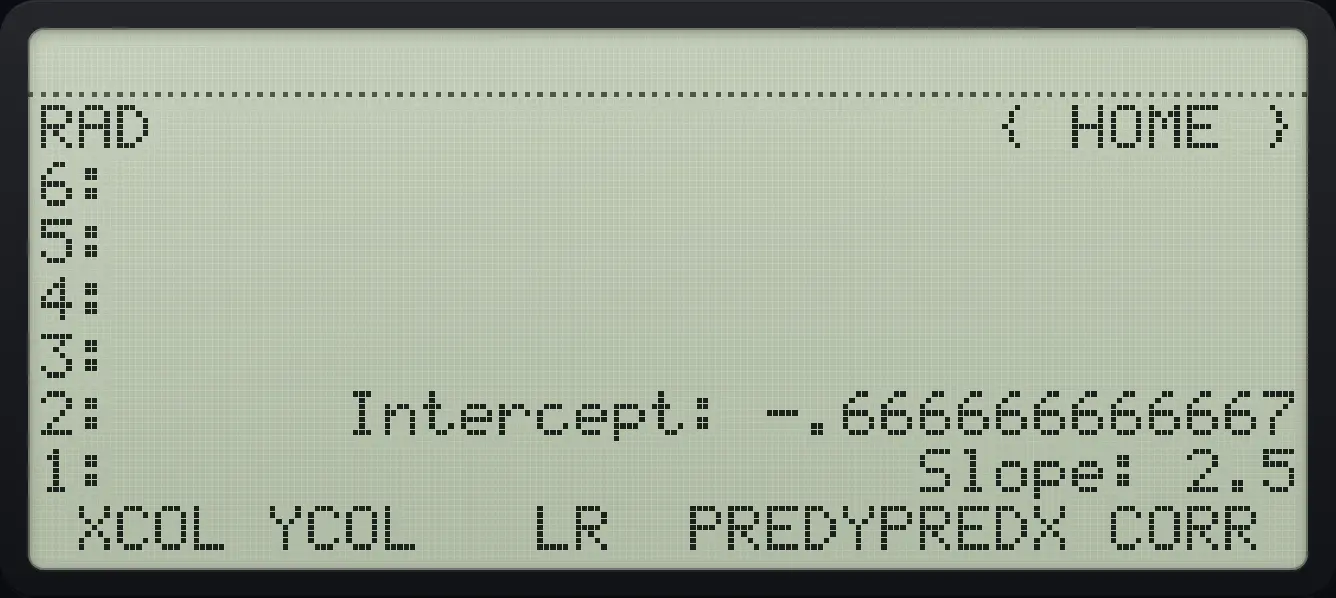
Intercept: -.666666666667 Slope: 2.5Predict y at x = 4
After LR, drop the two results, type 4 and press PREDY (fourth key).
◀[ ]9◀[ ]91SPC2▶▶◀[ ]92SPC4▶▶◀[ ]93SPC7ENTERAPPSNXTNXTF1F1NXTNXTF3←←4F4
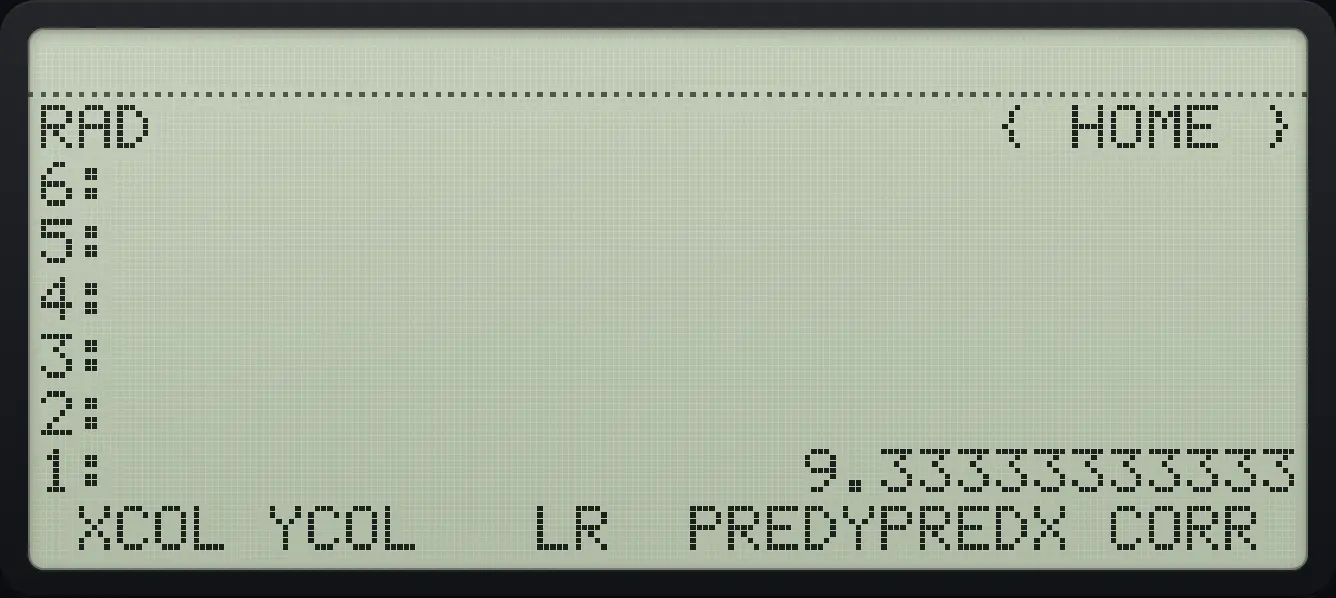
1: 9.33333333333Correlation
CORR is the sixth key on page 3.
◀[ ]9◀[ ]91SPC2▶▶◀[ ]92SPC4▶▶◀[ ]93SPC7ENTERAPPSNXTNXTF1F1NXTNXTF6
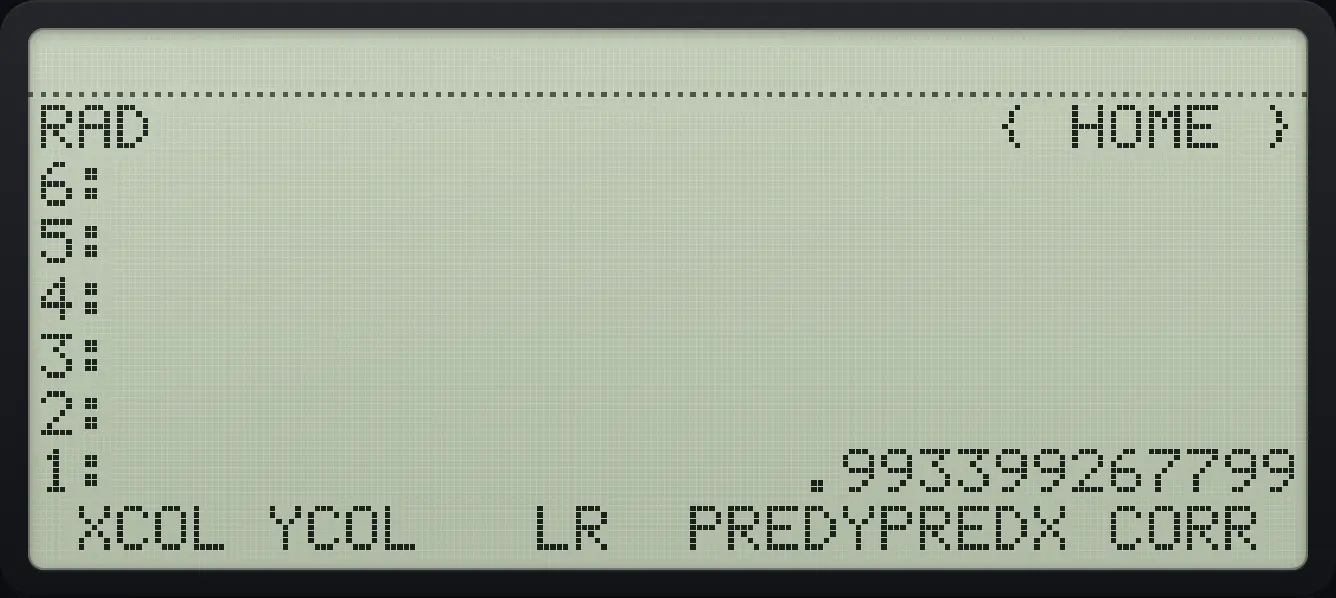
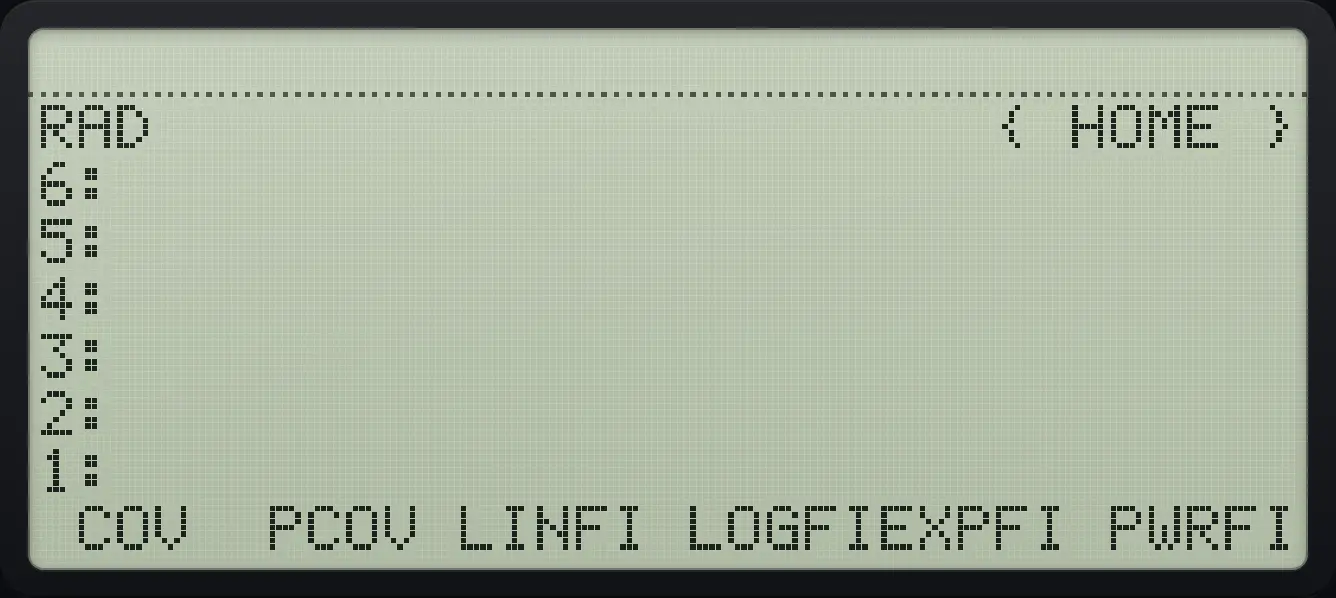
1: .993399267799| Model (STAT page 4) | Fits | Fitted as |
|---|---|---|
| LINFIT | y = b + m·x | y against x |
| LOGFIT | y = b + m·ln x | y against ln x |
| EXPFIT | y = b·e^(m·x) | ln y against x |
| PWRFIT | y = b·x^m | ln y against ln x |
Choose a model before LR. BESTFIT (page 5, first key) tries all four, keeps the one with the largest correlation (models that would need the logarithm of zero or a negative number are skipped) and stores its intercept and slope in ΣPAR, ready for PREDY.
Let BESTFIT pick a power curve
Enter (1, 3), (2, 12), (3, 27), which lie on y = 3x², then Σ+ and BESTFIT.
◀[ ]9◀[ ]91SPC3▶▶◀[ ]92SPC12▶▶◀[ ]93SPC27ENTERAPPSNXTNXTF1F1NXTNXTNXTNXTF1Predict y at x = 4 with PREDY (page 3, fourth key).
4NXTNXTNXTF4
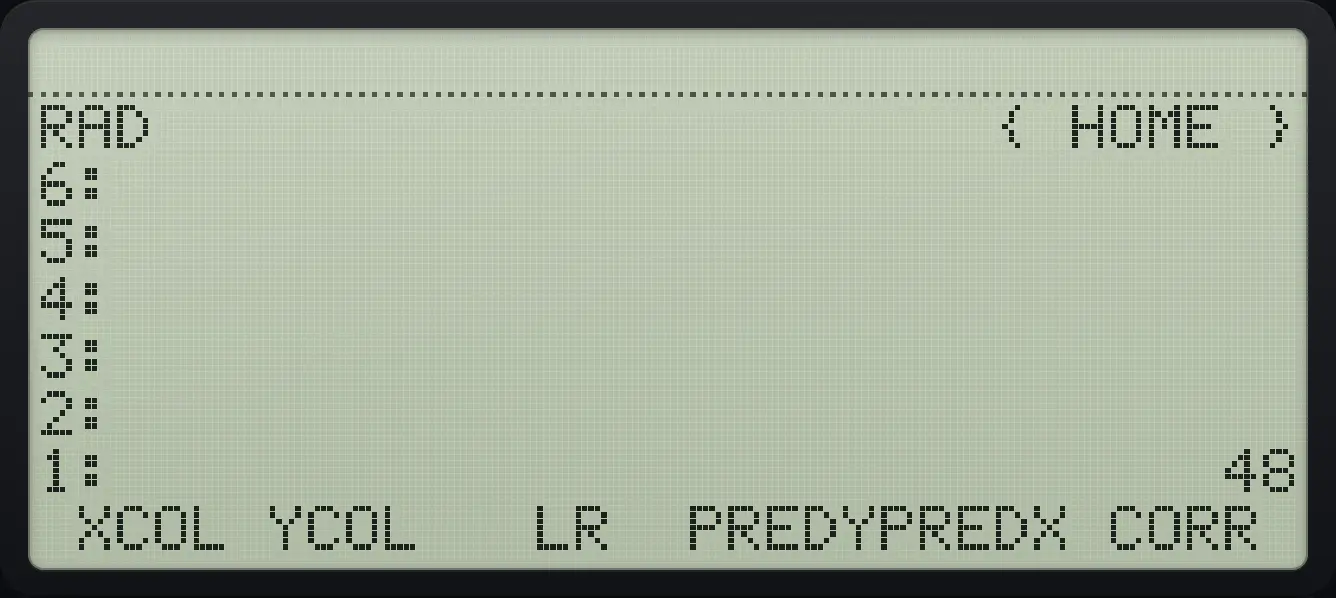
1: 48HP 48 and HP 50g is a trademark of HP Inc.. Trident Calculator is an independent product by South View Studios and is not affiliated with, sponsored by or endorsed by HP. The name is used only to describe the kind of calculator this model resembles; Trident's names, keys, display, fonts and software are its own clean-room design.