
Classic family · Instruction manual
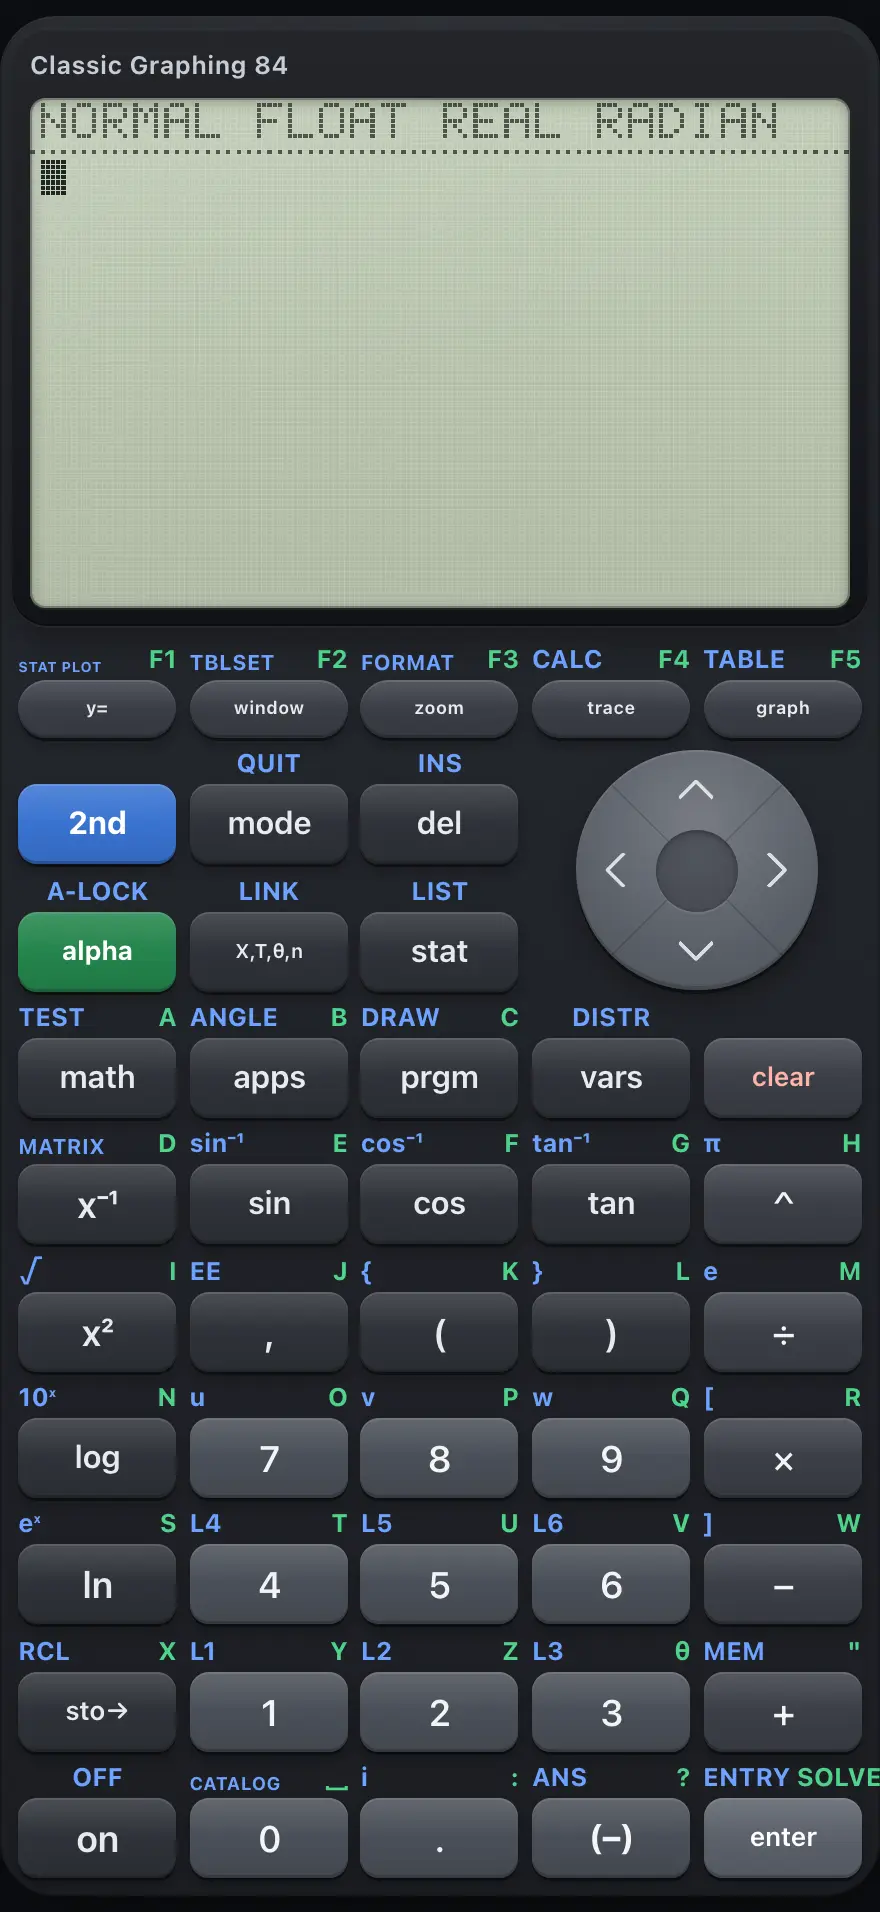
Classic Graphing 84
Classic Graphing 84 is a complete graphing calculator: a home screen for calculations, Y= graphs of functions, parametric and polar equations, tables, lists and statistics with regressions and tests, matrices, complex numbers, an equation solver and a programming language. This manual covers every key, menu and mode, with worked examples you can follow key by key.
Designed to feel familiar if you have used a TI-84 Plus CE graphing calculator.
- 25 chapters
- 136 topics
- 265 worked examples
Contents
- 1Getting startedWhat the Classic Graphing 84 is for, how the screen and the 2nd and alpha layers work, and how to enter, edit and clear a calculation.
- 2The keyboard, key by keyEvery key of the Classic Graphing 84 with what it does on its own, after 2nd and after alpha.
- 3Calculations on the home screenArithmetic, order of operations, negative numbers, scientific notation, the last answer and repeating entries.
- 4Functions: roots, logs, trig, probabilityPowers and roots, logarithms, trigonometry, rounding and number tools, probability, comparisons and logic.
- 5Fractions, angles and conversionsTurn decimals into fractions and back, work in mixed numbers, convert degrees, minutes and seconds, and convert between rectangular and polar coordinates.
- 6Modes and settingsEvery setting on the MODE screen: number format, decimals, angle unit, graph type, connected or dot, complex mode, fractions and statistics diagnostics.
- 7Variables and memoryStore numbers in letters, recall them, use stored values in calculations, and clear entries, lists or all memory.
- 8Graphing functionsEnter equations in the Y= editor, draw them, switch them on and off, change colors, graph parametric and polar equations, and set the graph format.
- 9The window and zoomChoose which part of the plane a graph shows with WINDOW, and change the view quickly with the ZOOM menu.
- 10Trace and the CALCULATE toolsMove along a graph with TRACE, jump to an x value, and use CALCULATE to find values, zeros, minimums, maximums, intersections, slopes and areas.
- 11Tables of valuesShow a table of x and y values for your functions, choose where it starts and its step, or ask for individual values.
- 12ListsStore data in lists, edit them in the STAT editor, calculate with whole lists and use the LIST menu.
- 13One- and two-variable statisticsSummarize a list with 1-Var Stats (mean, standard deviation, quartiles), study pairs with 2-Var Stats, and use frequency lists.
- 14Regression: fitting curves to dataFit lines, polynomials, exponentials, powers, logarithms, logistic and sine curves to data, store the equation in Y= and read r and R².
- 15Statistics plotsDraw scatter plots, line plots, histograms and box plots of your lists, and fit the window to the data with ZoomStat.
- 16Probability distributionsNormal, t, chi-square, F, binomial, Poisson and geometric probabilities, inverse normal and t, and shading areas on a graph.
- 17Hypothesis tests and confidence intervalsZ, t, proportion, chi-square, F, regression and ANOVA tests, and the matching confidence intervals, with Data or Stats input.
- 18MatricesEnter matrices on the home screen or in the matrix editor, then add, multiply, invert, transpose, row-reduce and find determinants.
- 19Complex numbersTurn on a complex mode, type numbers with i, calculate, and use conj, real, imag, angle, abs and the rectangular and polar forms.
- 20Numeric calculus and sumsMinimums and maximums, numeric derivatives and integrals, and sums of a rule, all from the MATH menu.
- 21The equation solverSolve an equation for any one variable numerically, with a guess and optional bounds.
- 22ProgrammingWrite, edit and run programs: the editor, the CTL and I/O command menus, loops, decisions, input and output, menus, subprograms and strings.
- 22.1What a program is
- 22.2Create and run your first program
- 22.3Edit, rename and delete programs
- 22.4The CTL menu: loops, decisions and jumps
- 22.5The I/O menu: input and output
- 22.6Ask for numbers and show a result
- 22.7Repeat steps with a For loop
- 22.8Make decisions with If, Then and Else
- 22.9Repeat while a condition is true (While)
- 22.10Jump with Lbl and Goto
- 22.11Show a menu to the user
- 22.12Place text on the screen with Output(
- 22.13Call one program from another
- 22.14Text and strings
- 22.15Lists inside programs
- 22.16Stop a running program
- 22.17Read the keyboard with getKey
- 23Drawing on the graphDraw lines, circles, points and text on the graph screen with the DRAW menu, and shade distribution areas.
- 24Error messagesEvery error message the calculator can show, what it means and how to fix it.
- 25Reference: limits, resetting and what is not includedNumber range and precision, display limits, how to reset the calculator and the features of a full graphing handheld that this version leaves out.
TI-84 Plus CE is a trademark of Texas Instruments Incorporated. Trident Calculator is an independent product by South View Studios and is not affiliated with, sponsored by or endorsed by Texas Instruments. The name is used only to describe the kind of calculator this model resembles; Trident's names, keys, display, fonts and software are its own clean-room design.