
Classic Graphing 84 manual · Chapter 9 of 25
The window and zoom
Choose which part of the plane a graph shows with WINDOW, and change the view quickly with the ZOOM menu.
9.1Set the viewing window#
The graph screen shows a rectangle of the plane. WINDOW sets its edges: Xmin and Xmax (left and right), Ymin and Ymax (bottom and top), the tick spacing Xscl and Yscl, and Xres (how many pixels apart points are plotted; 1 is the finest). The standard window is −10 to 10 on both axes.
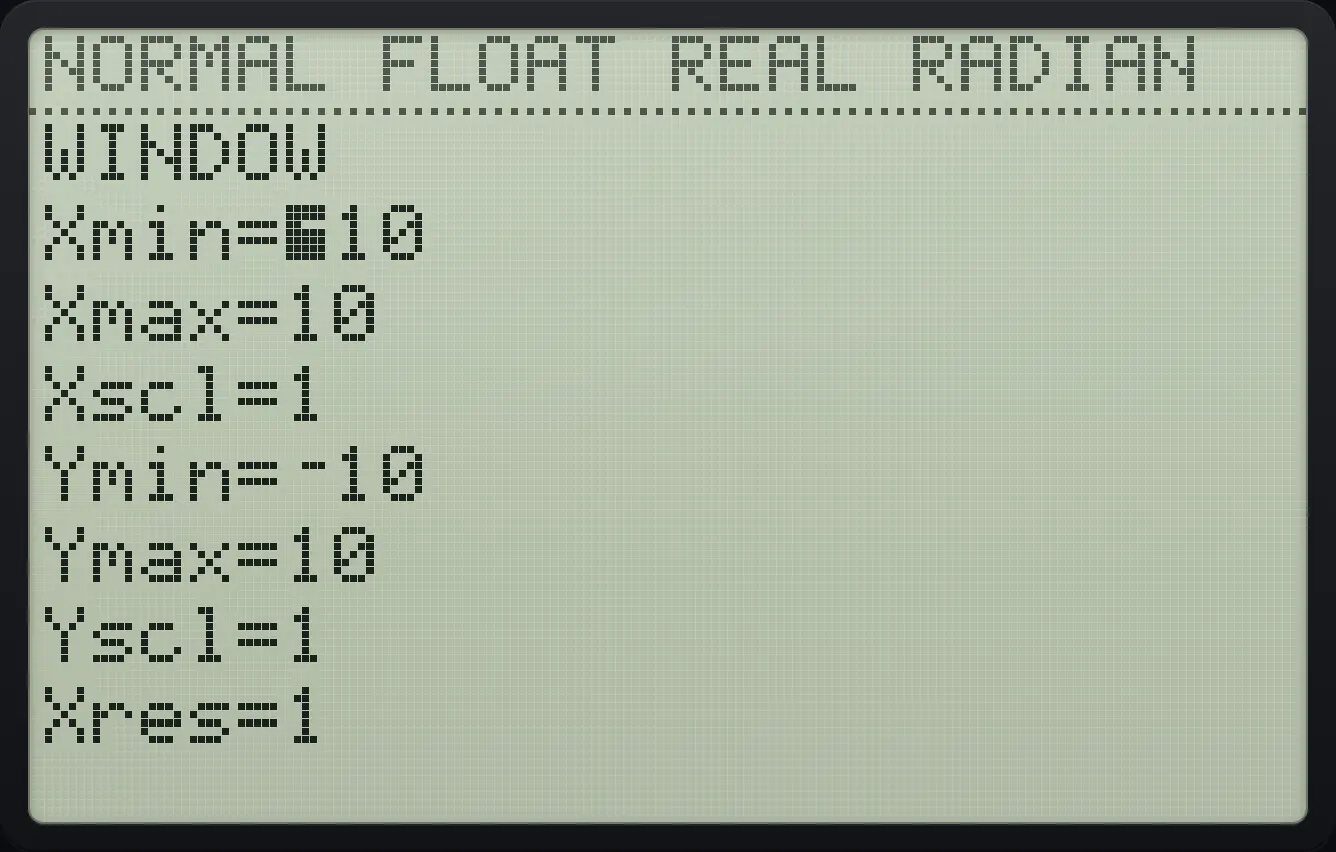
Move between fields with ▼ and ▲. Type a new number to replace a value (an expression such as −2π also works), then press enter.
Change Xmax
In WINDOW move down once to Xmax, type 5 and press enter.
window▼5enter▲
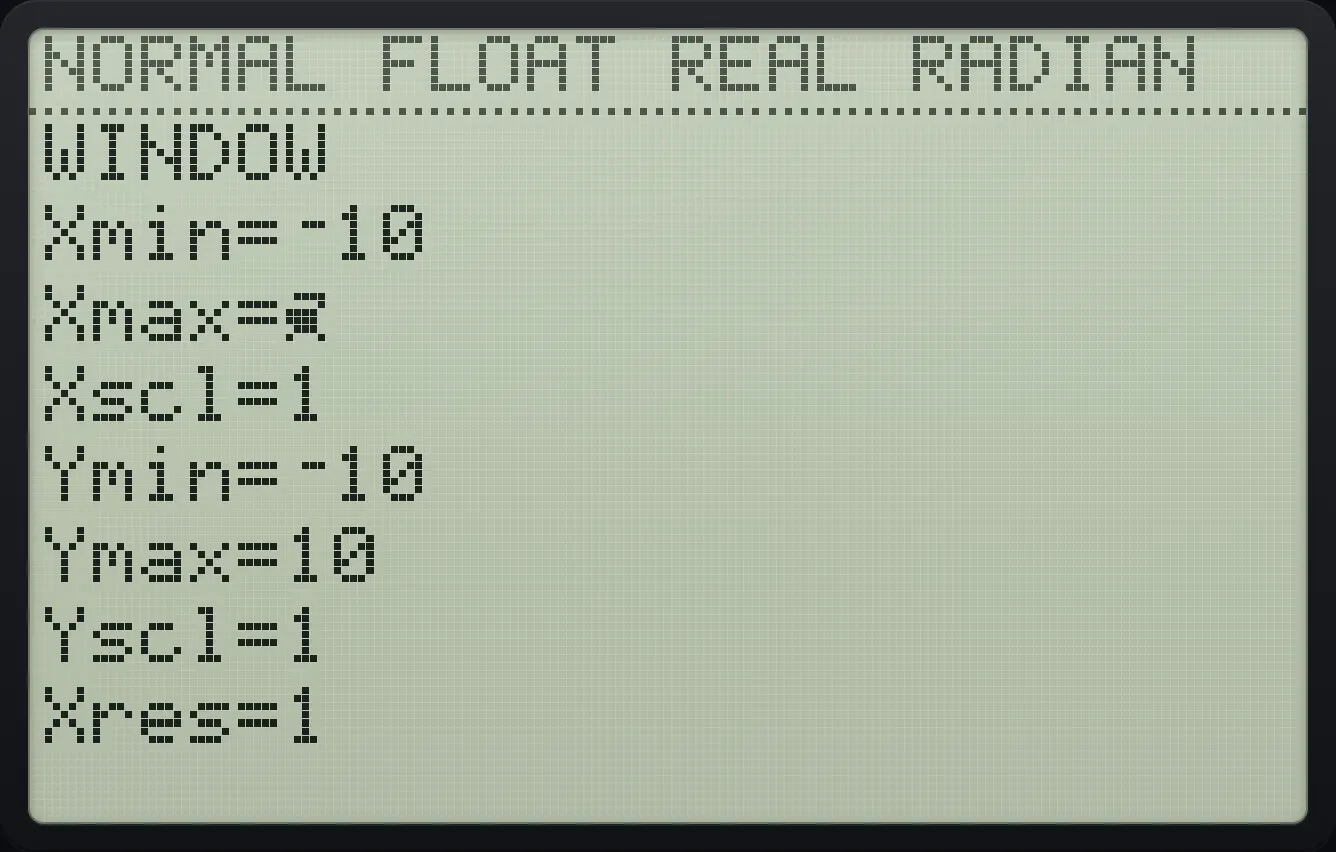
Xmax=5Type an expression in a field
Type −2π in Xmin and press enter, then move up.
window(−)22ndπ^enter▲
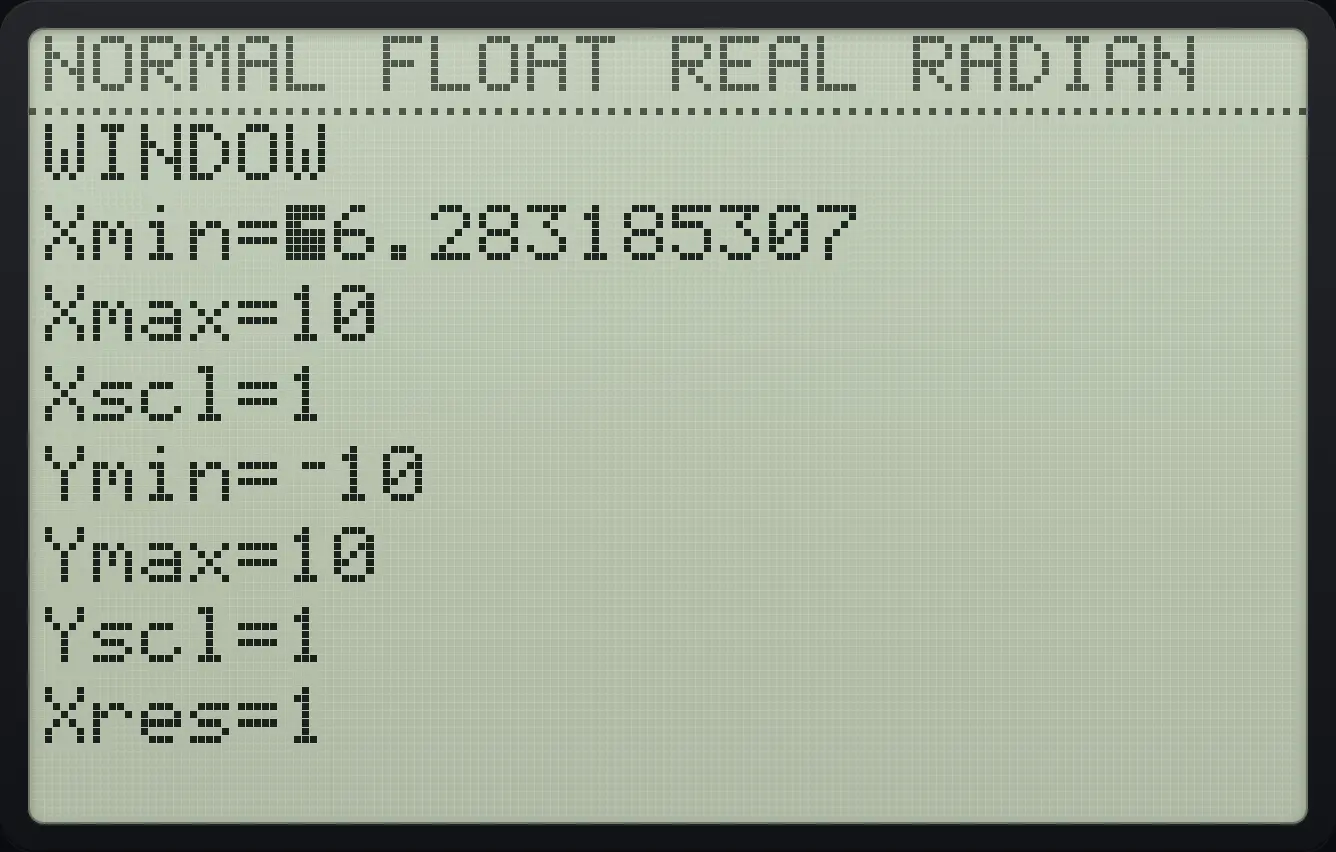
Xmin=⁻6.283185307A window that cannot be drawn
Set Xmin to 20, which is bigger than Xmax, then press graph.
window20entergraph
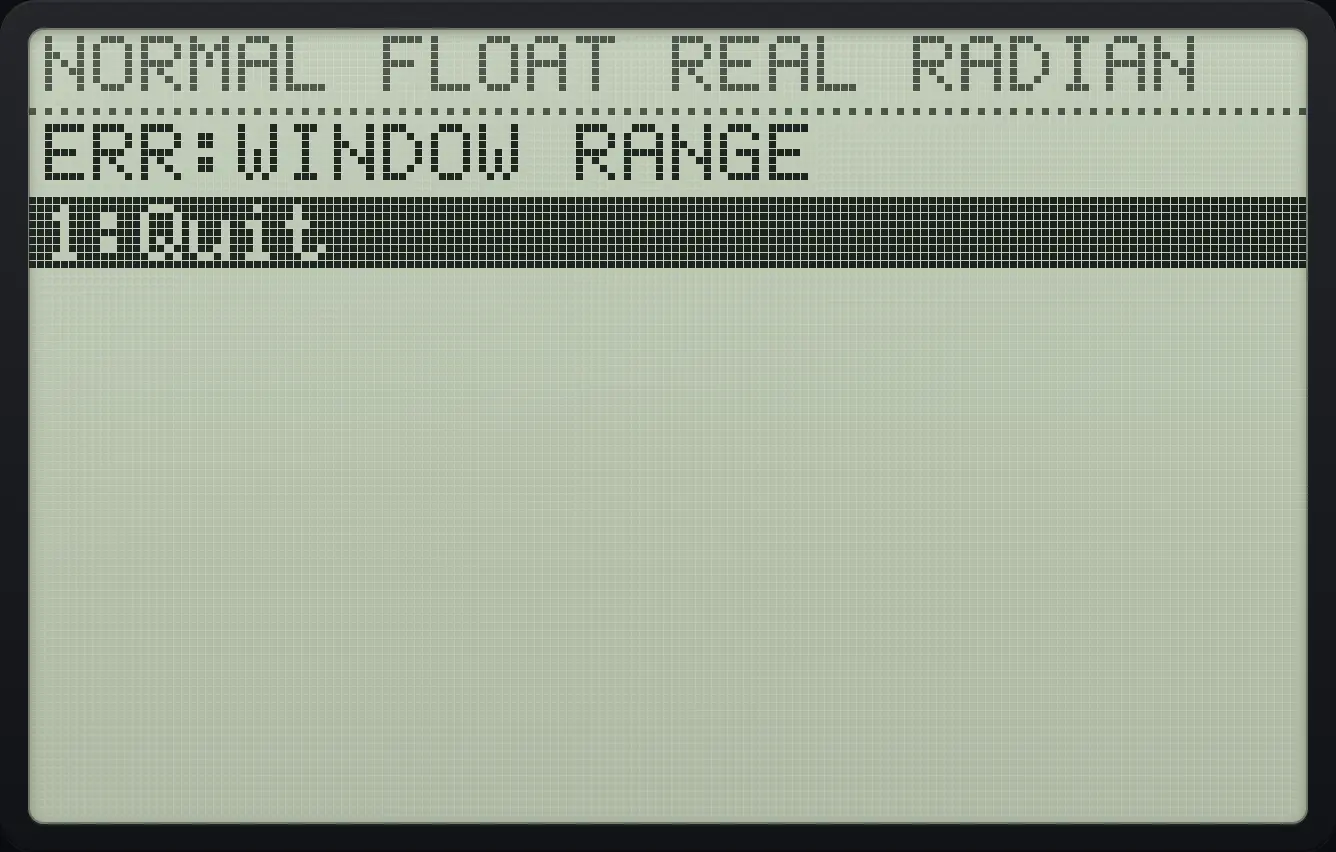
ERR:WINDOW RANGE9.2The ZOOM menu#
Press zoom. Choose an item with its number, or press ▶ for the MEMORY tab.
![The ZOOM menu. The display shows: [ZOOM] MEMORY / 1:ZBox / 2:Zoom In / 3:Zoom Out / 4:ZDecimal / 5:ZSquare / 6:ZStandard / 7↓ZTrig.](/trident/app/help/manual/img/a4e4a968s.webp)
| Item | What it does |
|---|---|
| 1: ZBox | Drag a rectangle with the cursor and zoom to it. |
| 2: Zoom In | Zooms in by 4 times about the point you choose. |
| 3: Zoom Out | Zooms out by 4 times about the point you choose. |
| 4: ZDecimal | Window −6.6 to 6.6 by −4.1 to 4.1: each trace step is exactly 0.1. |
| 5: ZSquare | Makes units equal on both axes so circles look round. |
| 6: ZStandard | Resets to −10 to 10 on both axes. |
| 7: ZTrig | X from −10π/3 to 10π/3 with ticks every π/2, Y from −4 to 4. |
| 8: ZInteger | Centres the window and makes each trace step a whole number. |
| 9: ZoomStat | Fits the window to the data of the statistics plots that are on. |
| 0: ZoomFit | Keeps X and chooses Y so the whole graph fits. |
| A: ZQuadrant1 | Shows only the first quadrant (x and y from 0). |
MEMORY tab: 1 ZPrevious goes back to the window before the last zoom, 2 ZoomSto saves the current window, 3 ZoomRcl restores the saved one.
ZDecimal
Press zoom then 4, then open WINDOW to read the values.
zoom4window
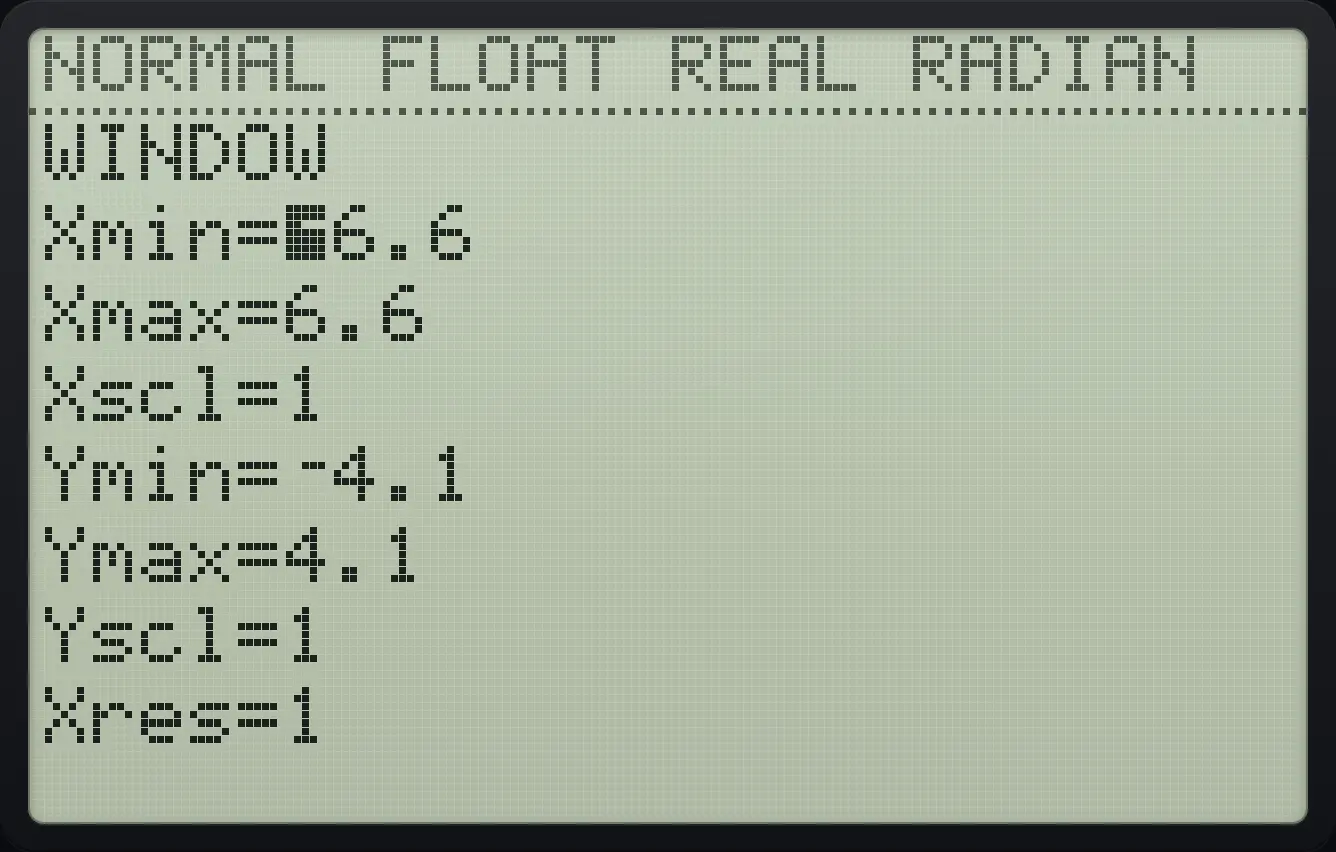
Xmin=⁻6.6 Xmax=6.6 Ymin=⁻4.1ZInteger
Press zoom then 8, then WINDOW.
zoom8window
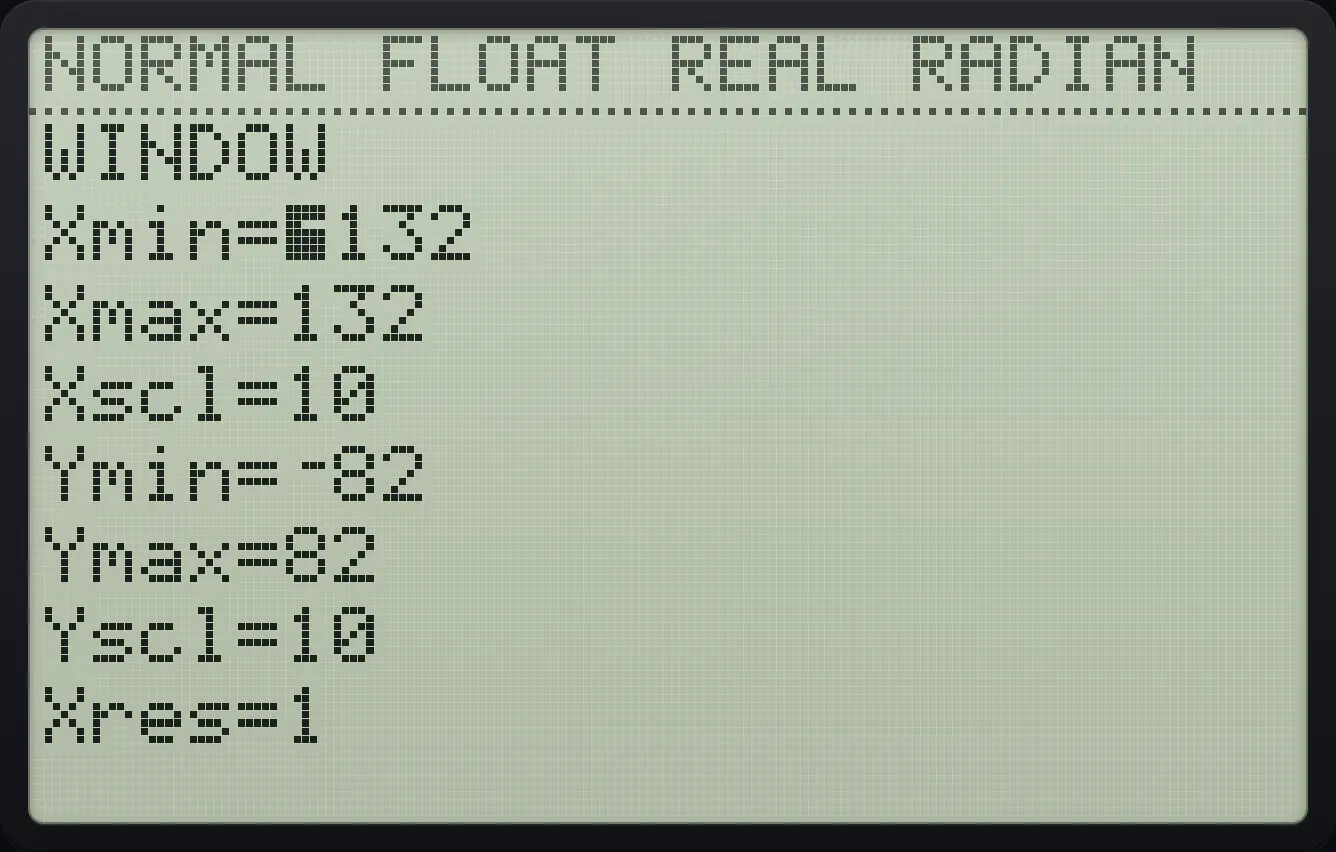
Xmin=⁻132 Xmax=132ZTrig
Press zoom then 7, then WINDOW.
zoom7window
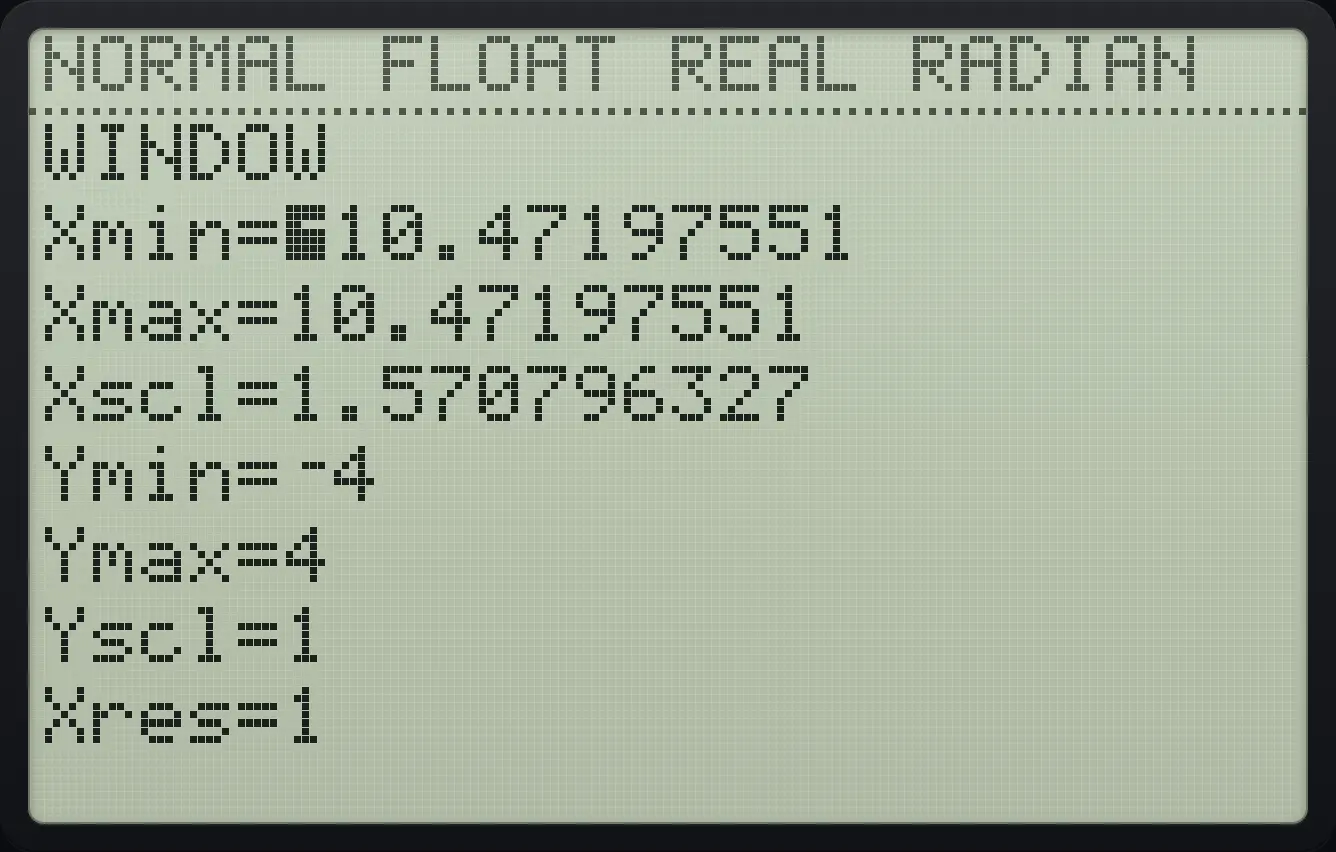
Xmin=⁻10.47197551 Ymax=4Go back with ZPrevious
Zoom to ZDecimal.
zoom4Press zoom, right, 1 (ZPrevious), then open WINDOW. The old Xmax of 10 is back.
zoom▶1window
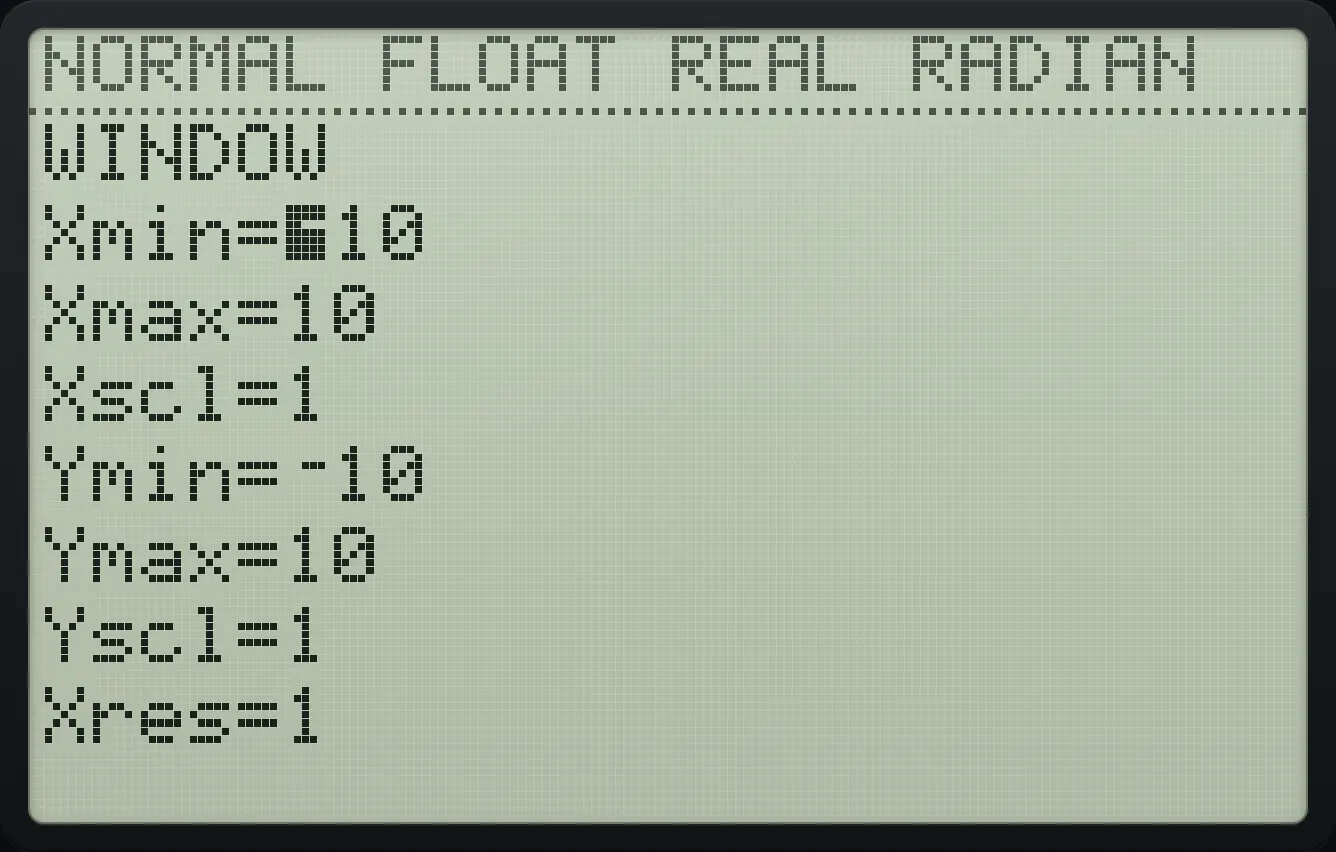
Xmax=10Save and restore a window
Zoom to ZDecimal and save it with zoom, right, 2 (ZoomSto).
zoom4zoom▶2Zoom to ZStandard, then restore with zoom, right, 3 (ZoomRcl) and open WINDOW.
zoom6zoom▶3window
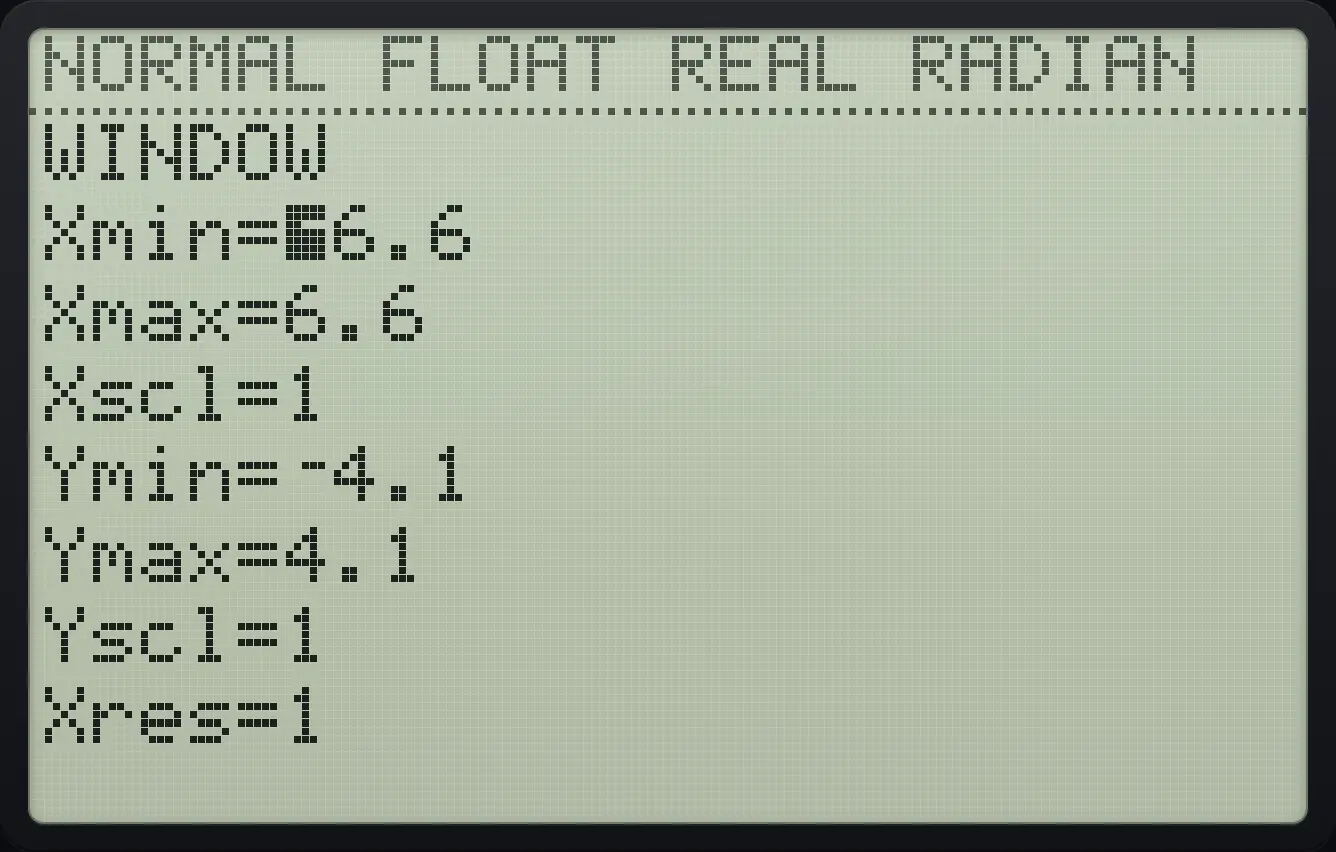
Xmax=6.6ZoomFit
Graph Y1 = X² and press zoom 0. The Y range is chosen to fit the curve.
y=X,T,θ,nx²▼zoom0window
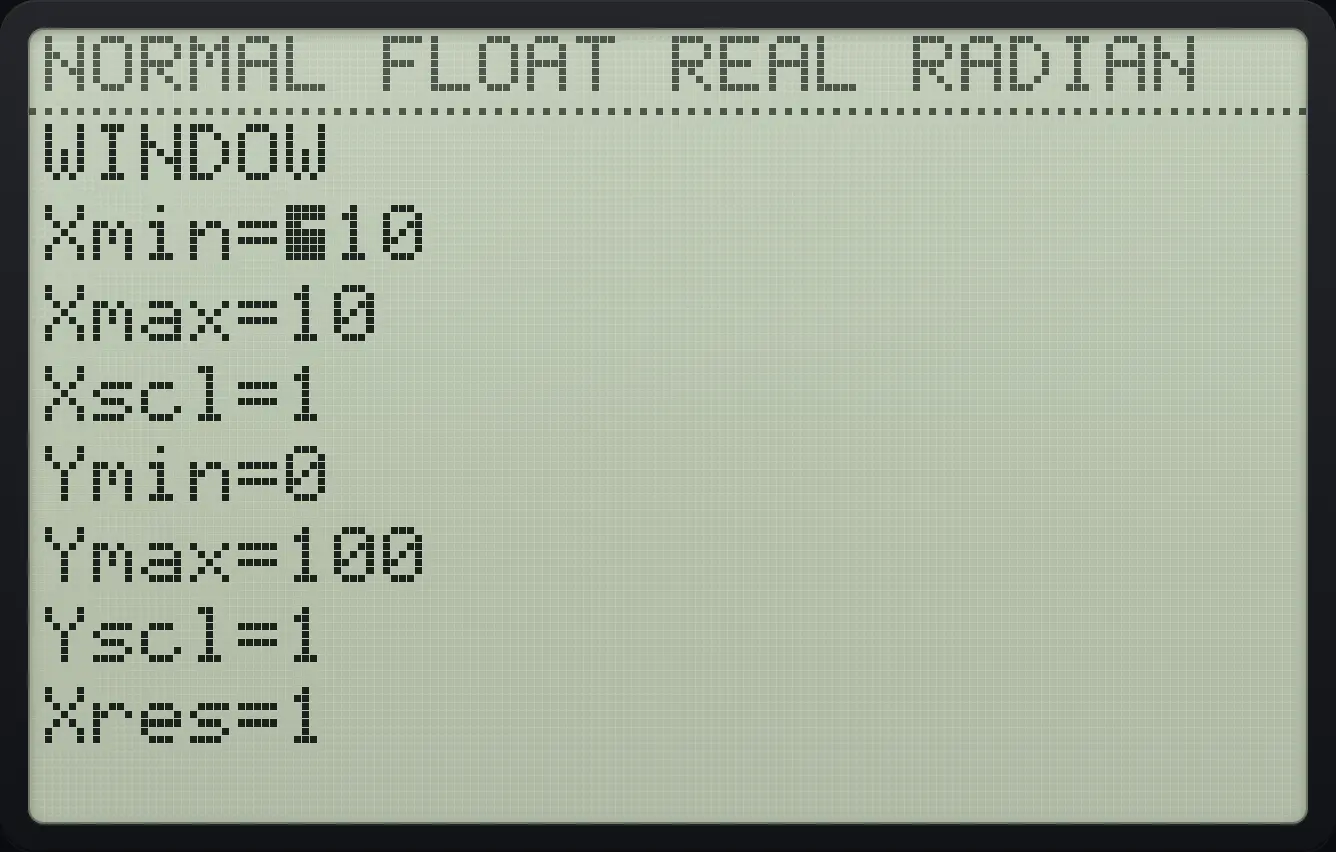
Xmin=⁻109.3Zoom in, zoom out and draw a zoom box#
Zoom In and Zoom Out first show the graph with a free cursor. Move the cursor to the centre you want and press enter; the window is rescaled by a factor of 4 about that point. Press enter again to zoom further. For ZBox, press enter at one corner, move the cursor to the opposite corner and press enter again.
Zoom in about the origin
Press zoom, 2 and enter, then open WINDOW.
zoom2enterwindow
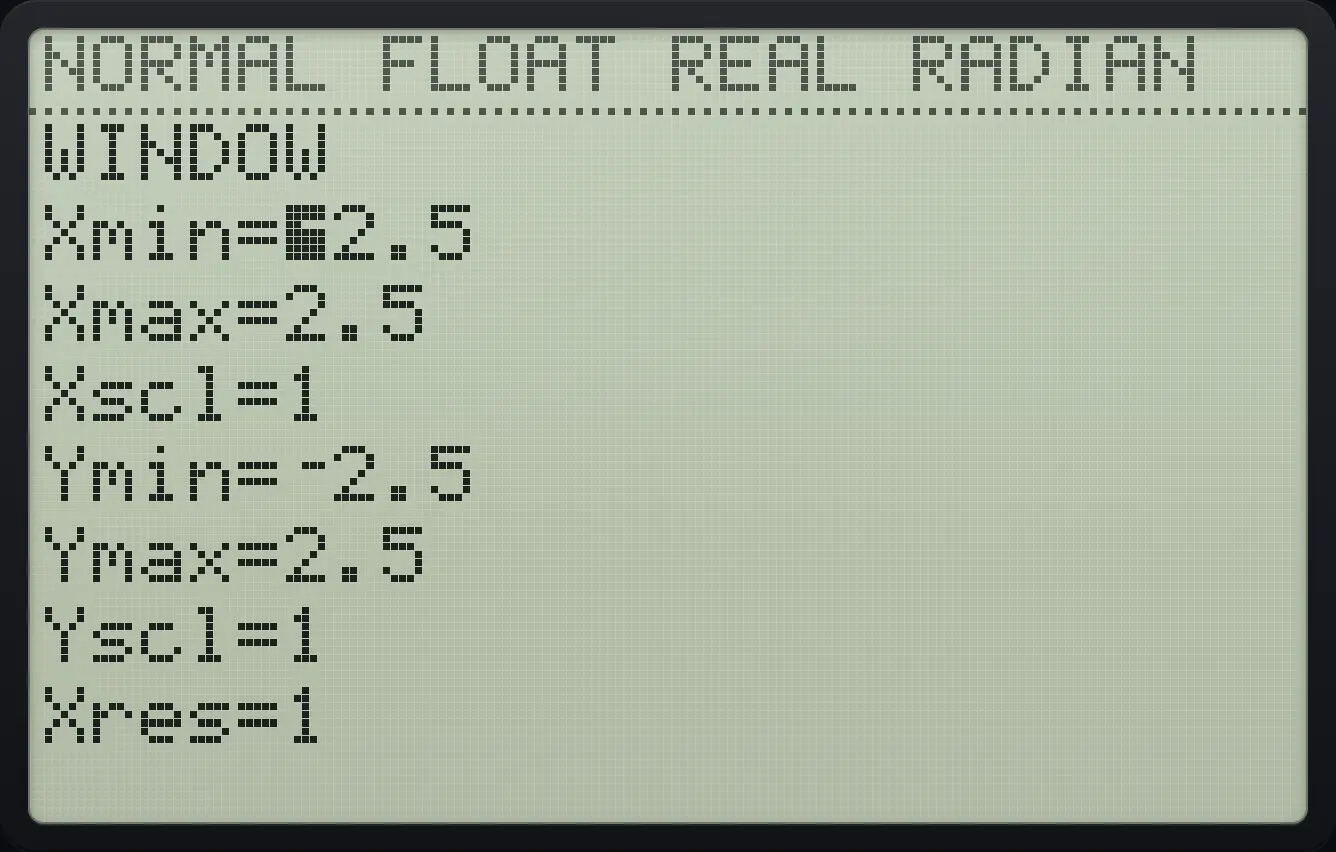
Xmin=⁻2.5 Xmax=2.5Zoom out about the origin
Press zoom, 3 and enter, then open WINDOW.
zoom3enterwindow
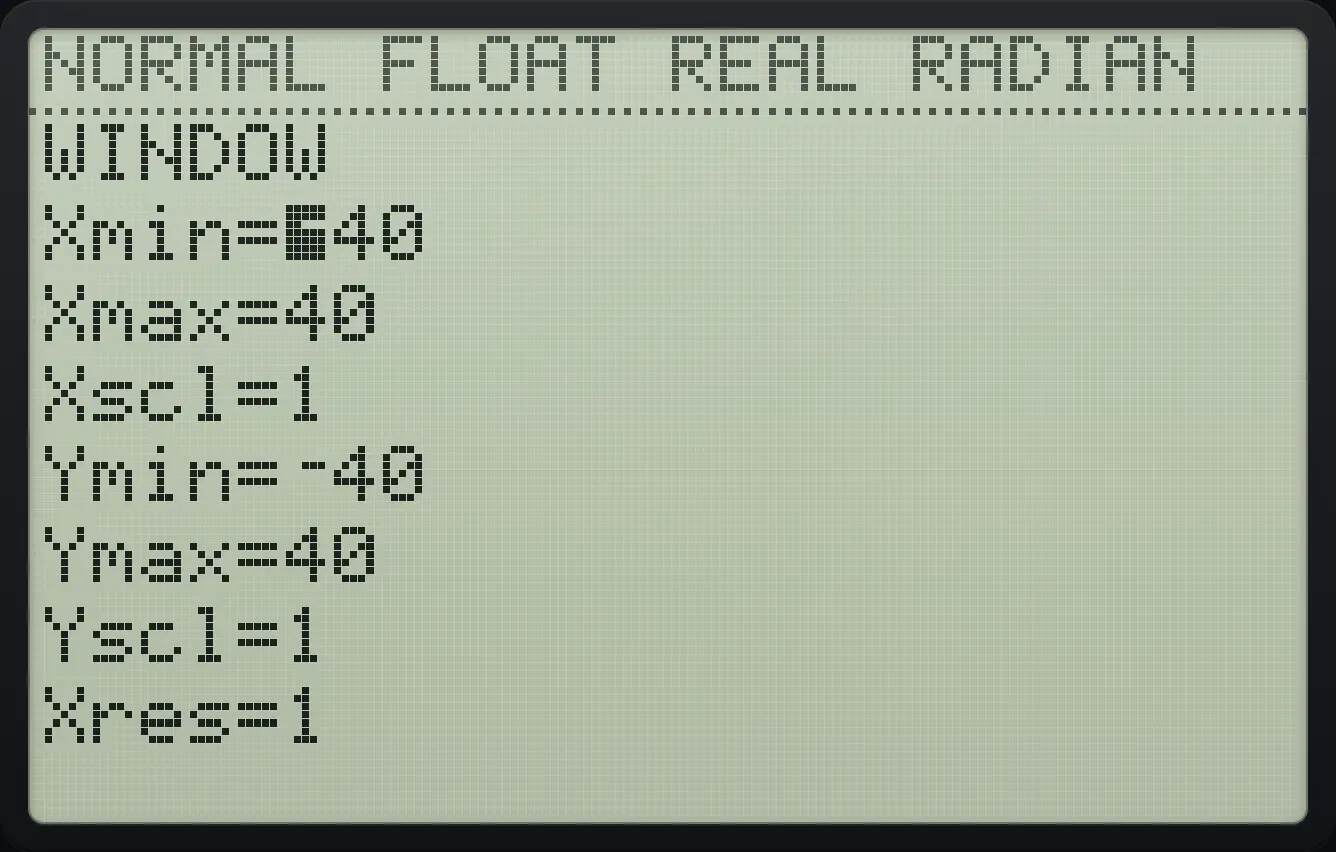
Xmin=⁻40 Xmax=40Draw a zoom box
Press zoom, 1 (ZBox) and enter at the starting corner.
zoom1enter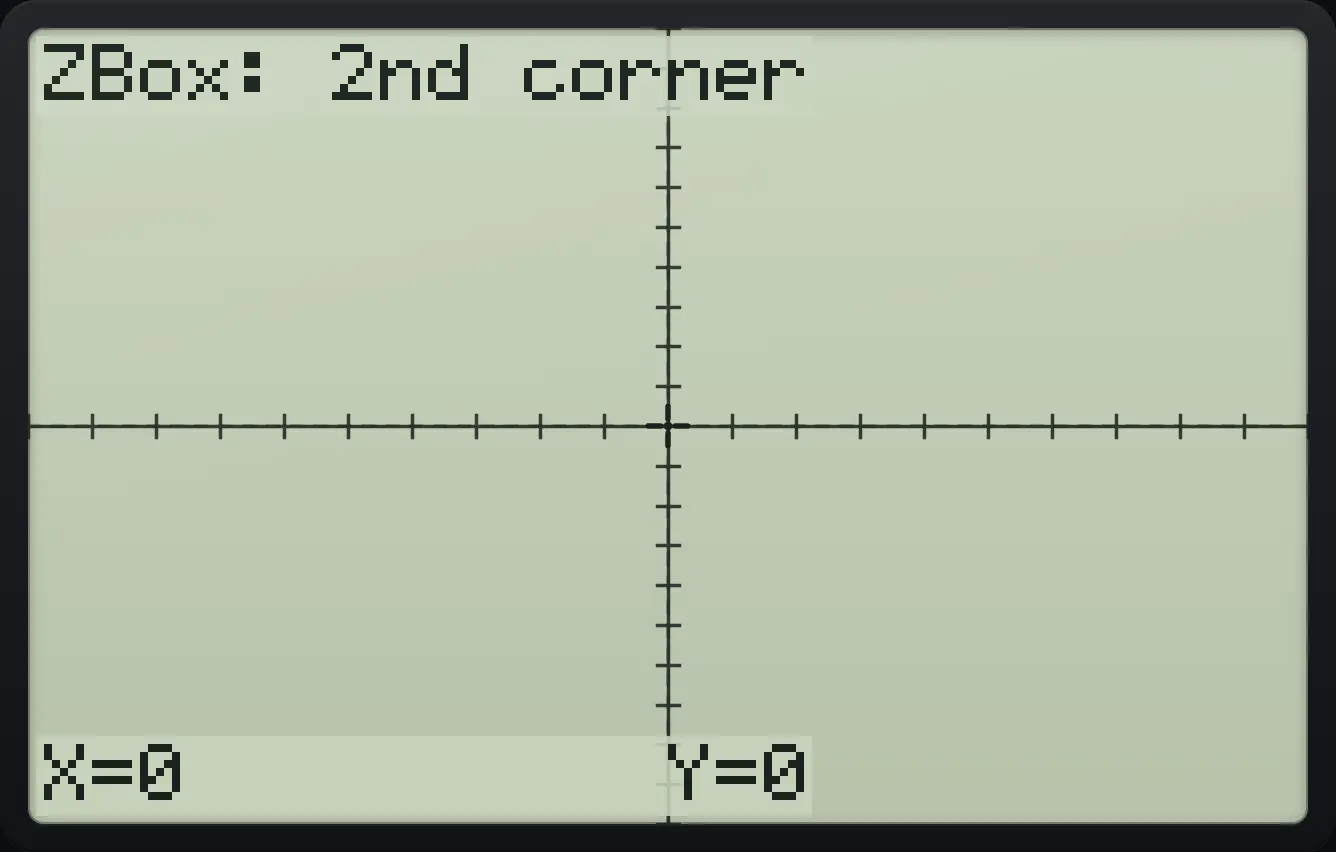
Move the cursor 66 steps right and 41 steps up, then press enter.
▶▶▶▶▶▶▶▶▶▶▶▶▶▶▶▶▶▶▶▶▶▶▶▶▶▶▶▶▶▶▶▶▶▶▶▶▶▶▶▶▶▶▶▶▶▶▶▶▶▶▶▶▶▶▶▶▶▶▶▶▶▶▶▶▶▶▲▲▲▲▲▲▲▲▲▲▲▲▲▲▲▲▲▲▲▲▲▲▲▲▲▲▲▲▲▲▲▲▲▲▲▲▲▲▲▲▲enterwindow
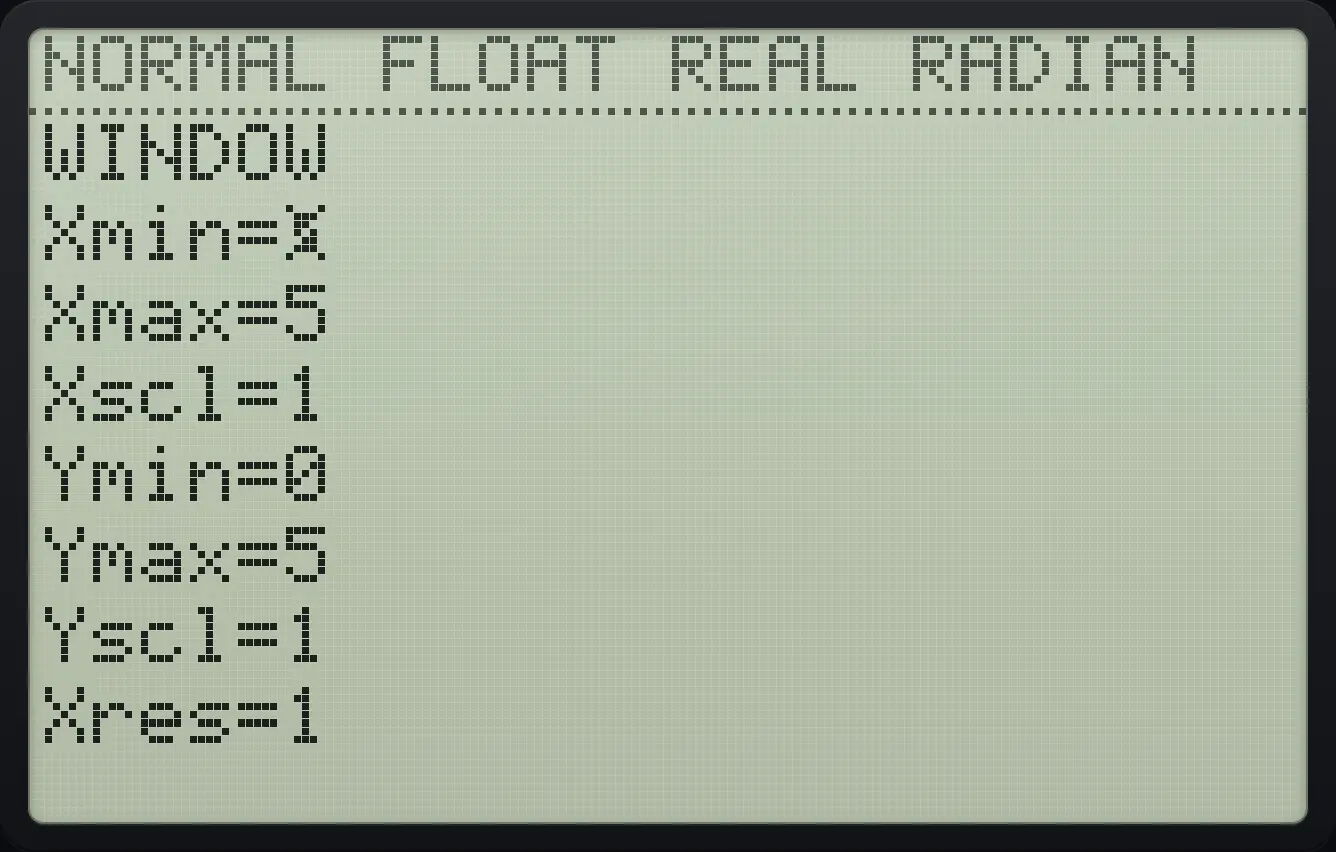
Xmin=0 Xmax=59.4Move the free cursor on a graph#
On a graph screen the arrow keys move a free cursor one pixel at a time and the bottom line shows its coordinates (if CoordOn is set in FORMAT). The pixel width on screen is .
Read the coordinates under the cursor
Press graph then right once.
graph▶
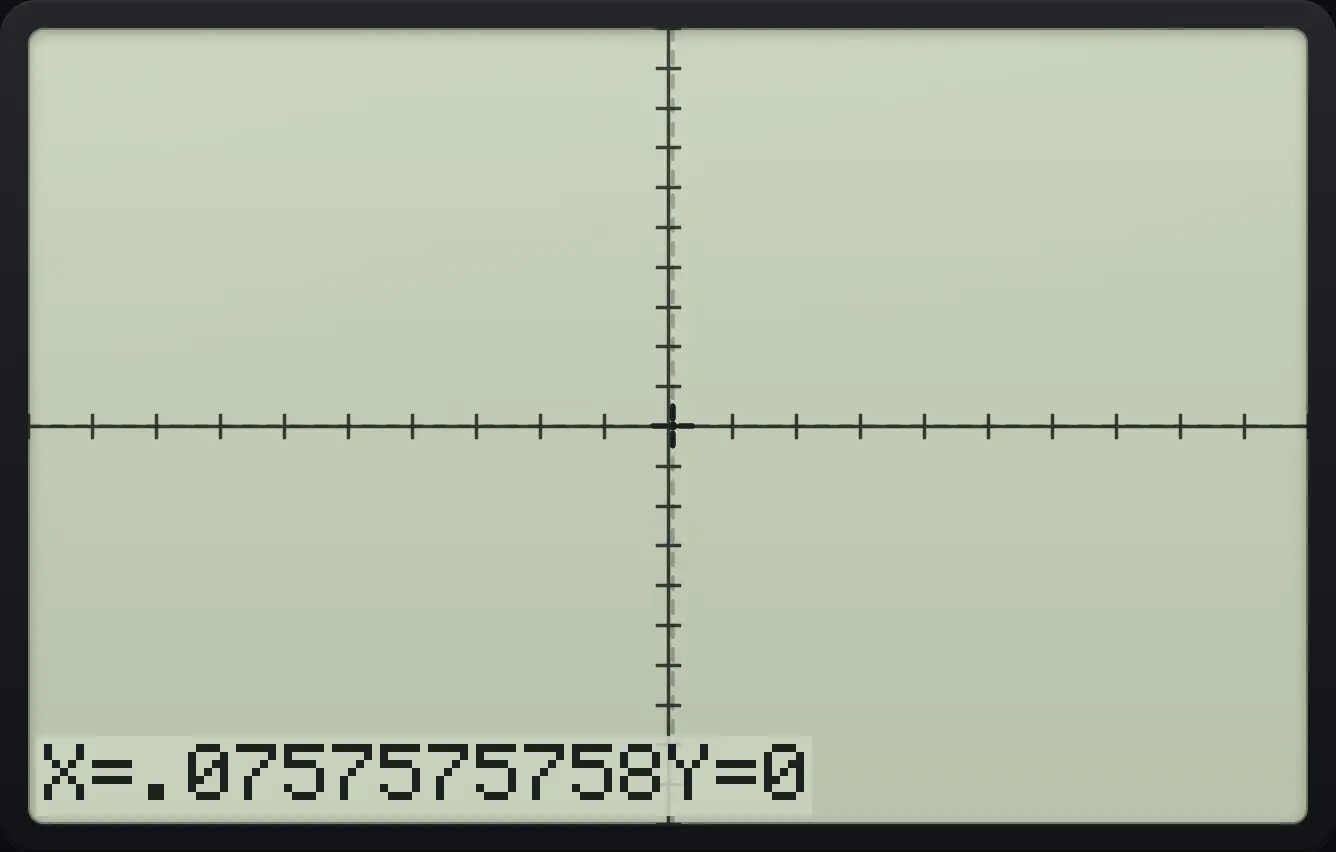
X=.0757575758TI-84 Plus CE is a trademark of Texas Instruments Incorporated. Trident Calculator is an independent product by South View Studios and is not affiliated with, sponsored by or endorsed by Texas Instruments. The name is used only to describe the kind of calculator this model resembles; Trident's names, keys, display, fonts and software are its own clean-room design.