
Classic Graphing 84 manual · Chapter 13 of 25
One- and two-variable statistics
Summarise a list with 1-Var Stats (mean, standard deviation, quartiles), study pairs with 2-Var Stats, and use frequency lists.
13.1Find the mean, standard deviation and quartiles#
Press stat, then ▶ for CALC, then 1 for 1-Var Stats. A small form asks for the list (L1 unless you change it) and an optional frequency list. Move down to Calculate and press enter. The results appear on a scrolling screen; use ▼ to see the rest.
- stat
- ▶ CALC
- 1-Var Stats
- List: L1
- Calculate enter
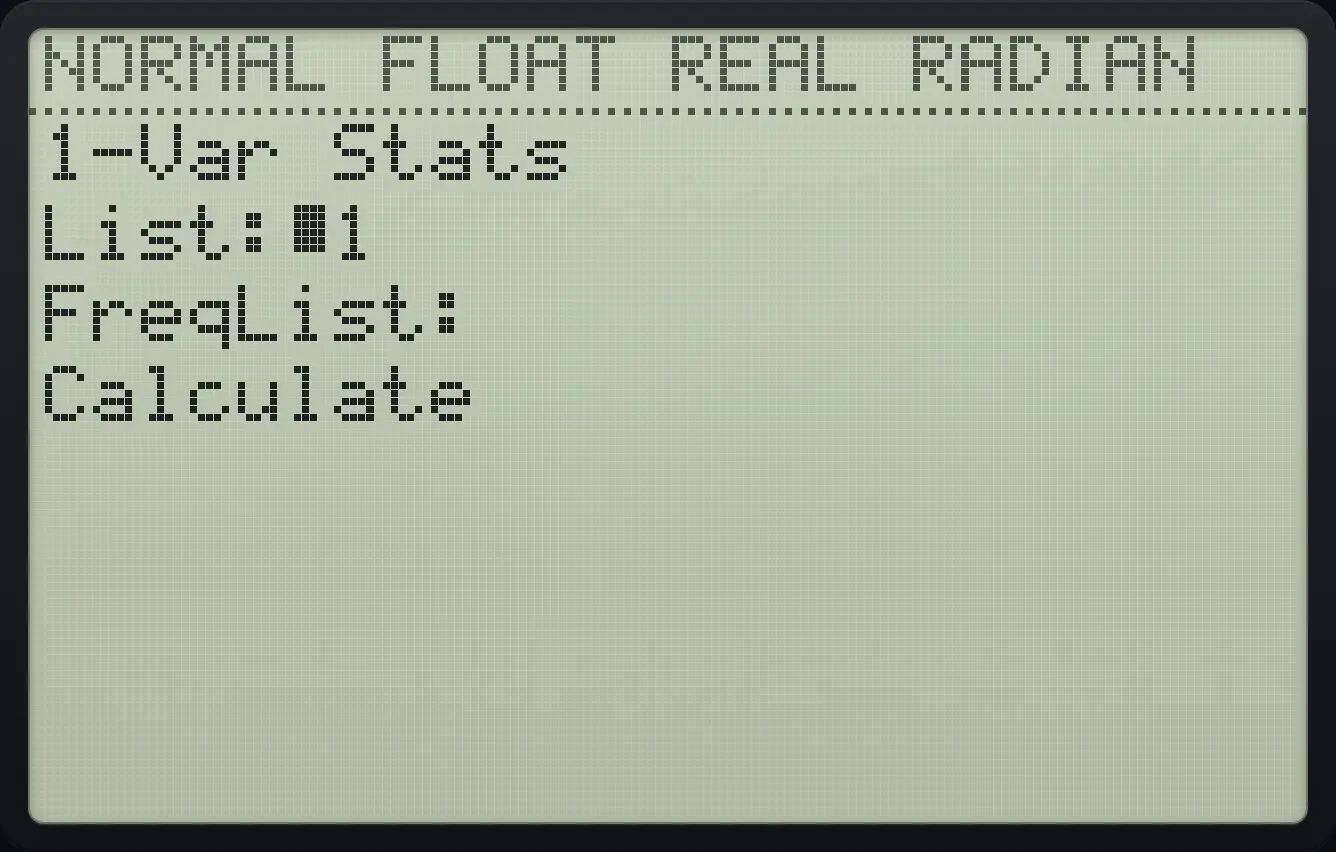
Statistics of 1, 2, 3, 4, 5
Enter the data in L1.
stat11enter2enter3enter4enter5enterOpen 1-Var Stats, move down to Calculate and press enter.
stat▶1▼▼enter
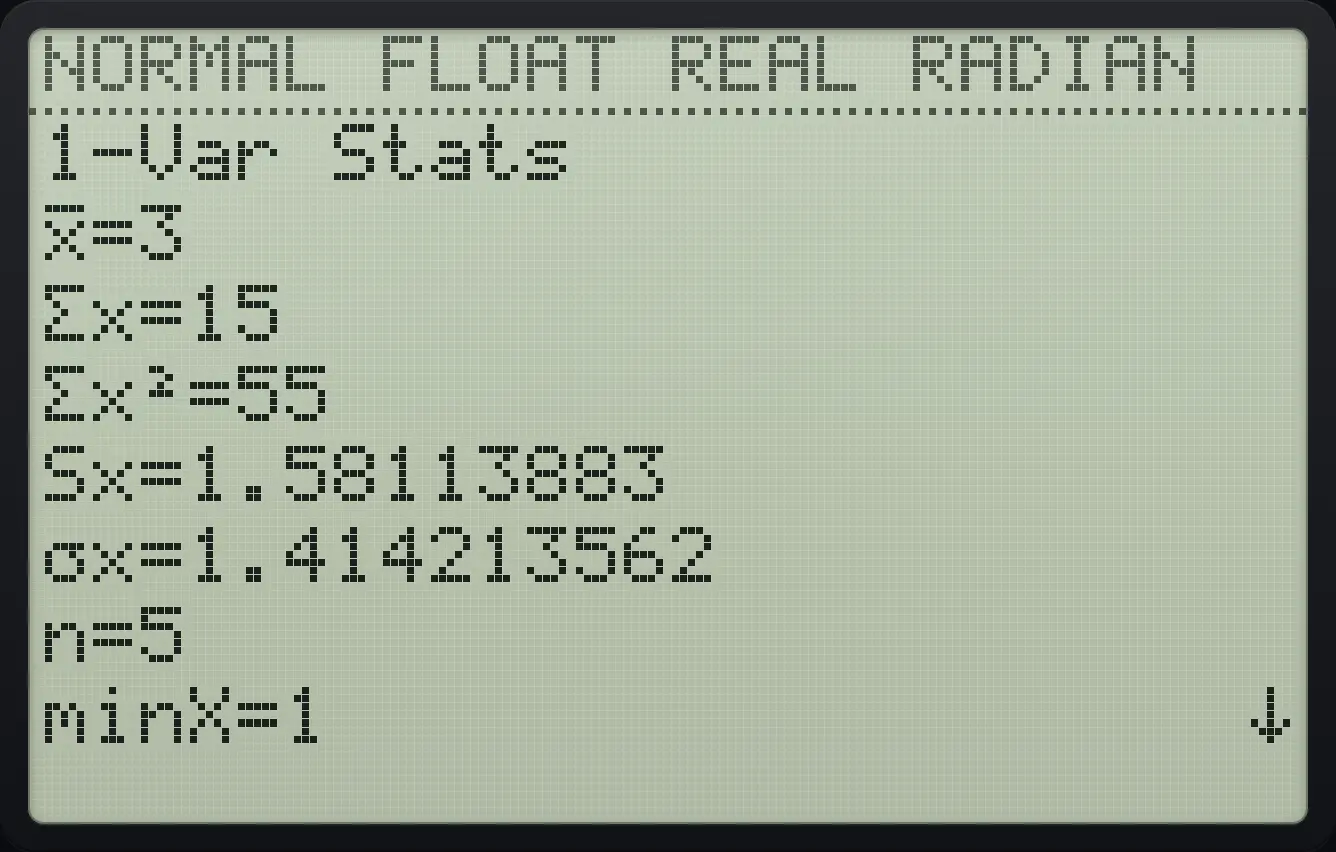
x̄=3 Σx=15 Σx²=55 Sx=1.58113883 σx=1.414213562 n=5Scroll to the quartiles
Press down four more times.
stat11enter2enter3enter4enter5enterstat▶1▼▼enter▼▼▼▼
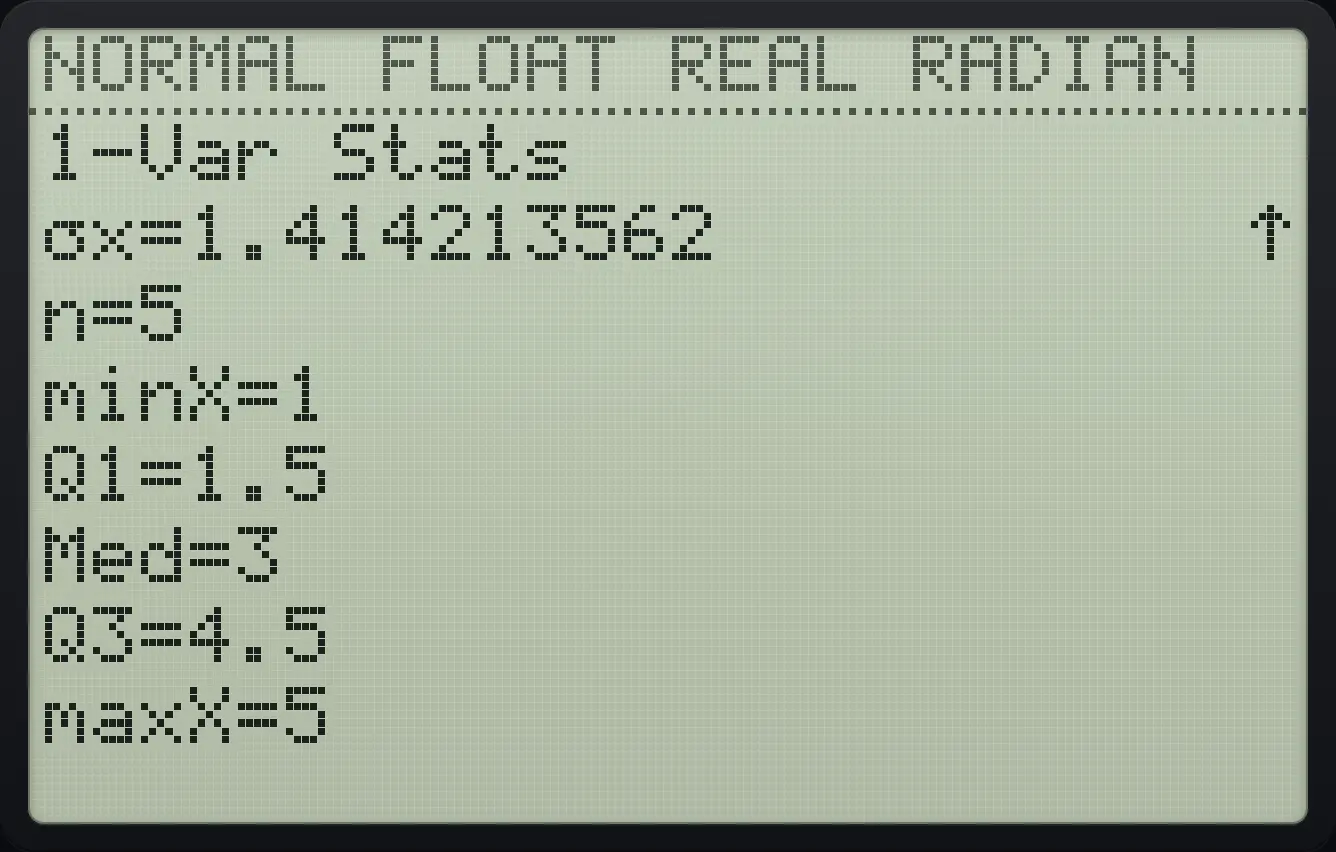
Q1=1.5 Med=3 Q3=4.5 maxX=5The results are stored as statistics variables. Paste them from vars then 5 (Statistics…): for example x̄ is in the XY tab. They stay until the next calculation.
Use the mean on the home screen
Run 1-Var Stats on 1 to 5 and leave with clear.
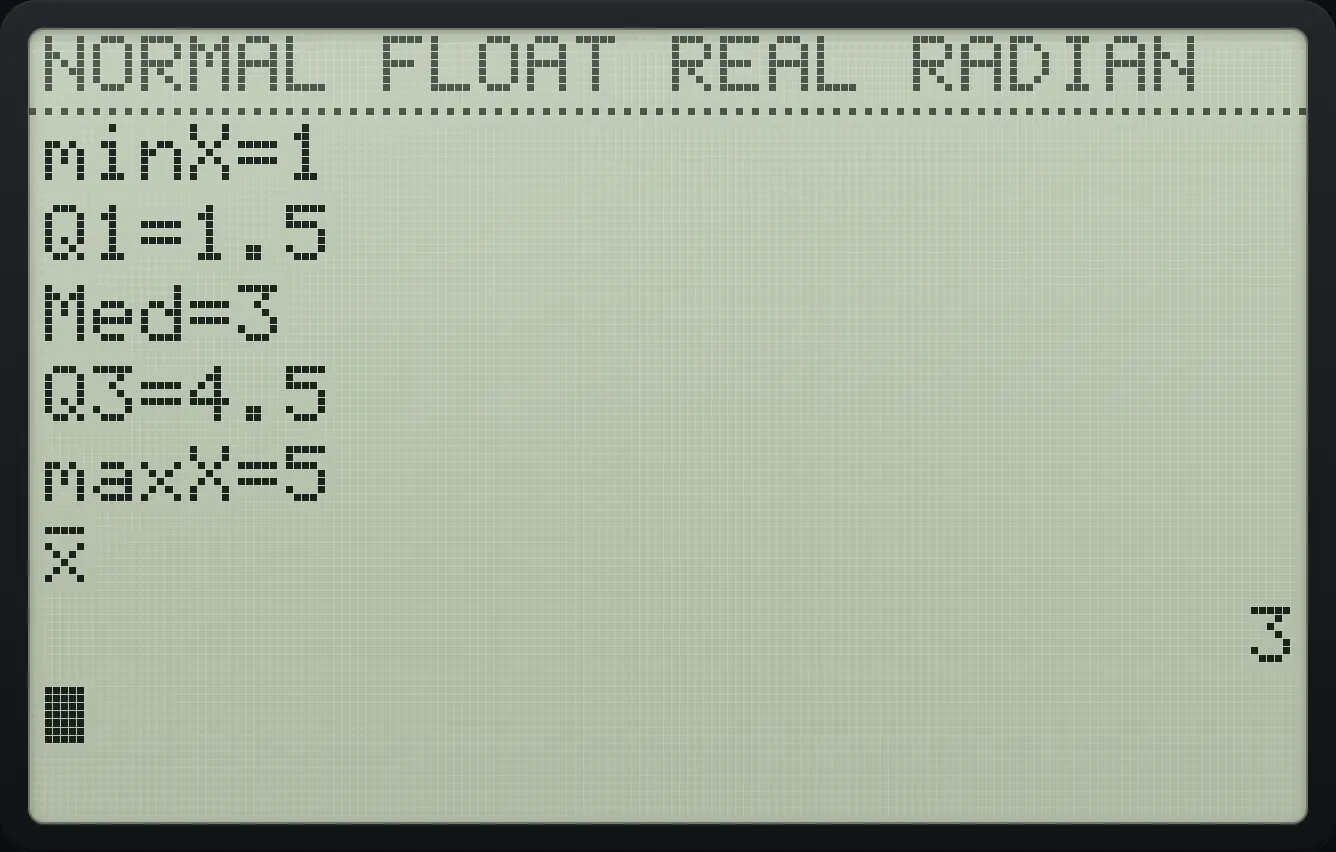
stat11enter2enter3enter4enter5enterstat▶1▼▼enterclearPress vars, 5, 2 (x̄) and enter.
vars52enter
313.2Use a frequency list#
If each value occurs several times, put the values in L1 and how often each occurs in L2, then enter L2 as the FreqList.
Mean with frequencies
L1 = 1, 2 and L2 = 3, 1.
stat11enter2enter▶3enter1enterOpen 1-Var Stats, move down to FreqList, type L2, then down to Calculate and enter.
stat▶1▼2ndL22▼enter
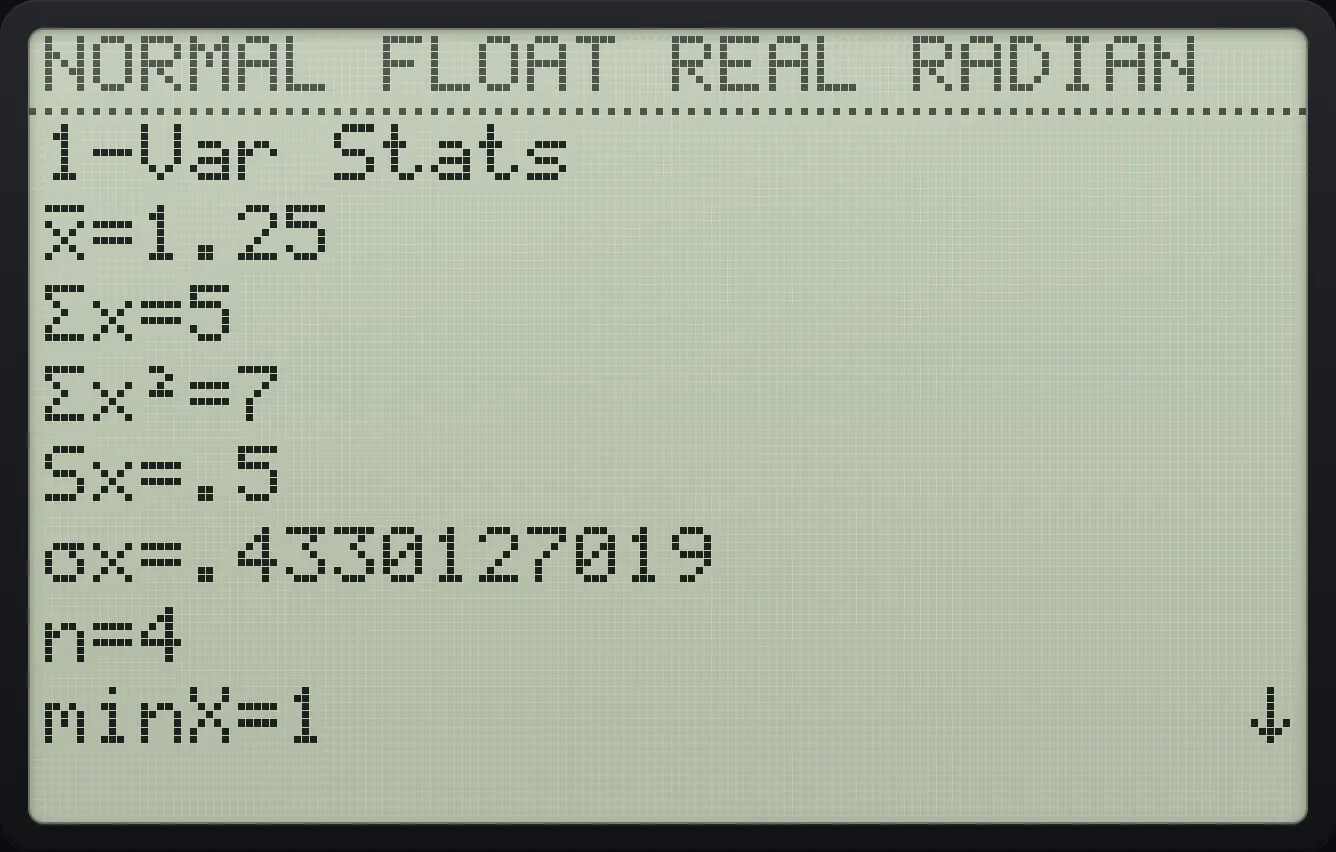
x̄=1.25 n=413.3Statistics for pairs of data (2-Var Stats)#
2-Var Stats uses an Xlist and a Ylist and gives the means, deviations, sums and extremes of both, plus Σxy.
Two lists
L1 = 1, 2, 3 and L2 = 2, 4, 6.
stat11enter2enter3enter▶2enter4enter6enterOpen 2-Var Stats, go down to Calculate and press enter, then scroll down 6 lines.
stat▶2▼▼▼enter▼▼▼▼▼▼
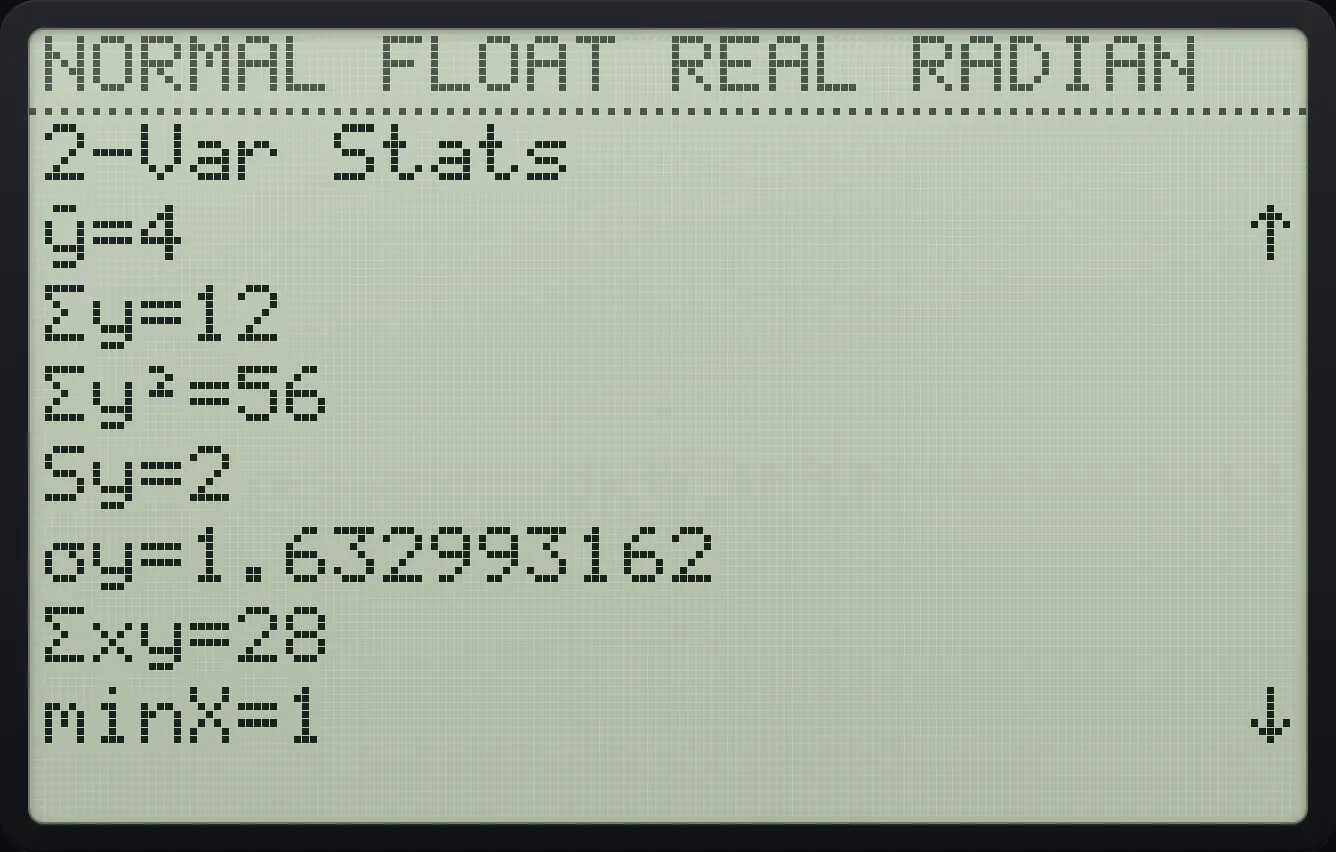
Σxy=28TI-84 Plus CE is a trademark of Texas Instruments Incorporated. Trident Calculator is an independent product by South View Studios and is not affiliated with, sponsored by or endorsed by Texas Instruments. The name is used only to describe the kind of calculator this model resembles; Trident's names, keys, display, fonts and software are its own clean-room design.