
Classic Graphing 84 manual · Chapter 17 of 25
Hypothesis tests and confidence intervals
Z, t, proportion, chi-square, F, regression and ANOVA tests, and the matching confidence intervals, with Data or Stats input.
17.1The TESTS menu#
Press stat then ◀ for the TESTS tab (or ▶ twice). Each item opens a form. Choose Data (use a list) or Stats (type the summary numbers) with Inpt, fill in the fields moving with ▼, and finish on Calculate (or Draw, which also shades the p-value area on a graph).
![The TESTS tab. The display shows: EDIT CALC [TESTS] / 1:Z-Test… / 2:T-Test… / 3:2-SampZTest… / 4:2-SampTTest… / 5:1-PropZTest… / 6:2-PropZTest… / 7↓ZInterval….](/trident/app/help/manual/img/5559787as.webp)
| Item | Test or interval |
|---|---|
| 1 Z-Test | Mean of one sample, σ known |
| 2 T-Test | Mean of one sample, σ unknown |
| 3 2-SampZTest | Two means, σ known |
| 4 2-SampTTest | Two means, σ unknown (pooled or not) |
| 5 1-PropZTest | One proportion |
| 6 2-PropZTest | Two proportions |
| 7 ZInterval | Confidence interval for a mean, σ known |
| 8 TInterval | Confidence interval for a mean, σ unknown |
| 9 2-SampZInt | Interval for a difference of means, σ known |
| 0 2-SampTInt | Interval for a difference of means, σ unknown |
| A 1-PropZInt | Interval for a proportion |
| B 2-PropZInt | Interval for a difference of proportions |
| C χ²-Test | Chi-square test on a matrix (default [A], expected goes to [B]) |
| D χ²GOF-Test | Goodness of fit with Observed and Expected lists and df |
| E 2-SampFTest | Compare two standard deviations |
| F LinRegTTest | Test the slope of a regression line |
| G LinRegTInt | Confidence interval for the slope |
| H ANOVA( | One-way analysis of variance: ANOVA(L1,L2,…) |
The test alternative is chosen on its own row, for example μ: ≠μ0, <μ0 or >μ0. Results are also stored in the statistics variables (p, t, z, df and so on).
17.2Test a mean (T-Test)#
![The T-Test form with Data input. The display shows: T-Test / Inpt:[Data] Stats / μ0:0 / List:L1 / Freq:1 / μ:[≠μ0] <μ0 >μ0 / Calculate Draw.](/trident/app/help/manual/img/8f222b48s.webp)
T-Test from summary numbers
Open T-Test, move right to Stats and press enter. Fill μ0 = 5, x̄ = 5.5, Sx = 1.2, n = 30.
stat◀2▶enter▼5▼5.5▼1.2▼30Move down to Calculate and press enter.
▼▼enter
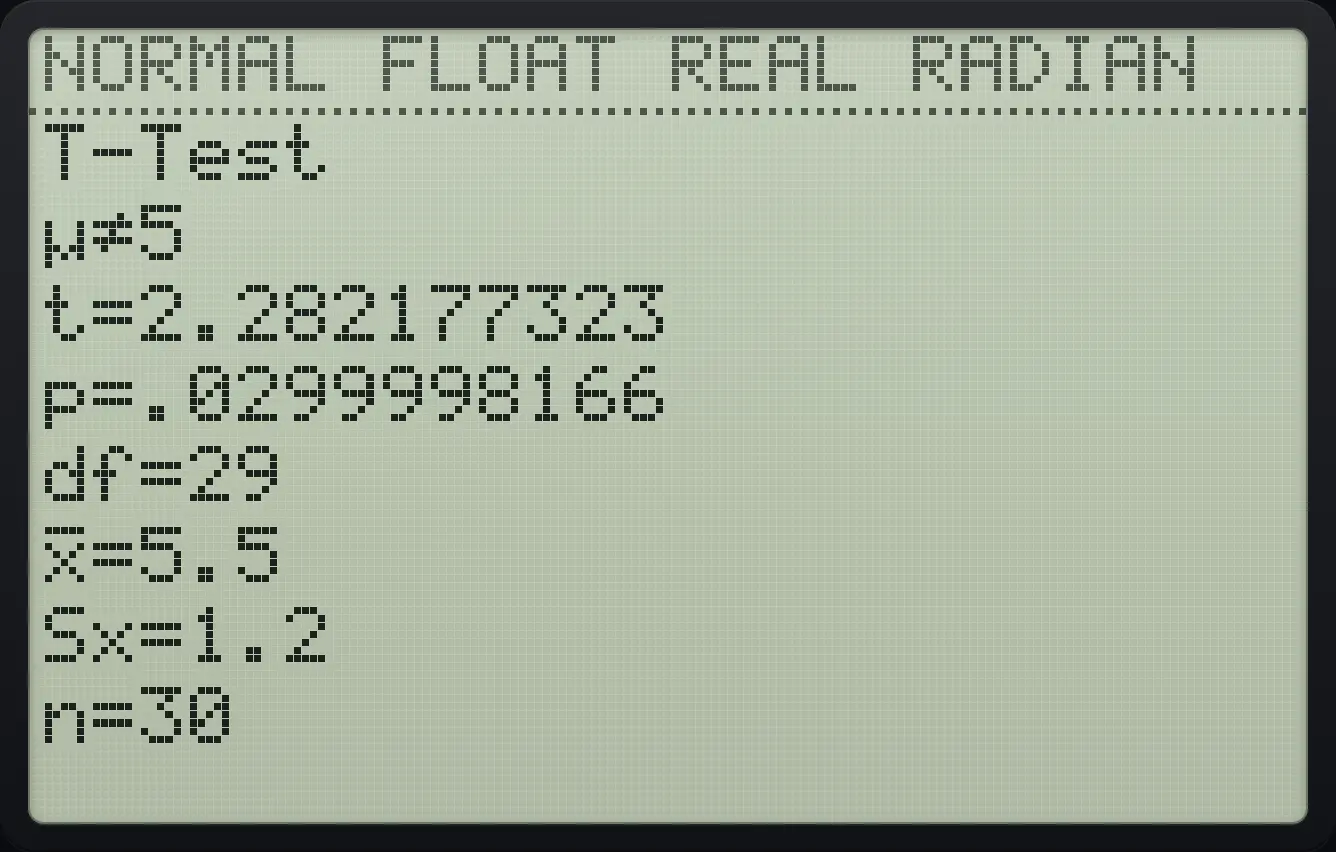
μ≠5 t=2.282177323 p=.0299998166 df=29T-Test on a list, one-sided
L1 = 1 to 5. Open T-Test (Data), μ0 = 2, alternative >μ0.
stat11enter2enter3enter4enter5enterstat◀2▼2▼▼▼▶▶enter▼enter
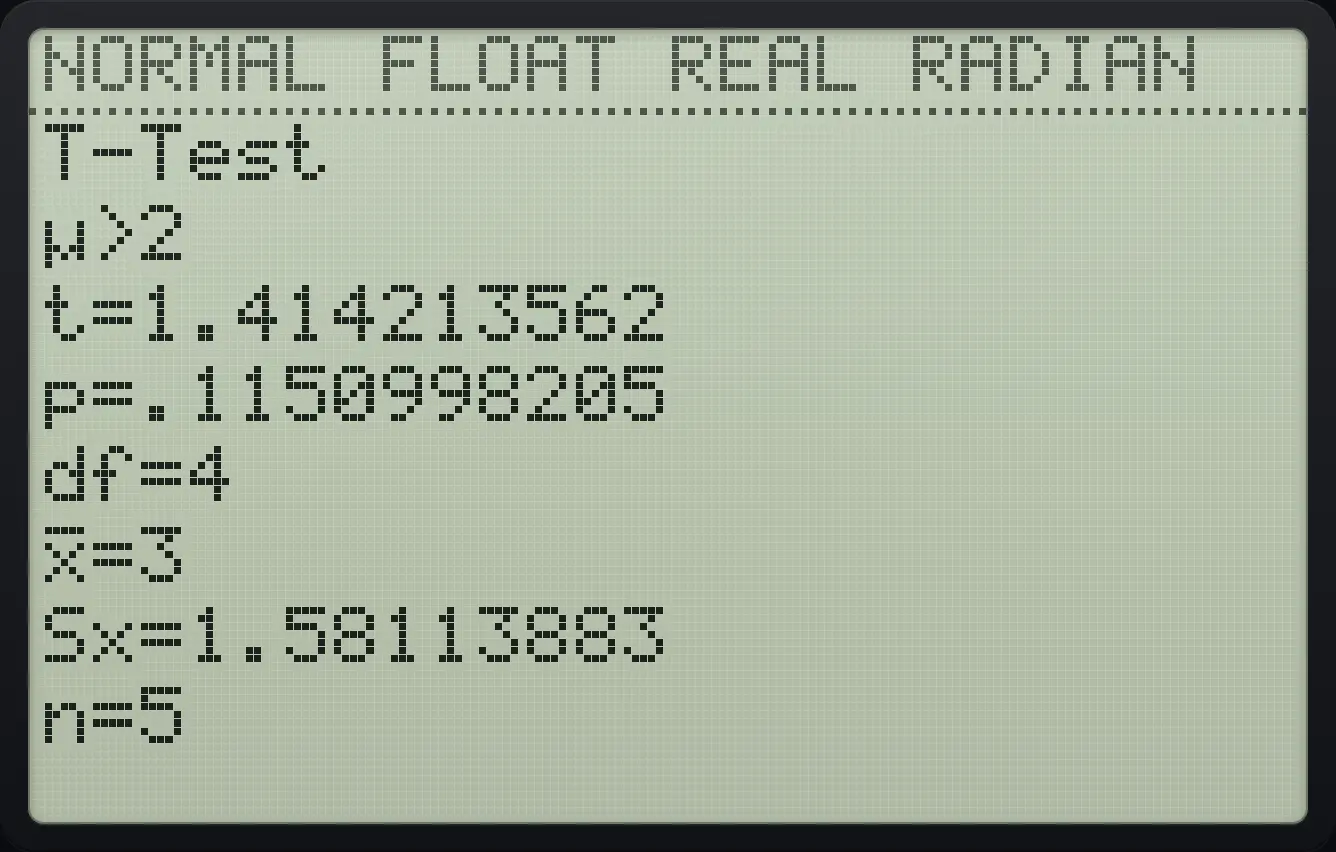
μ>2 t=1.414213562 p=.115099820517.3Test a mean when σ is known (Z-Test)#
Z-Test from summary numbers
Choose Stats; μ0 = 100, σ = 15, x̄ = 105, n = 36; then Calculate.
stat◀1▶enter▼100▼15▼105▼36▼▼enter
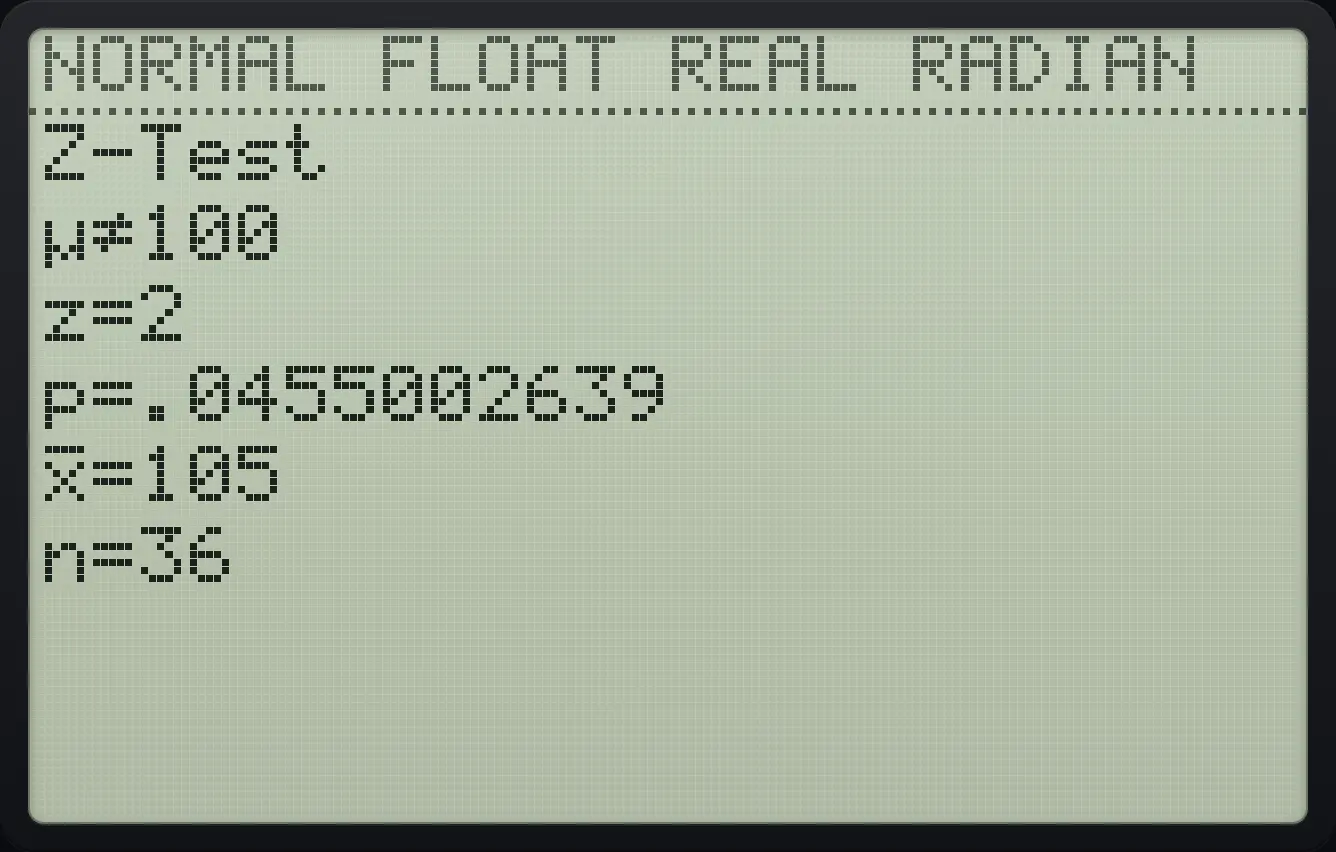
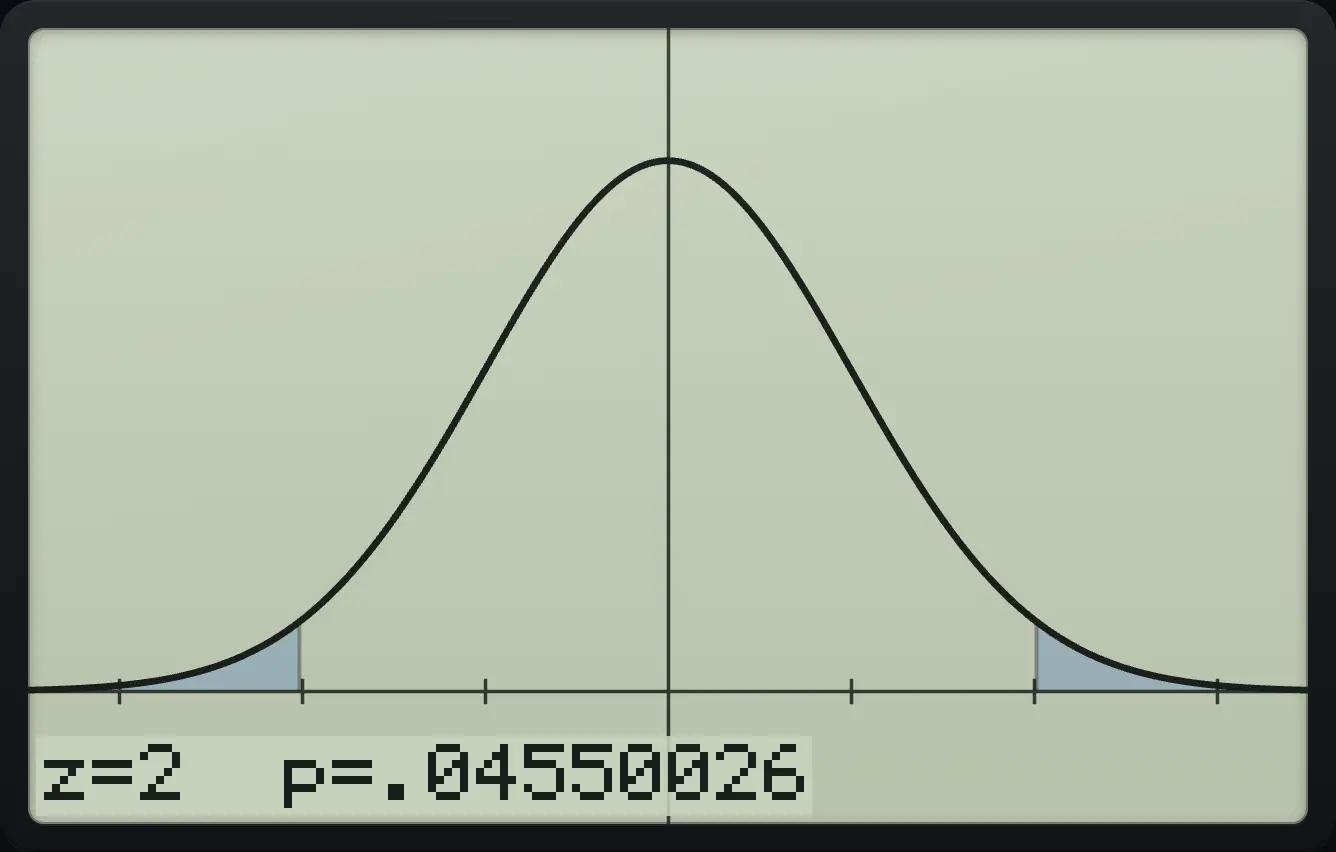
μ≠100 z=2 p=.0455002639Draw the p-value
Same data, but move right to Draw at the bottom and press enter.
stat◀1▶enter▼100▼15▼105▼36▼▼▶enter
z=2 p=.0455002617.4Test a proportion (1-PropZTest)#
60 successes in 100 trials against p0 = 0.5
p0 = .5, x = 60, n = 100, then Calculate.
stat◀5.5▼60▼100▼▼enter
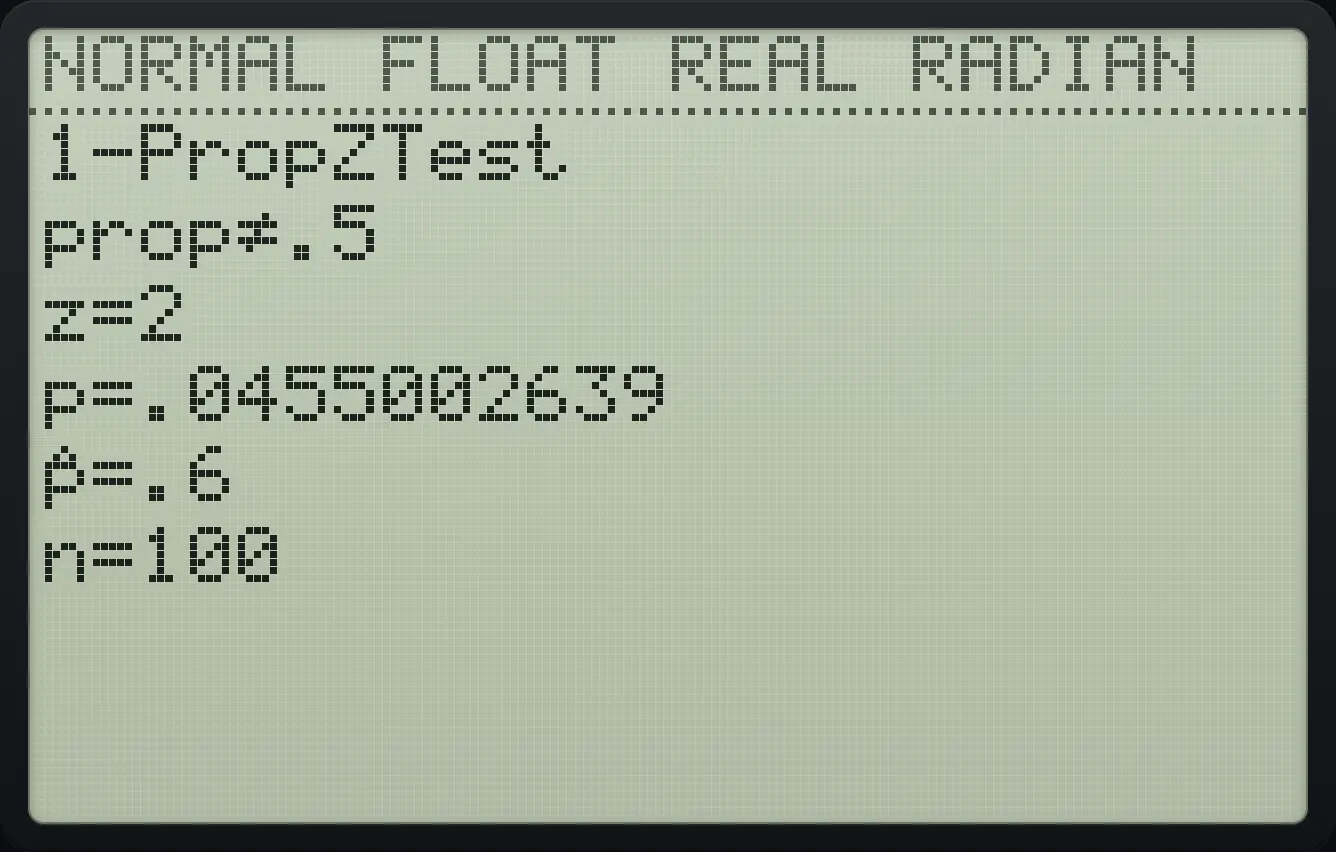
prop≠.5 z=2 p=.0455002639 p̂=.617.5Find a confidence interval#
ZInterval from summary numbers
σ = 15, x̄ = 105, n = 36, C-Level .95 (the default).
stat◀7▶enter▼15▼105▼36▼▼enter
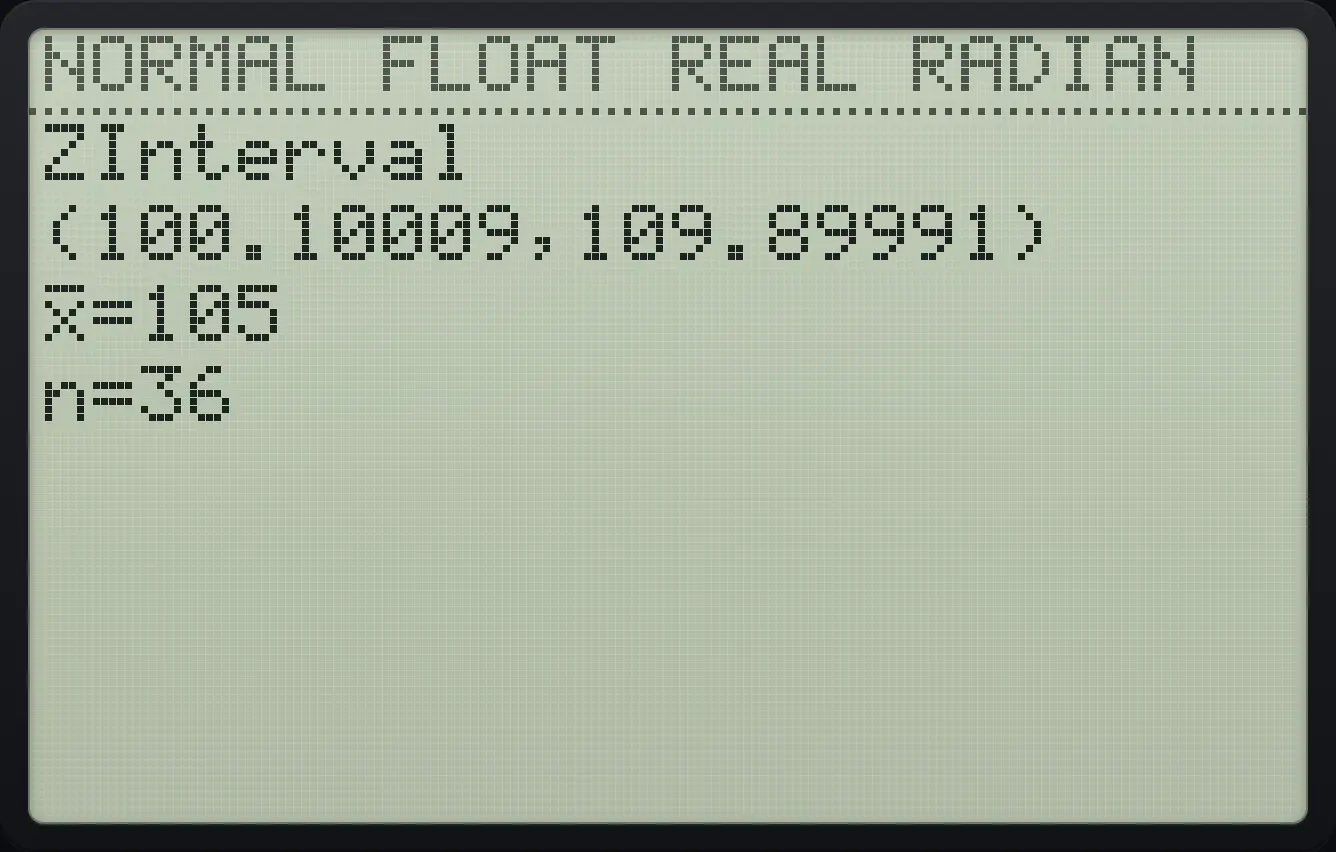
(100.10009,109.89991) x̄=105 n=36TInterval from a list
L1 = 1 to 5, then TInterval with Data: move down four times and press enter.
stat11enter2enter3enter4enter5enterstat◀8▼▼▼▼enter
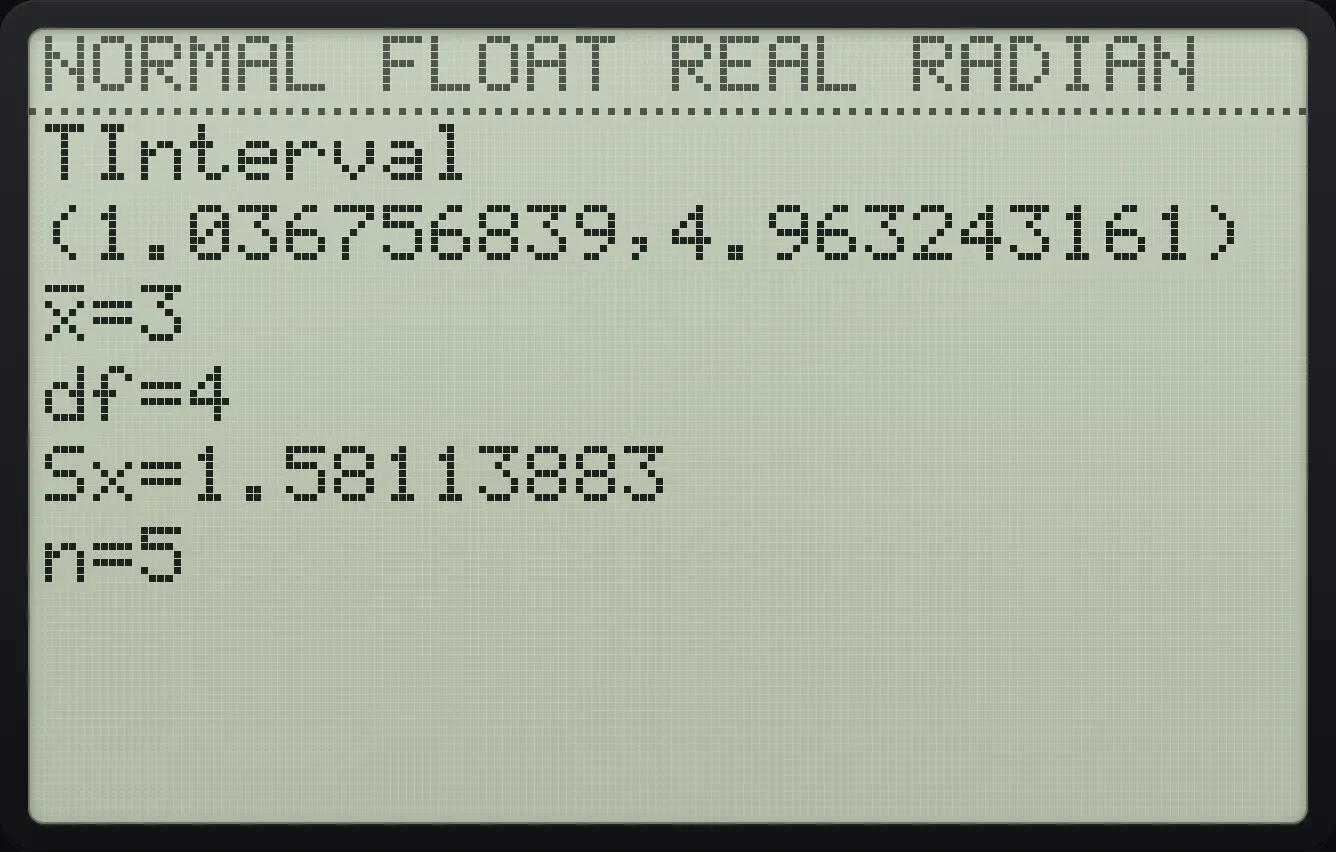
(1.036756839,4.963243161) df=417.6Chi-square tests and ANOVA#
Goodness of fit
L1 = 10, 20, 30 (observed), L2 = 20, 20, 20 (expected). Press stat, left, alpha inv (D), move down twice, type 2 for df, down, enter.
stat110enter20enter30enter▶20enter20enter20enterstat◀alphaDx⁻¹▼▼2▼enter
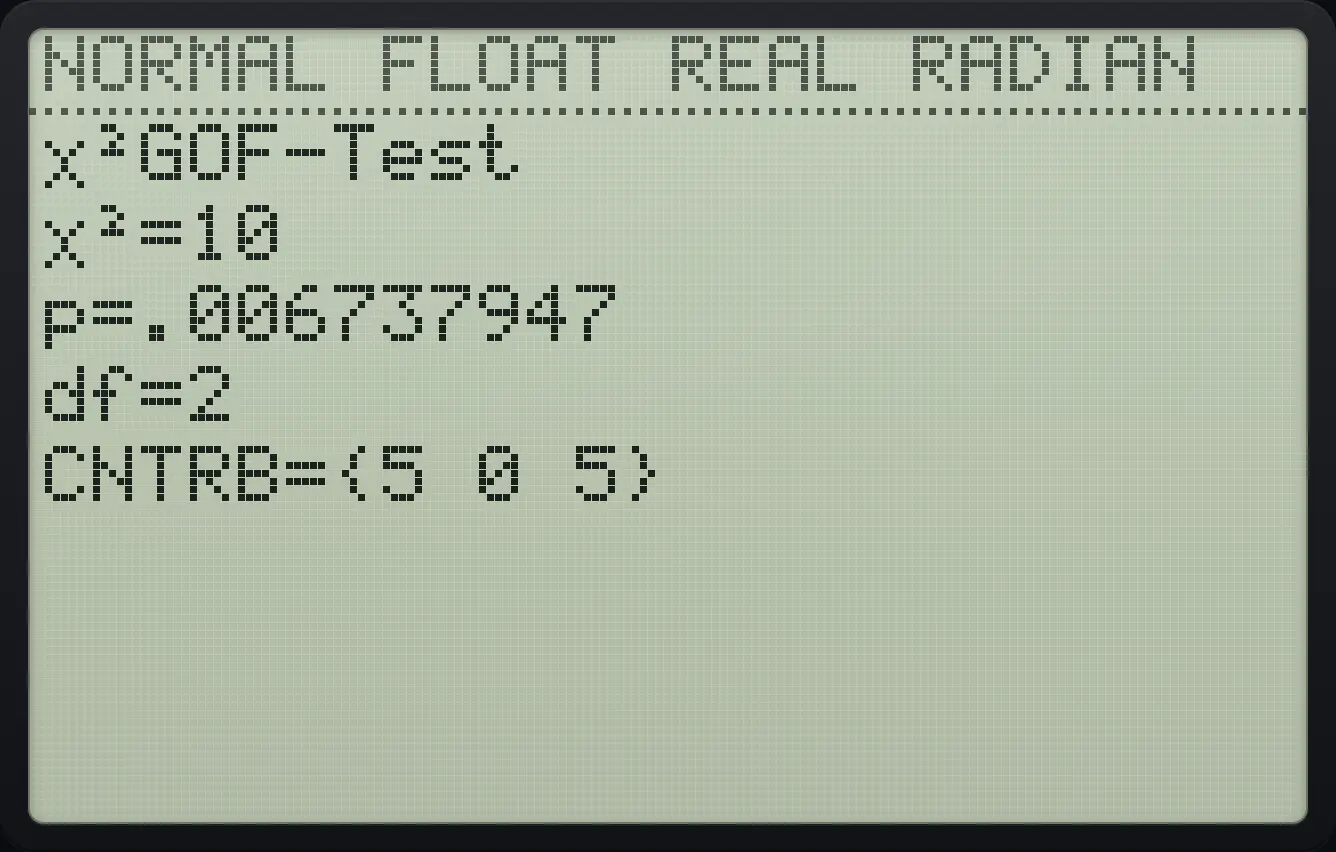
χ²=10 p=.006737947 df=2 CNTRB={5 0 5}Chi-square test on a table
Store [[10,20][30,40]] in [A], then choose χ²-Test (alpha prgm, C) and Calculate.
2nd[×2nd[×10,202nd]−2nd[×30,402nd]−2nd]−sto→2ndMATRIXx⁻¹1enterstat◀alphaCprgm▼▼enter
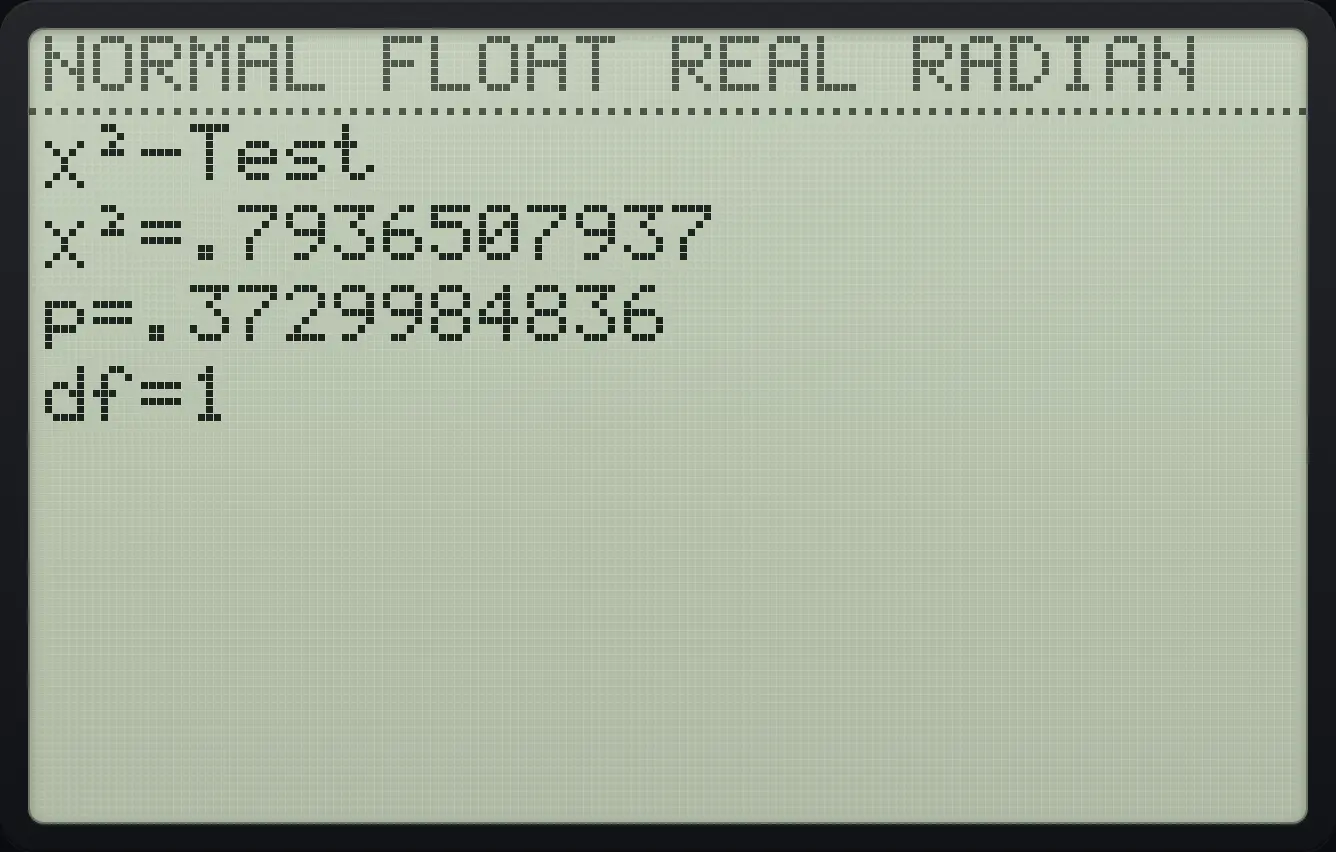
χ²-Test χ²=.7936507937One-way ANOVA
Store {1,2,3} in L1 and {4,5,6} in L2. Choose ANOVA( (alpha pow, H), type L1,L2) and press enter.
2nd{(1,2,32nd})sto→2ndL11enter2nd{(4,5,62nd})sto→2ndL22enterstat◀alphaH^2ndL11,2ndL22)enter
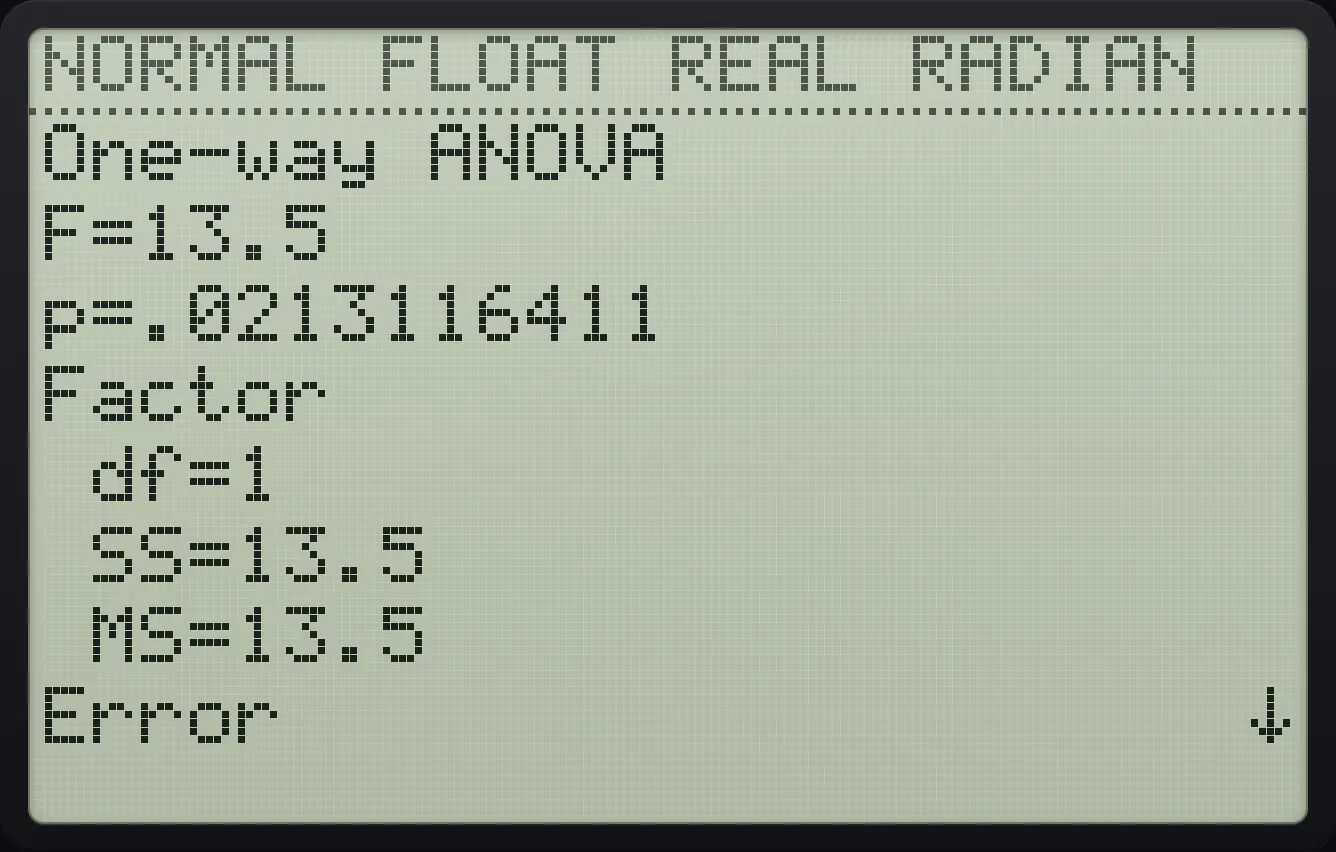
One-way ANOVA F=13.5A test result is kept in p
Run the 1-PropZTest above and leave with clear.
stat◀5.5▼60▼100▼▼enterclearPress vars, 5, left, left (TEST tab), 1 (p) and enter.
vars5◀◀1enter
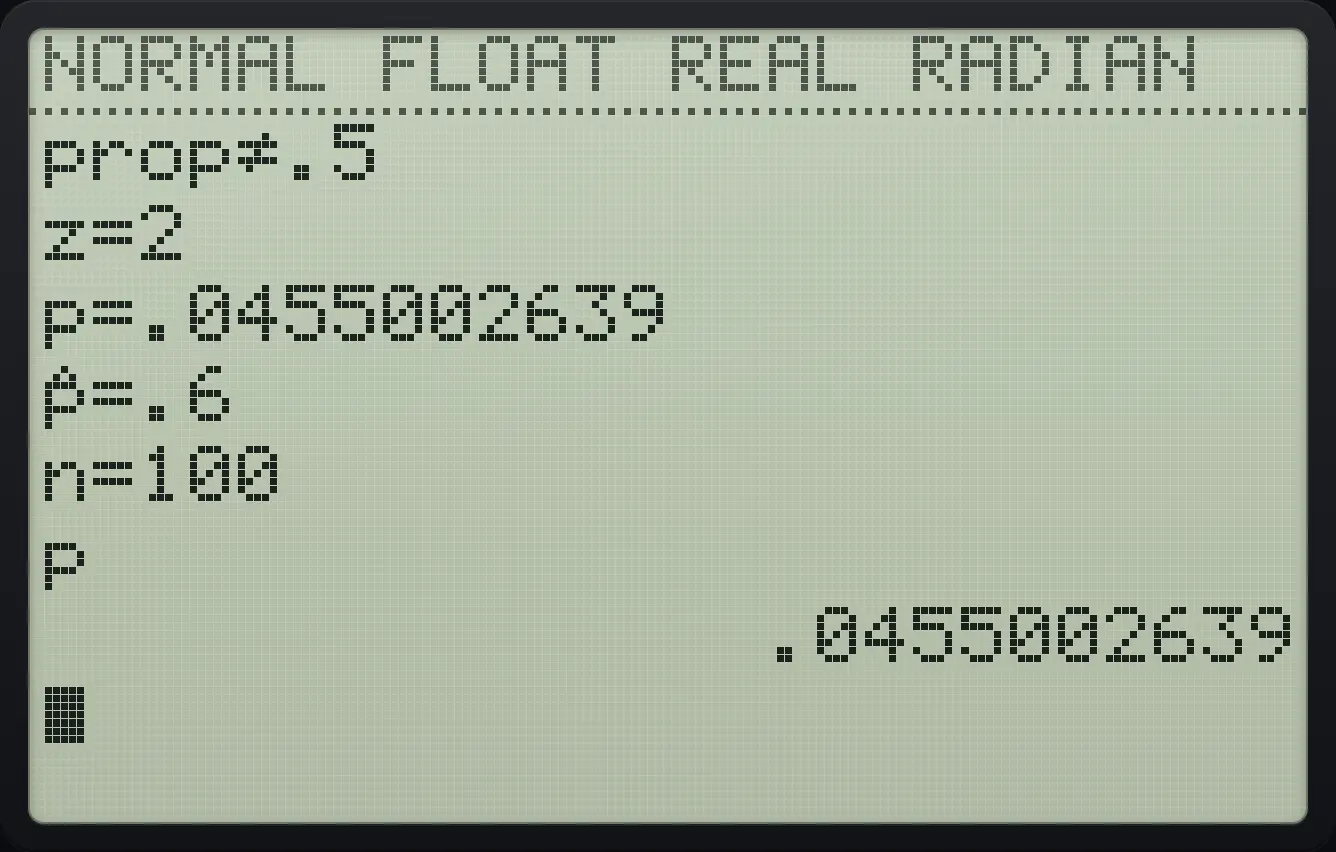
.0455002639TI-84 Plus CE is a trademark of Texas Instruments Incorporated. Trident Calculator is an independent product by South View Studios and is not affiliated with, sponsored by or endorsed by Texas Instruments. The name is used only to describe the kind of calculator this model resembles; Trident's names, keys, display, fonts and software are its own clean-room design.