
Classic Graphing 84 manual · Chapter 16 of 25
Probability distributions
Normal, t, chi-square, F, binomial, Poisson and geometric probabilities, inverse normal and t, and shading areas on a graph.
16.1The DISTR menu#
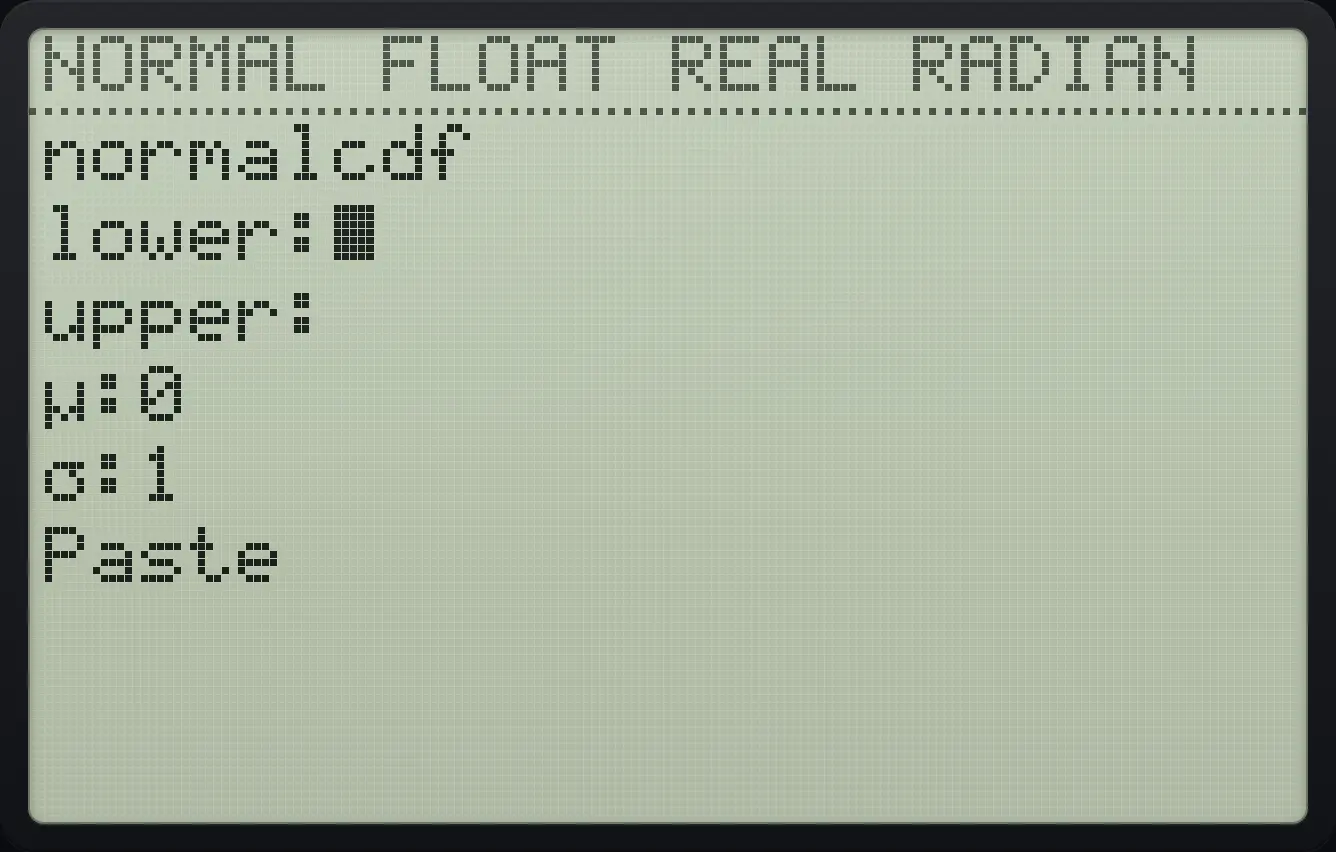
Press 2ndDISTRvars. The DISTR tab lists the distributions; the DRAW tab shades areas. Choosing a function opens a small form, where you fill the fields (use ▼ to move) and finish on Paste, which writes the finished command on the home screen. Press enter again to get the answer. Entries are remembered for next time.
![The DISTR menu. The display shows: [DISTR] DRAW / 1:normalpdf( / 2:normalcdf( / 3:invNorm( / 4:invT( / 5:tpdf( / 6:tcdf( / 7↓χ²pdf(.](/trident/app/help/manual/img/ef196893s.webp)
| Item | Command | Gives |
|---|---|---|
| 1 | normalpdf( | Height of the normal curve at x |
| 2 | normalcdf( | Probability between lower and upper (normal) |
| 3 | invNorm( | The x for a given left-tail area; Tail LEFT, CENTER or RIGHT |
| 4 | invT( | The t for a given left-tail area |
| 5, 6 | tpdf(, tcdf( | Student t curve height and probability |
| 7, 8 | χ²pdf(, χ²cdf( | Chi-square curve height and probability |
| 9, 0 | Fpdf(, Fcdf( | F curve height and probability |
| A, B | binompdf(, binomcdf( | Exactly x successes, and x or fewer |
| C, D | poissonpdf(, poissoncdf( | Exactly x events, and x or fewer |
| E, F | geometpdf(, geometcdf( | First success on trial x, and by trial x |
16.2Find a normal probability#
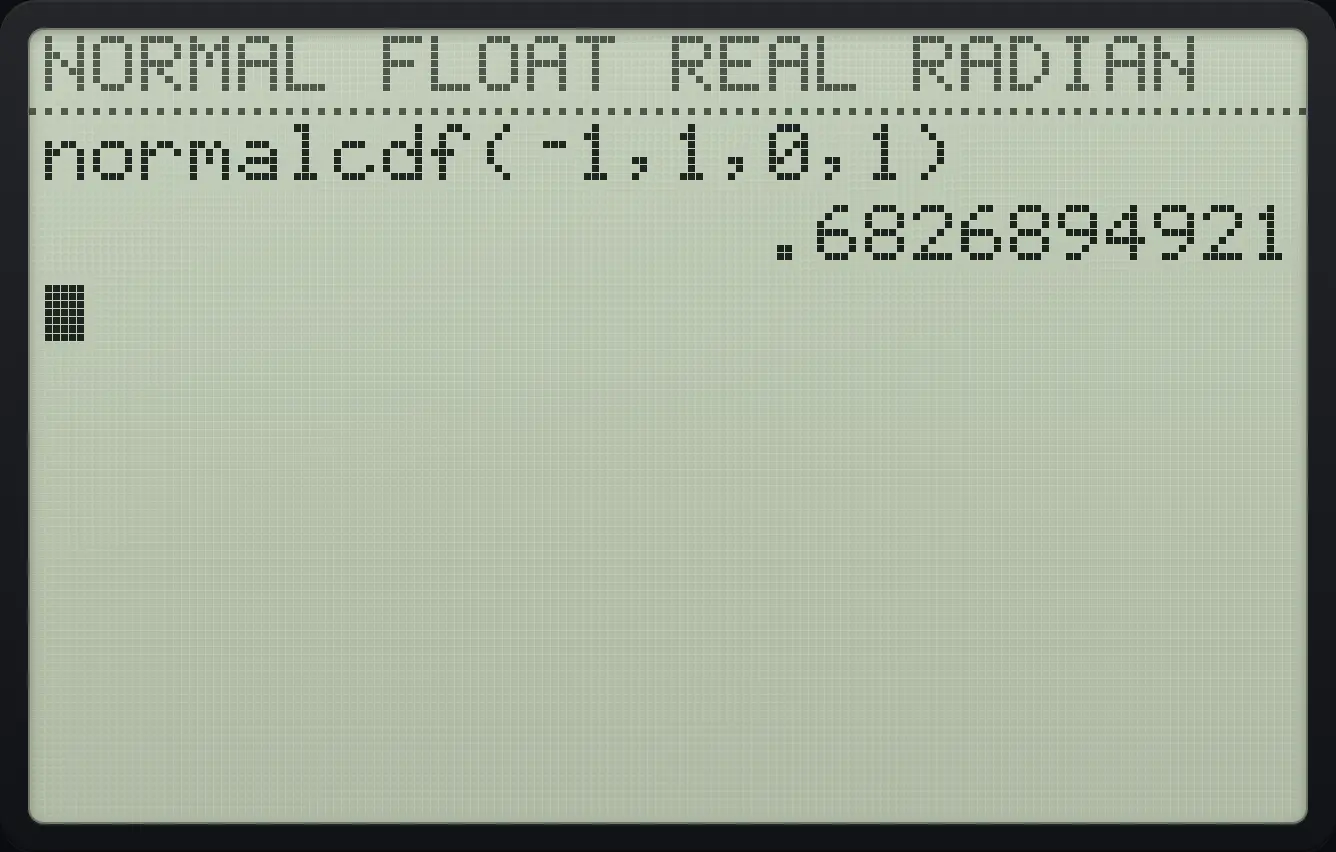
Within one standard deviation
Open DISTR item 2, type −1 for lower, down, 1 for upper, then down three times to Paste and press enter.
2ndDISTRvars2(−)1▼1▼▼▼enterPress enter to calculate the pasted command.
enter
normalcdf(⁻1,1,0,1) .6826894921Below 130 when the mean is 100 and sd 15
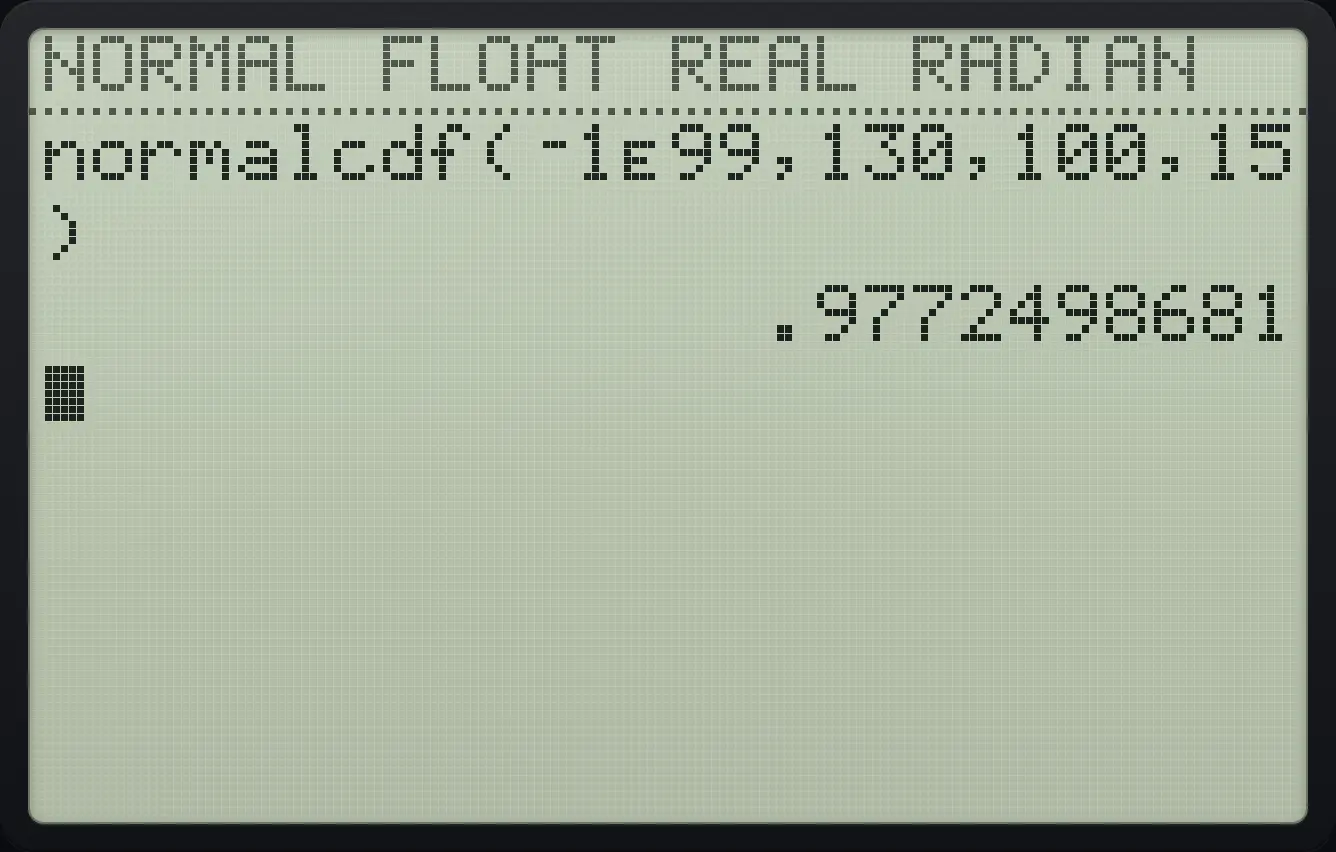
Use lower −1ᴇ99 (a huge negative number), upper 130, μ 100, σ 15.
2ndDISTRvars2(−)12ndEE,99▼130▼100▼15▼enterenter
.9772498681Height of the standard normal curve at 0
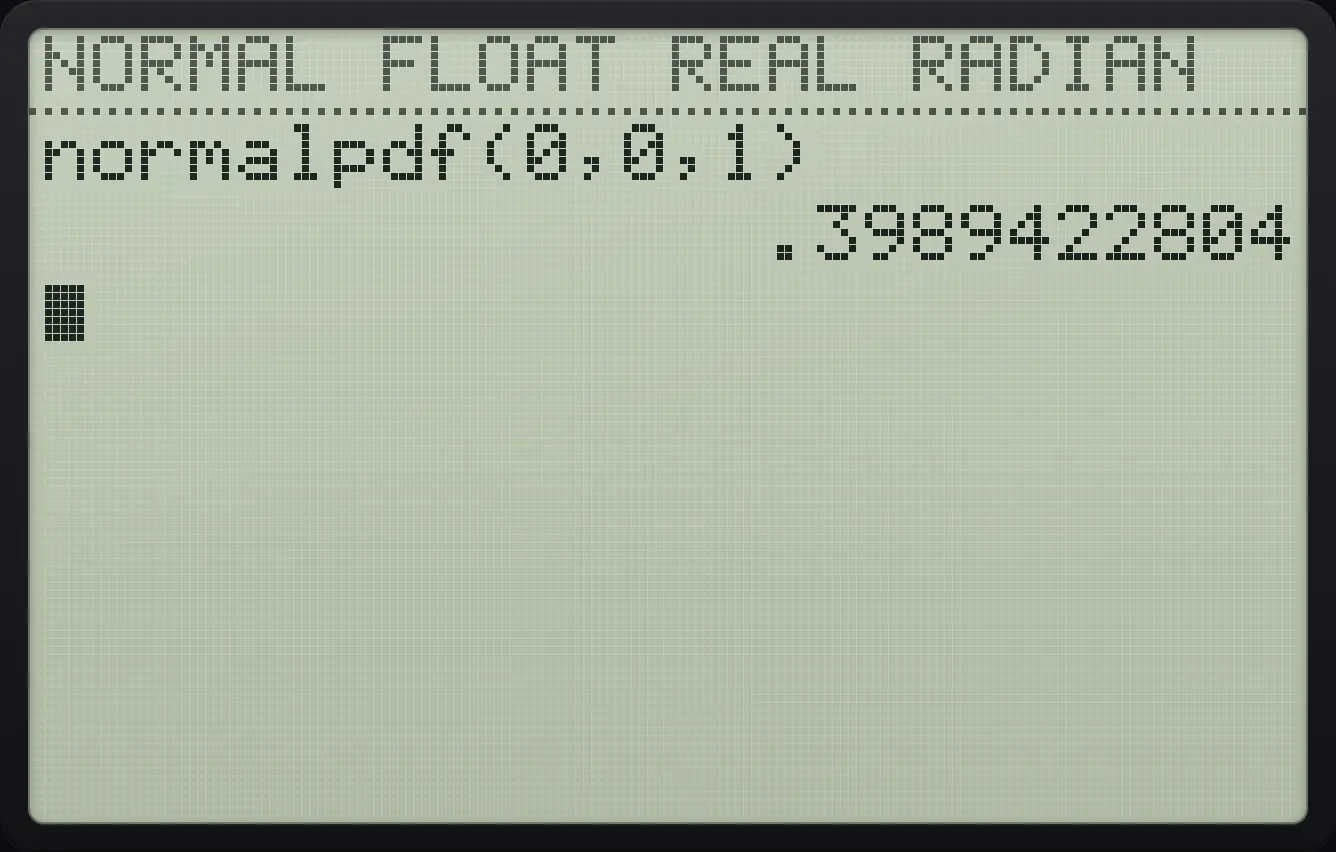
DISTR item 1, type 0 for x, go down to Paste and enter twice.
2ndDISTRvars10▼▼▼enterenter
.398942280416.3Find a value from a probability (inverse normal and t)#
The 97.5th percentile
DISTR item 3: type .975 for area, move down four times to Paste, enter twice.
2ndDISTRvars3.975▼▼▼▼enterenter
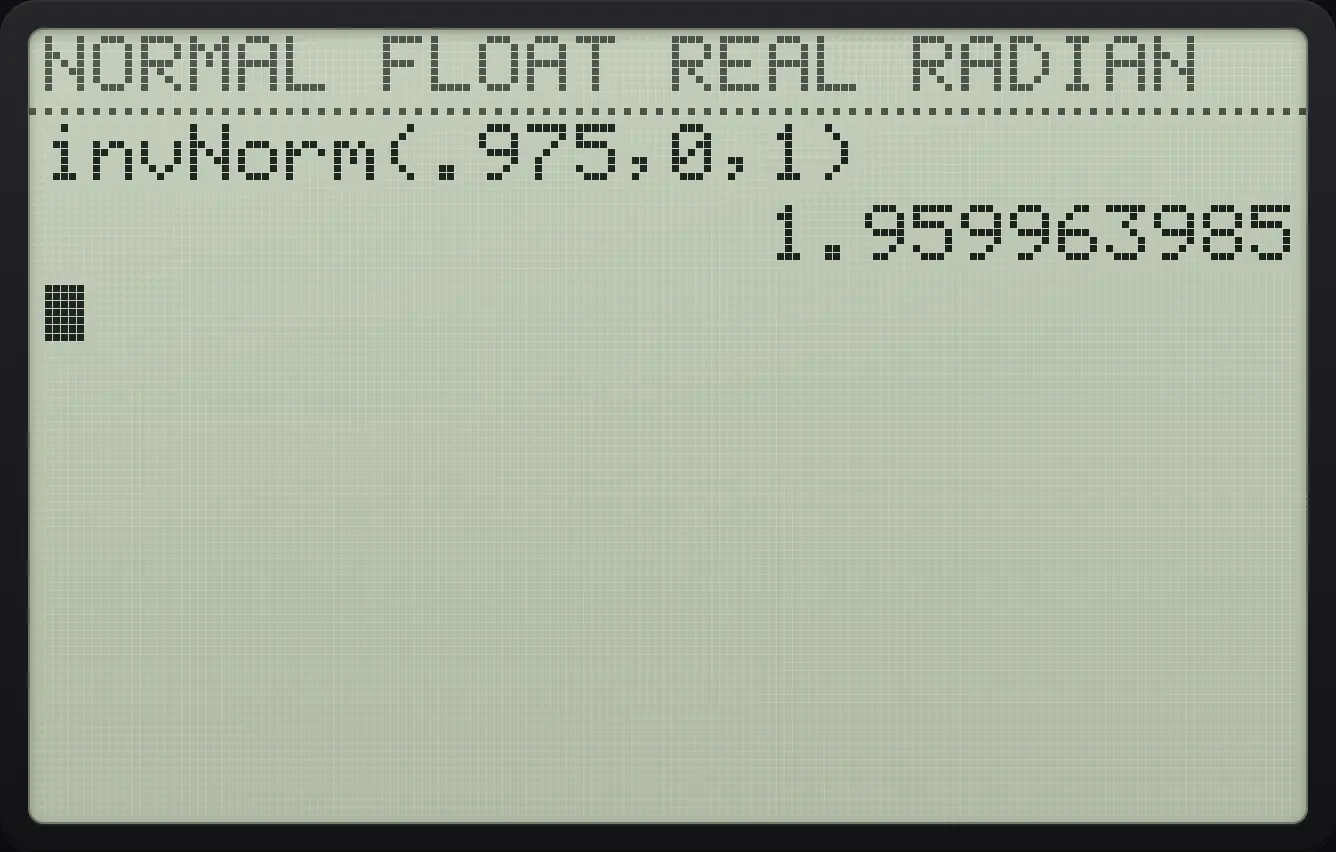
1.959963985Both tails (CENTER)
Type .95, go down three times to Tail, choose CENTER with right and enter, then down to Paste and enter twice.
2ndDISTRvars3.95▼▼▼▶enter▼enterenter
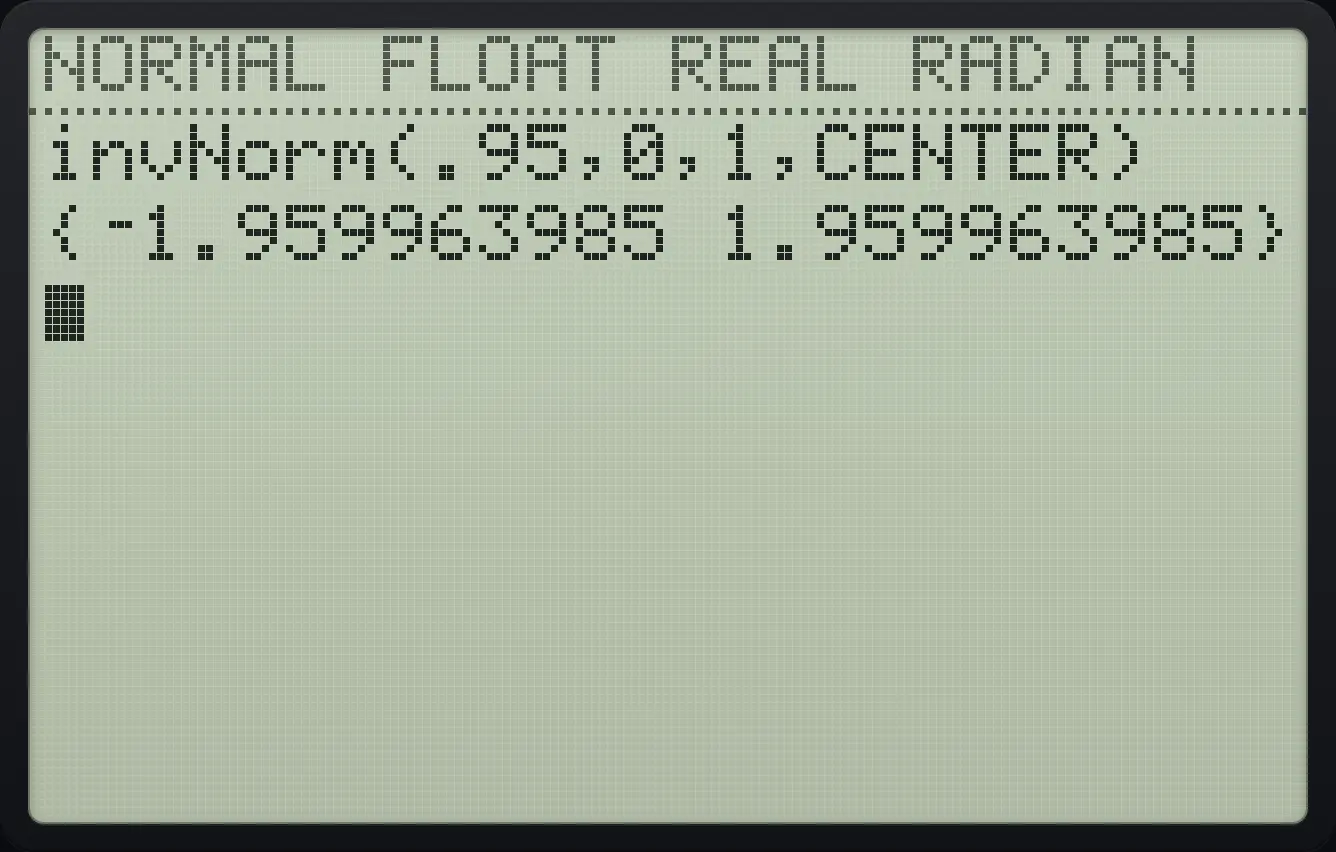
{⁻1.959963985 1.959963985}Inverse t
DISTR item 4: area .975 and 10 degrees of freedom.
2ndDISTRvars4.975▼10▼enterenter
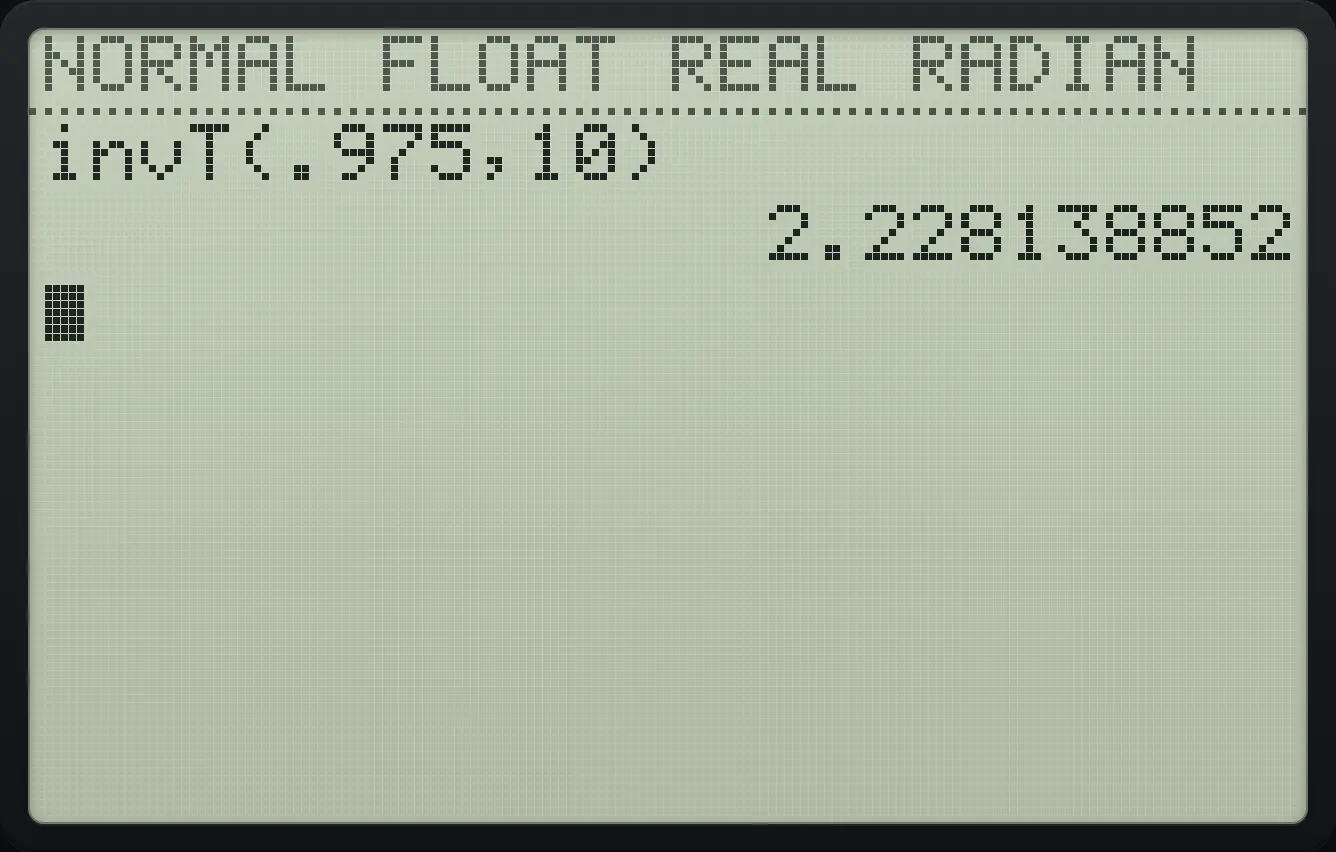
2.22813885216.4Binomial, Poisson, t and chi-square probabilities#
Five heads in ten tosses
Press 2nd vars then alpha math (A: binompdf). Type 10 trials, .5 for p, 5 for x, then Paste and enter.
2ndDISTRvarsalphaAmath10▼.5▼5▼enterenter
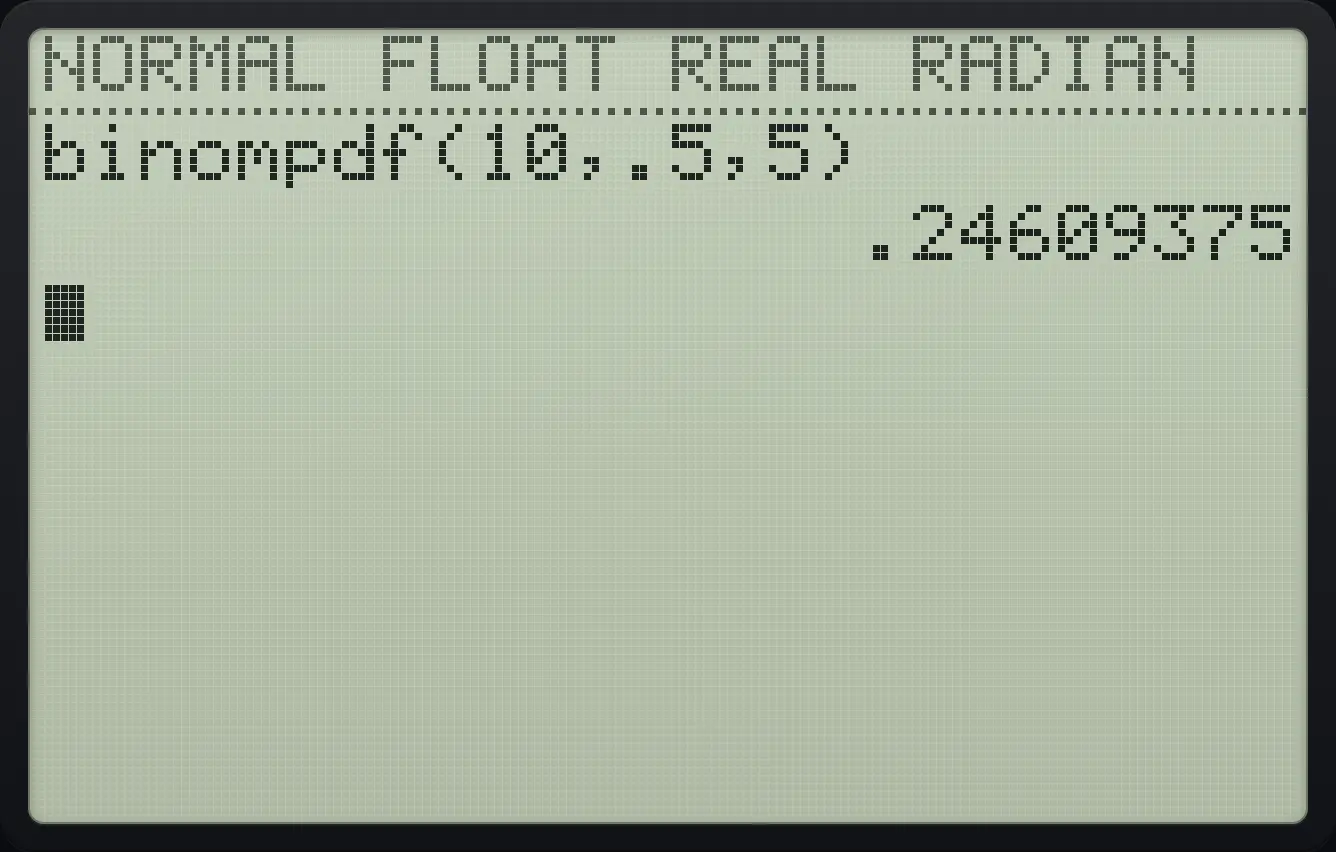
.24609375Five or fewer heads
binomcdf( is alpha apps (B).
2ndDISTRvarsalphaBapps10▼.5▼5▼enterenter
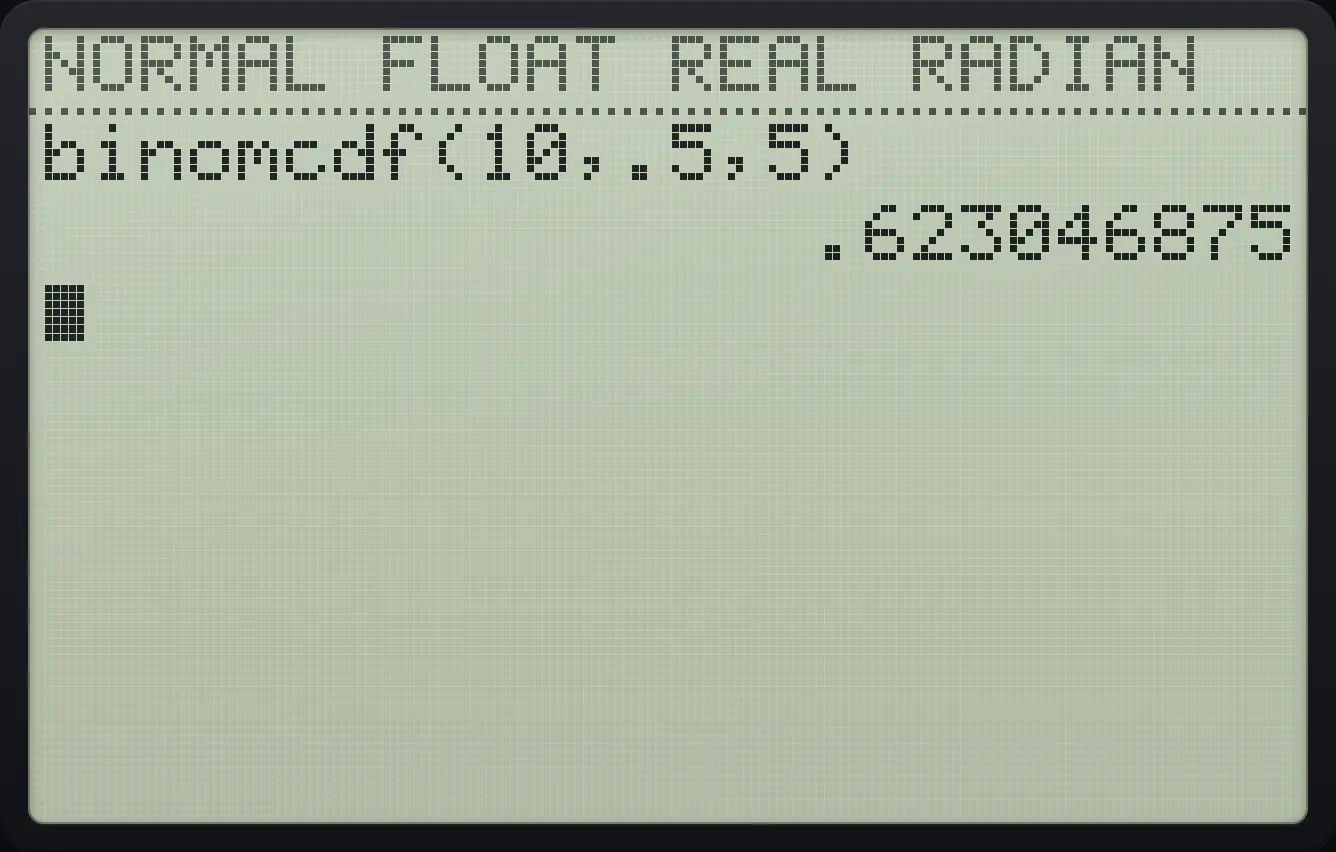
.623046875Poisson probability
poissonpdf( is alpha prgm (C): mean 2, x 0.
2ndDISTRvarsalphaCprgm2▼0▼enterenter
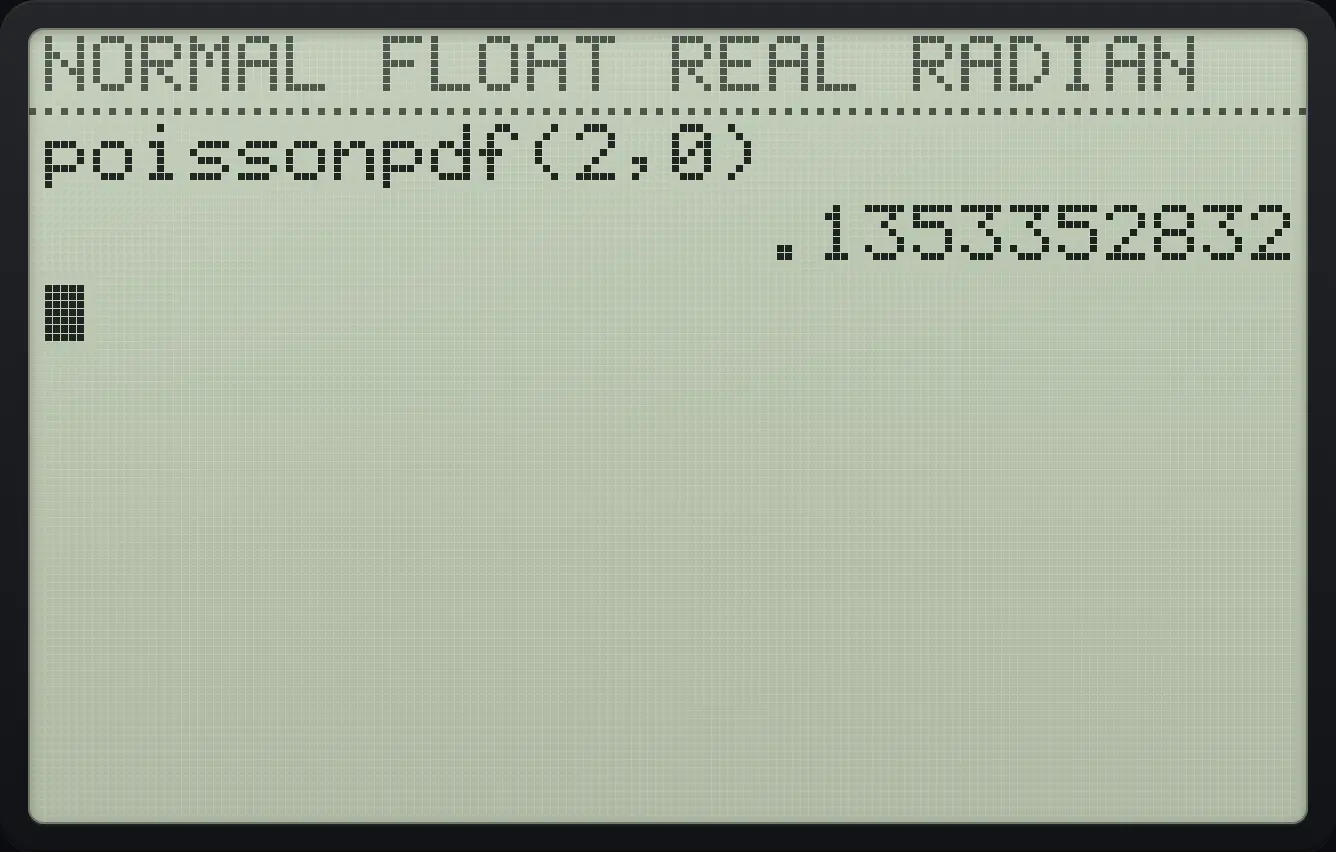
.1353352832Geometric, first success by trial 3
geometcdf( is alpha cos (F): p .5, x 3.
2ndDISTRvarsalphaFcos.5▼3▼enterenter
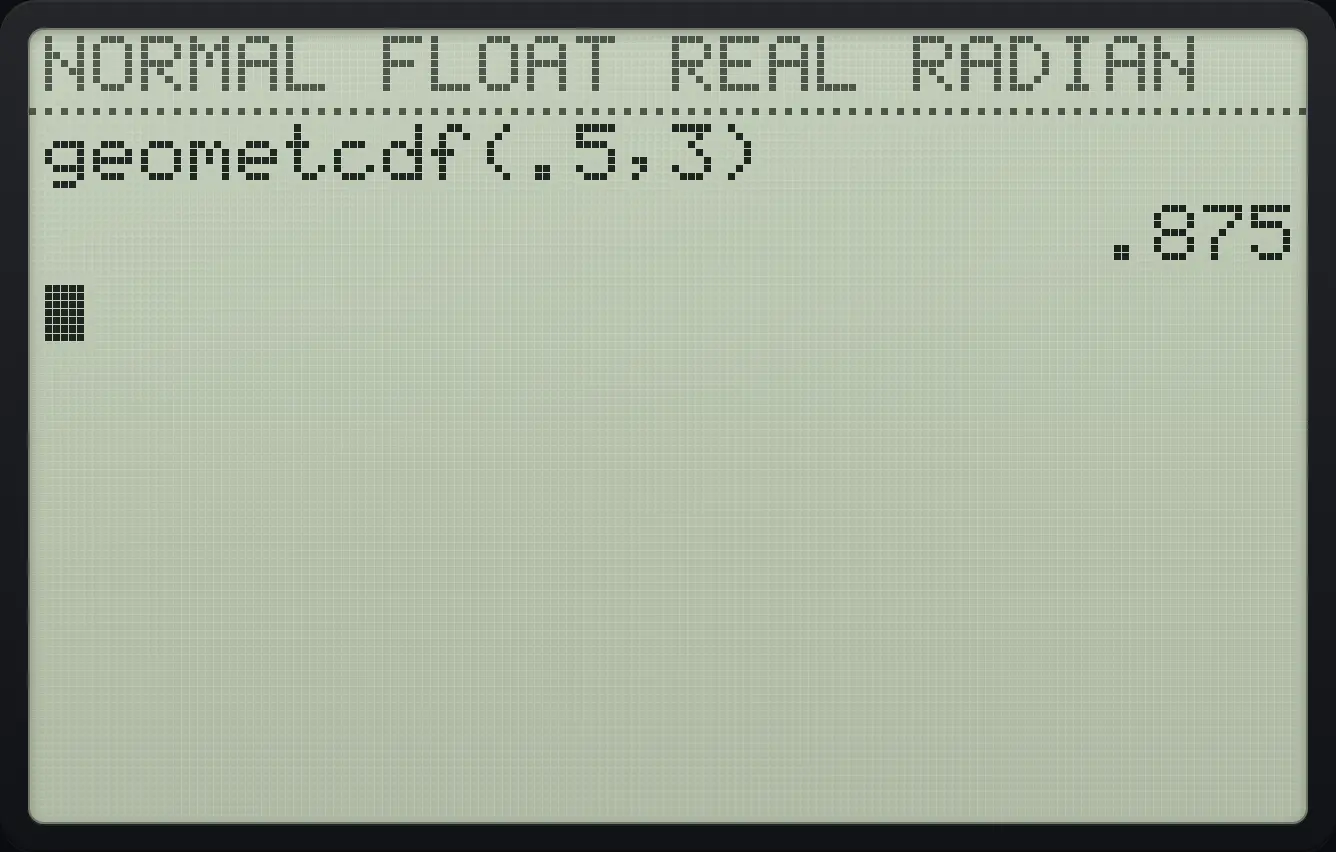
.875t probability
tcdf( is item 6: lower −2, upper 2, df 10.
2ndDISTRvars6(−)2▼2▼10▼enterenter
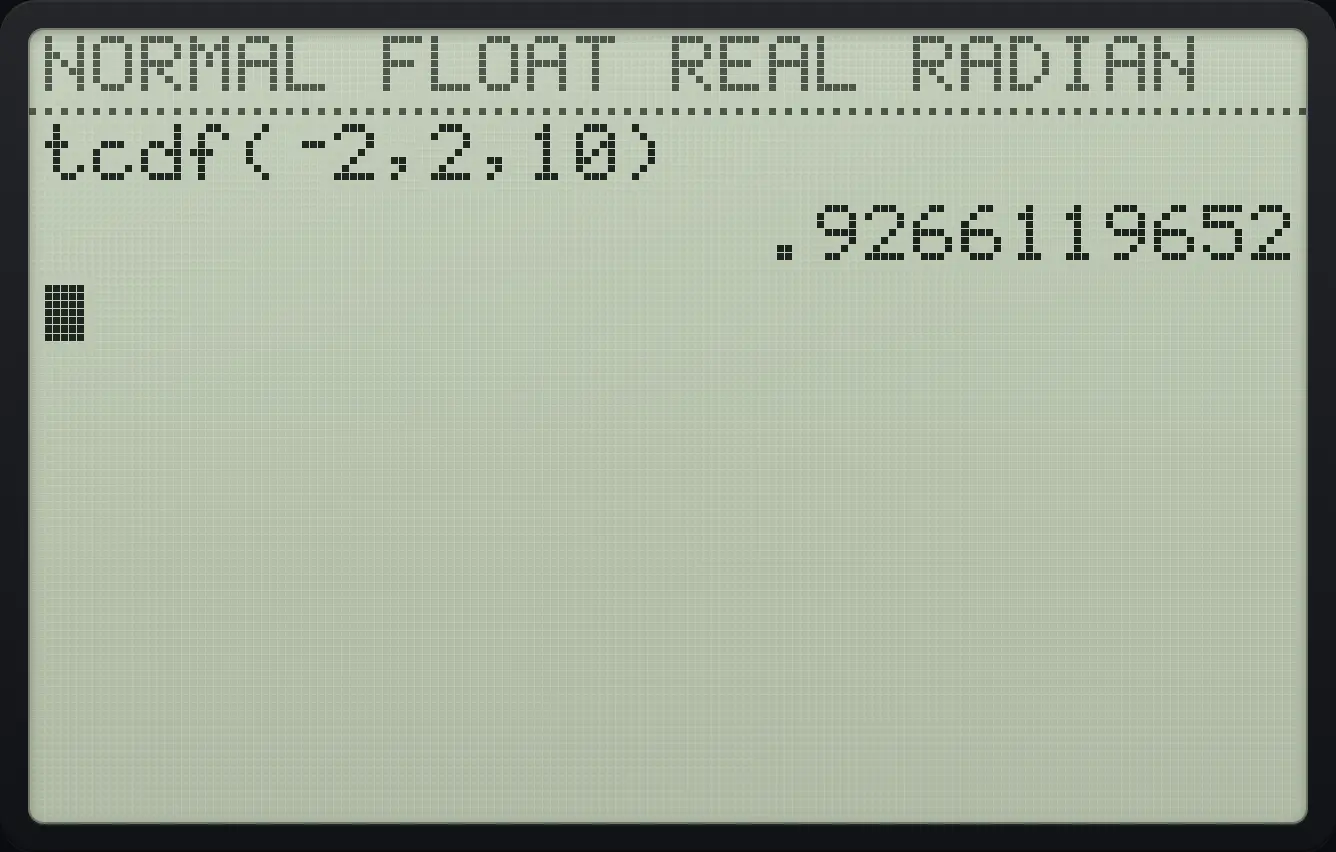
.9266119652Chi-square probability
χ²cdf( is item 8: lower 0, upper 3.84, df 1.
2ndDISTRvars80▼3.84▼1▼enterenter
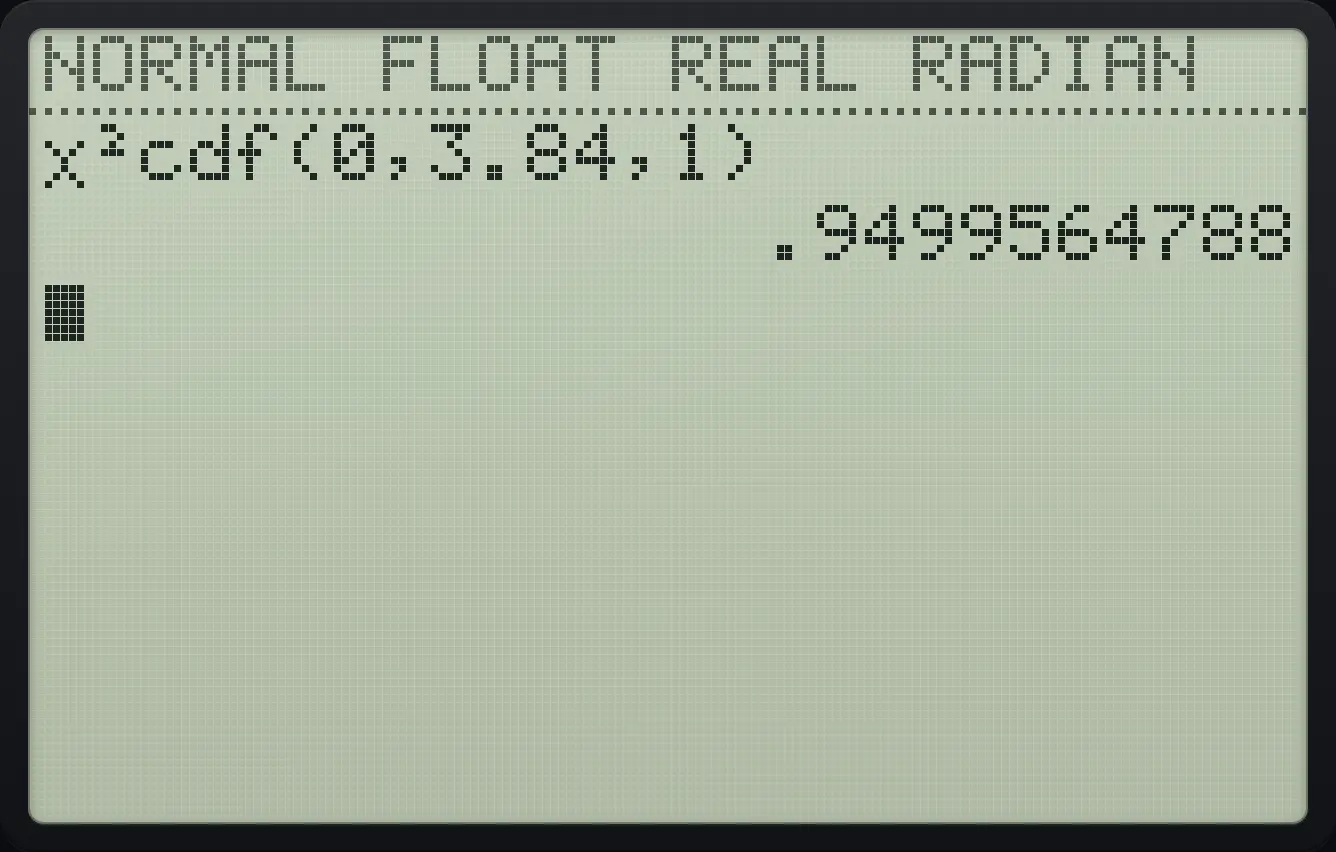
.949956478816.5Shade an area under a curve#
The DRAW tab (press 2ndDISTRvars then ▶) has ShadeNorm(, ShadeT(, Shadeχ²( and ShadeF(. Type the lower and upper limits and the distribution values, and the area is drawn and measured.
Shade the middle 68%
Press 2nd vars, right, 1 (ShadeNorm(), type −1,1), enter.
2ndDISTRvars▶1(−)1,1)enter
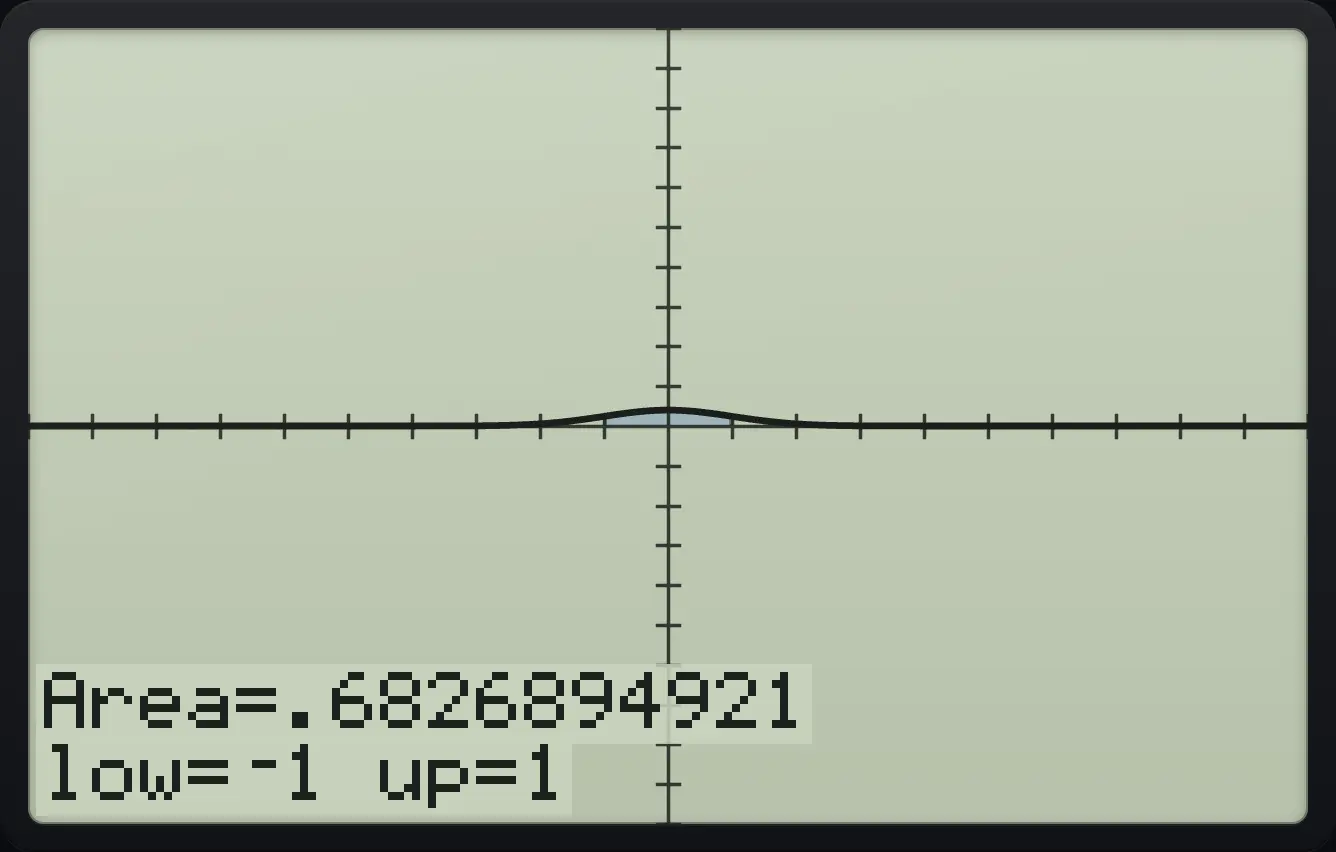
Area=.6826894921 low=⁻1 up=1TI-84 Plus CE is a trademark of Texas Instruments Incorporated. Trident Calculator is an independent product by South View Studios and is not affiliated with, sponsored by or endorsed by Texas Instruments. The name is used only to describe the kind of calculator this model resembles; Trident's names, keys, display, fonts and software are its own clean-room design.