
Classic Graphing 84 manual · Chapter 8 of 25
Graphing functions
Enter equations in the Y= editor, draw them, switch them on and off, change colours, graph parametric and polar equations, and set the graph format.
8.1Enter a function in the Y= editor#
Graphing starts in the Y= editor. It has ten function slots, Y1 to Y9 and Y0. Each slot holds a rule in terms of x. Type the rule, using X,T,θ,n for x, and press ▼ or enter to go to the next slot. The black square before a name means the slot is switched on.
- y=
- Type the rule
- graph
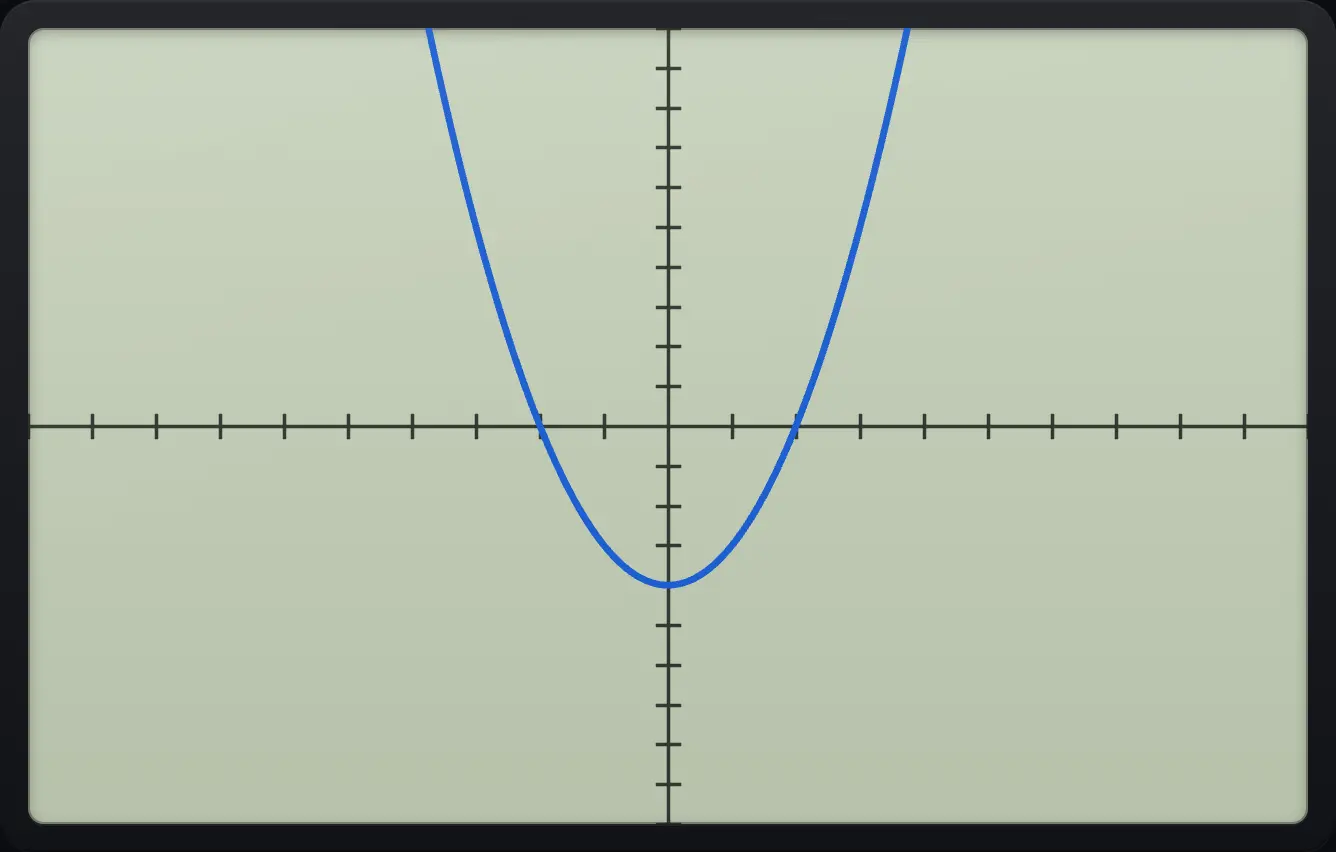
Graph y = x² − 4
Press Y= and type X, the square key, minus, 4. Use the X,T,θ,n key for X.
y=X,T,θ,nx²−4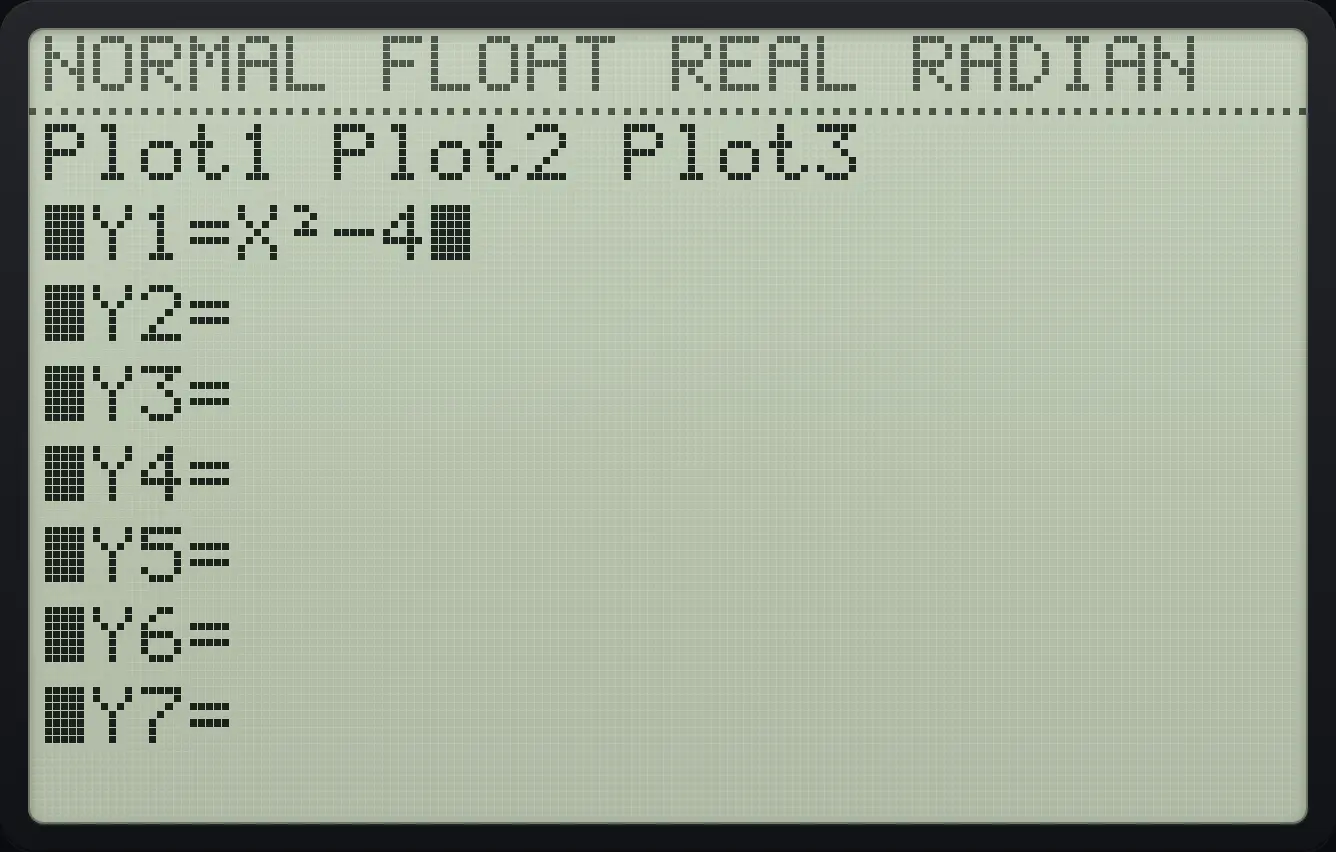
Press graph to draw it. The cursor then keeps the same view; press trace to read points.
graphtrace
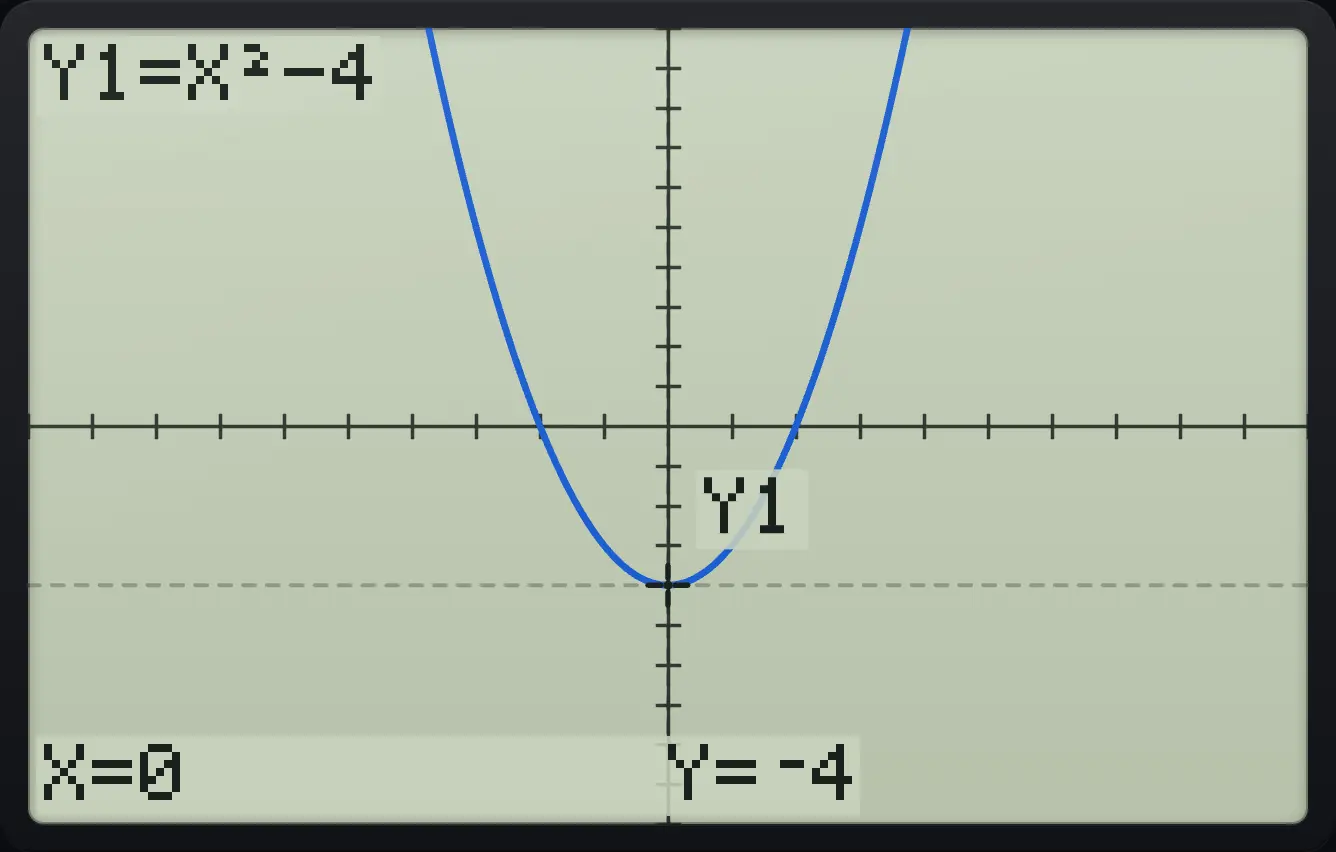
Y1=X²−4 X=0 Y=⁻4Several functions at once
Type X in Y1 and −X in Y2, then press the down key to leave Y2 and graph.
y=X,T,θ,n▼(−)X,T,θ,n▼trace
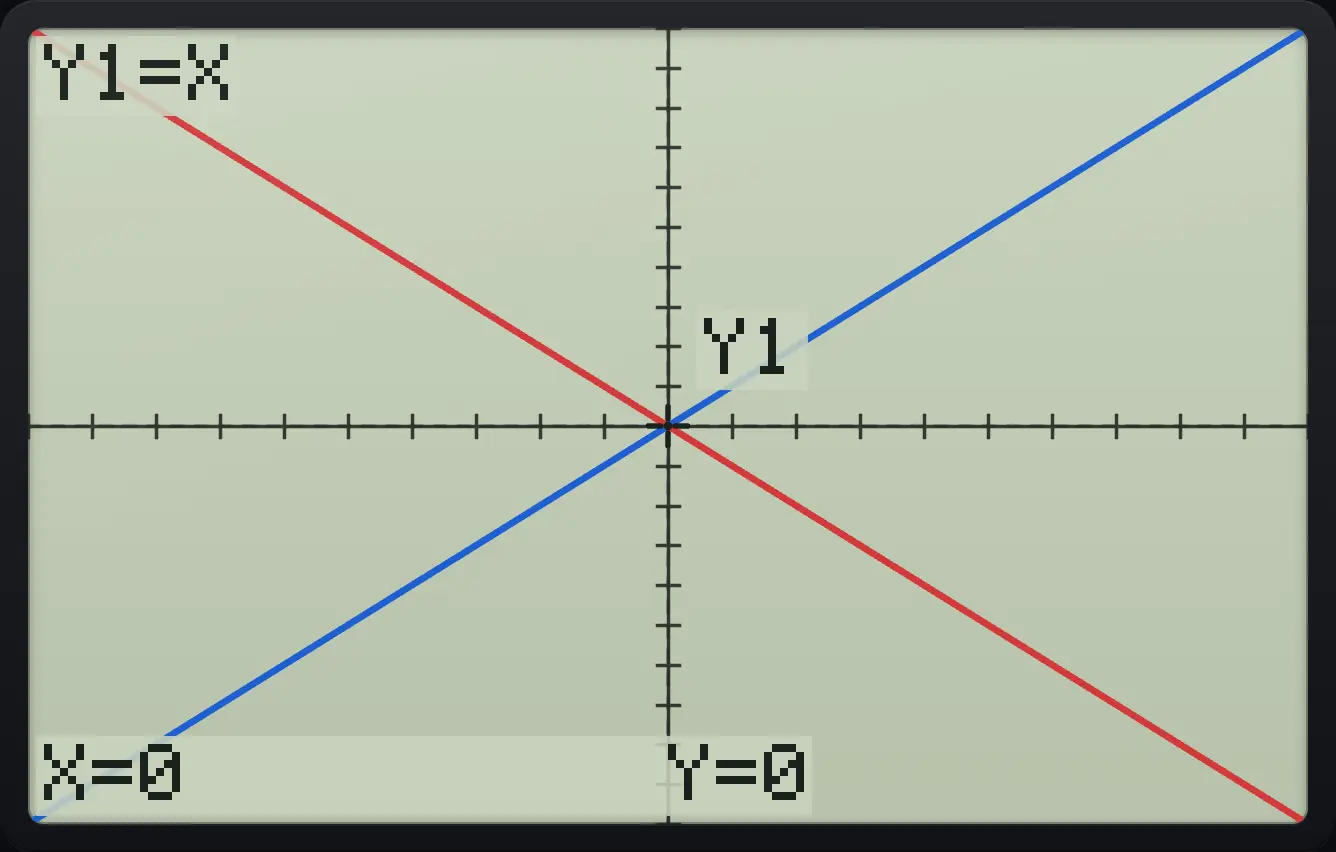
Y1=XPress clear in a slot to erase its rule, or del to delete single characters. Menu items such as abs( from math can be pasted into Y=.
Paste a function from a menu
In Y= press math, right (NUM), 1 for abs(, then X and a bracket.
y=math▶1X,T,θ,n)
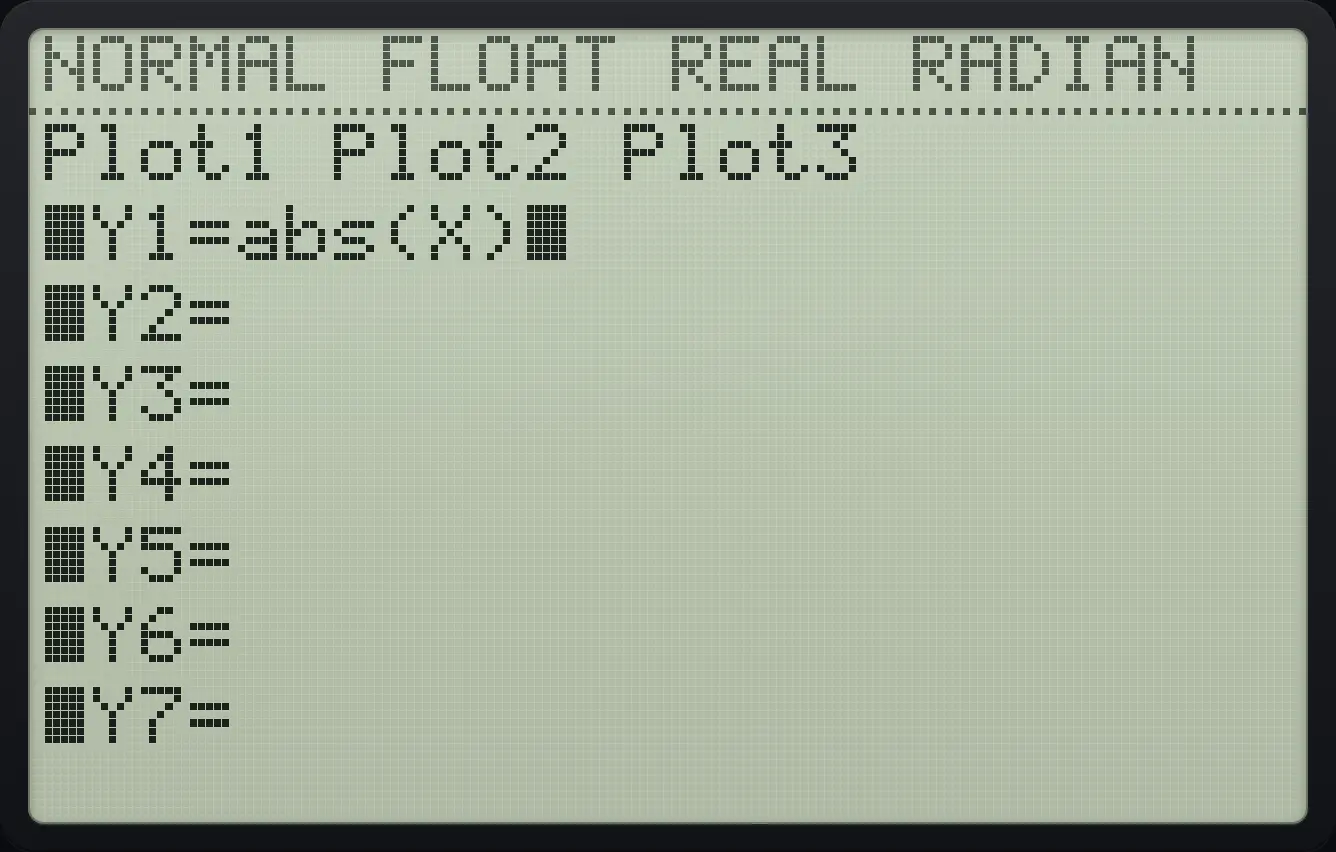
Y1=abs(X)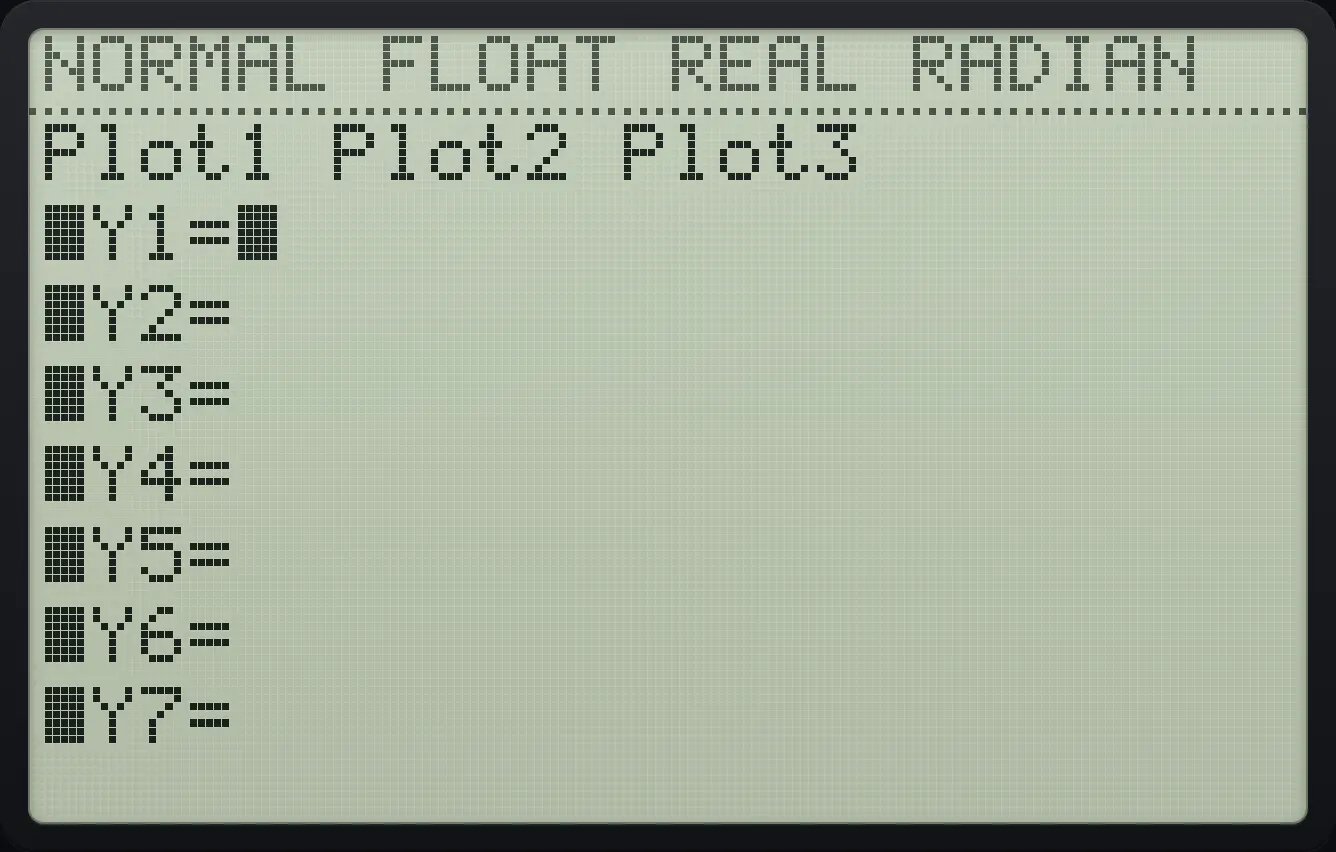
8.2Turn a function on or off#
Only functions that are on (black square) are drawn. To switch one off, move the cursor left onto the equals sign and press enter. Press enter again to switch it back on. Switching off keeps the rule, so you can compare graphs without retyping.
Switch Y1 off
Type X in Y1, move left twice onto the equals sign and press enter. The black square disappears.
y=X,T,θ,n◀◀enter
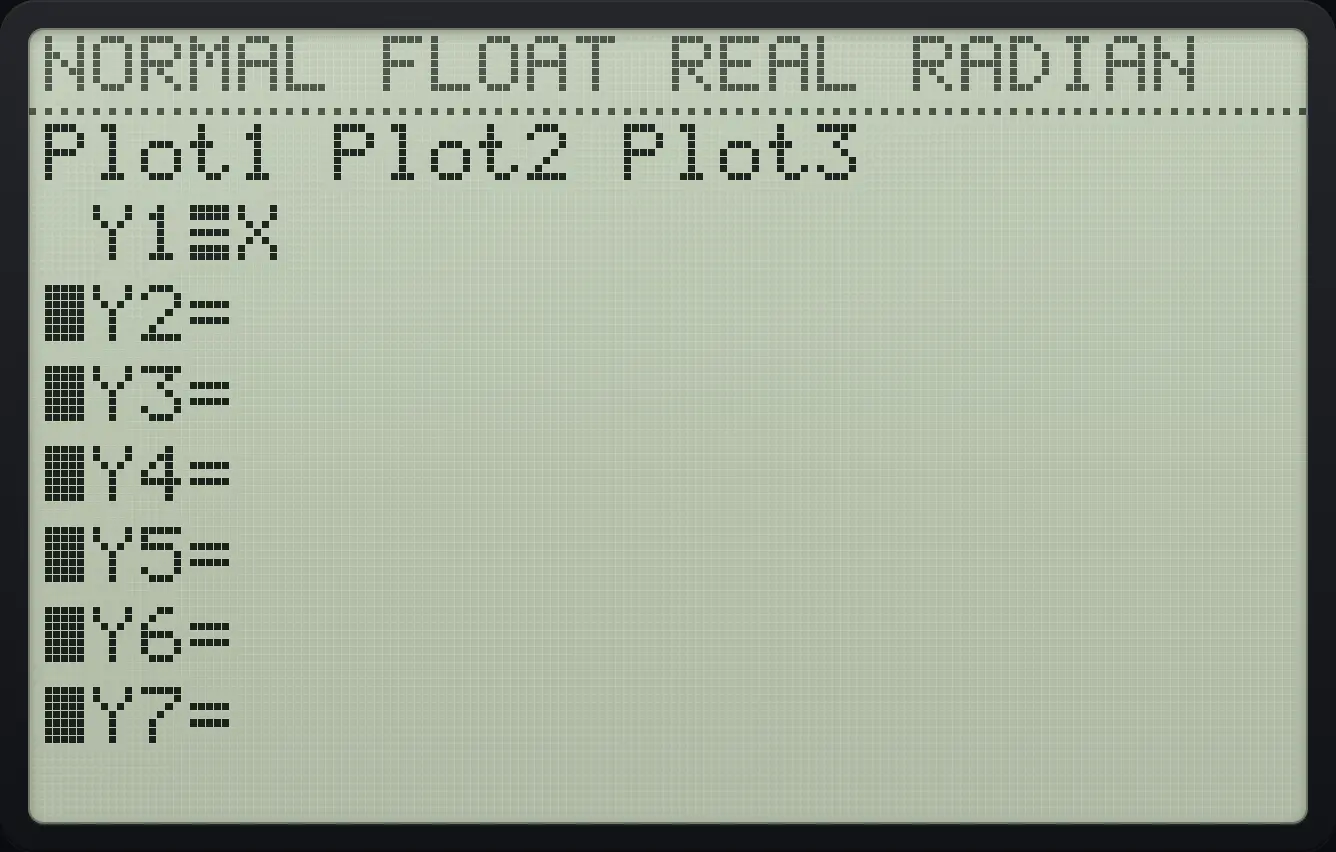
Plot3 Y1=XThe row at the top of the editor, Plot1 Plot2 Plot3, switches statistics plots on and off the same way (move ▲ onto it and press enter).
Switch Plot1 on
In Y= press up onto the Plot row, then enter.
y=▲enter
![Result of the example "Switch Plot1 on" The display shows: [Plot1] Plot2 Plot3 / ■Y1= / ■Y2= / ■Y3= / ■Y4= / ■Y5= / ■Y6= / ■Y7=.](/trident/app/help/manual/img/22b2c741s.webp)
[Plot1] Plot2 Plot38.3Change the colour of a graph#
Each slot has a colour. The defaults are blue, red, black, magenta, green and so on. Move the cursor left past the equals sign onto the colour marker and press enter to step to the next colour.
Make Y1 red
Type X in Y1, move left three times and press enter.
y=X,T,θ,n◀◀◀enter
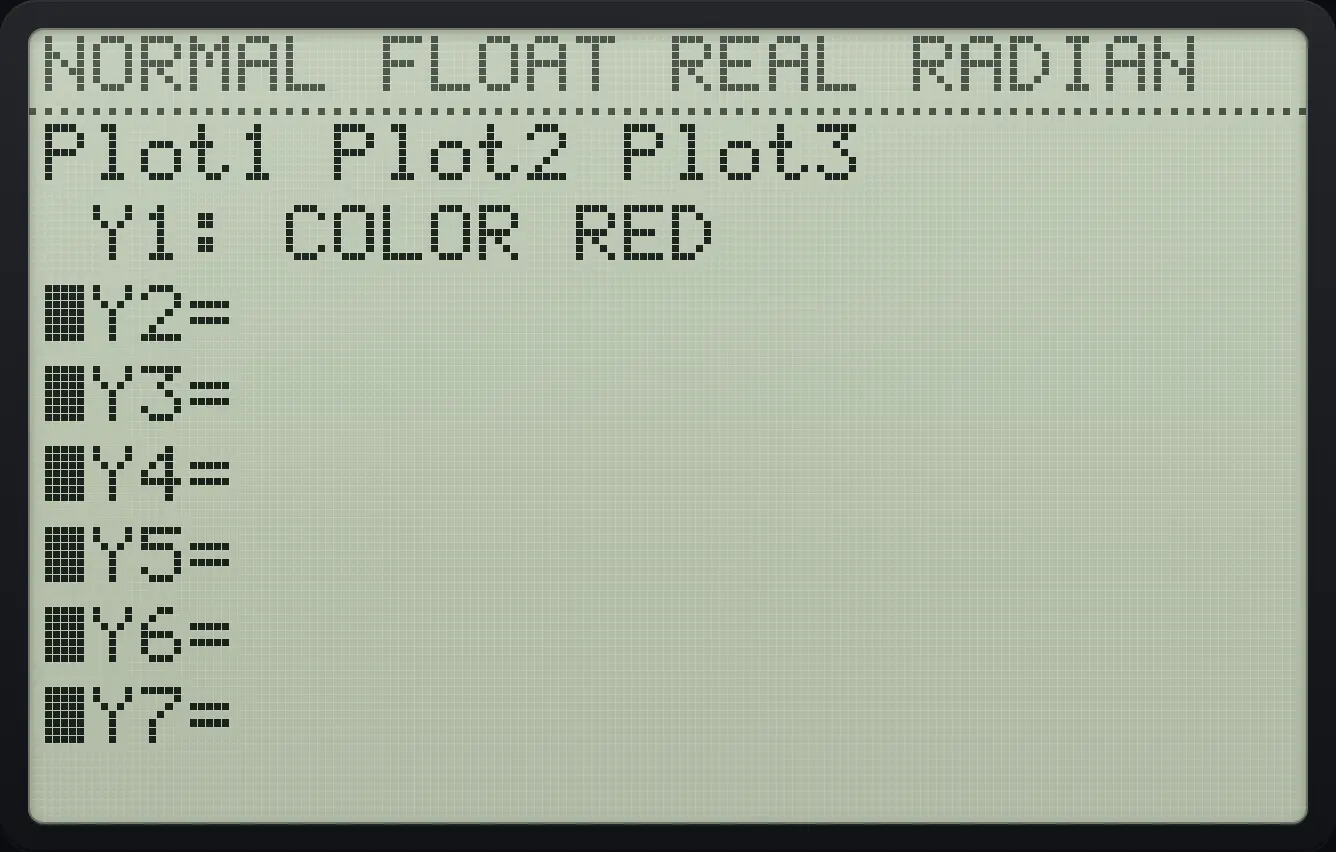
Y1: COLOR RED8.4Use a Y= function on the home screen#
A function stored in Y1 can be used like any function: Y1(2) evaluates it at 2. Paste the name from vars, then ▶ (Y-VARS), then 1 (Function) and the slot number.
Evaluate Y1(2)
Store X²+1 in Y1.
y=X,T,θ,nx²+1Go home, paste Y1 through vars, right, 1, 1 and type (2).
2ndQUITmodevars▶11(2)enter
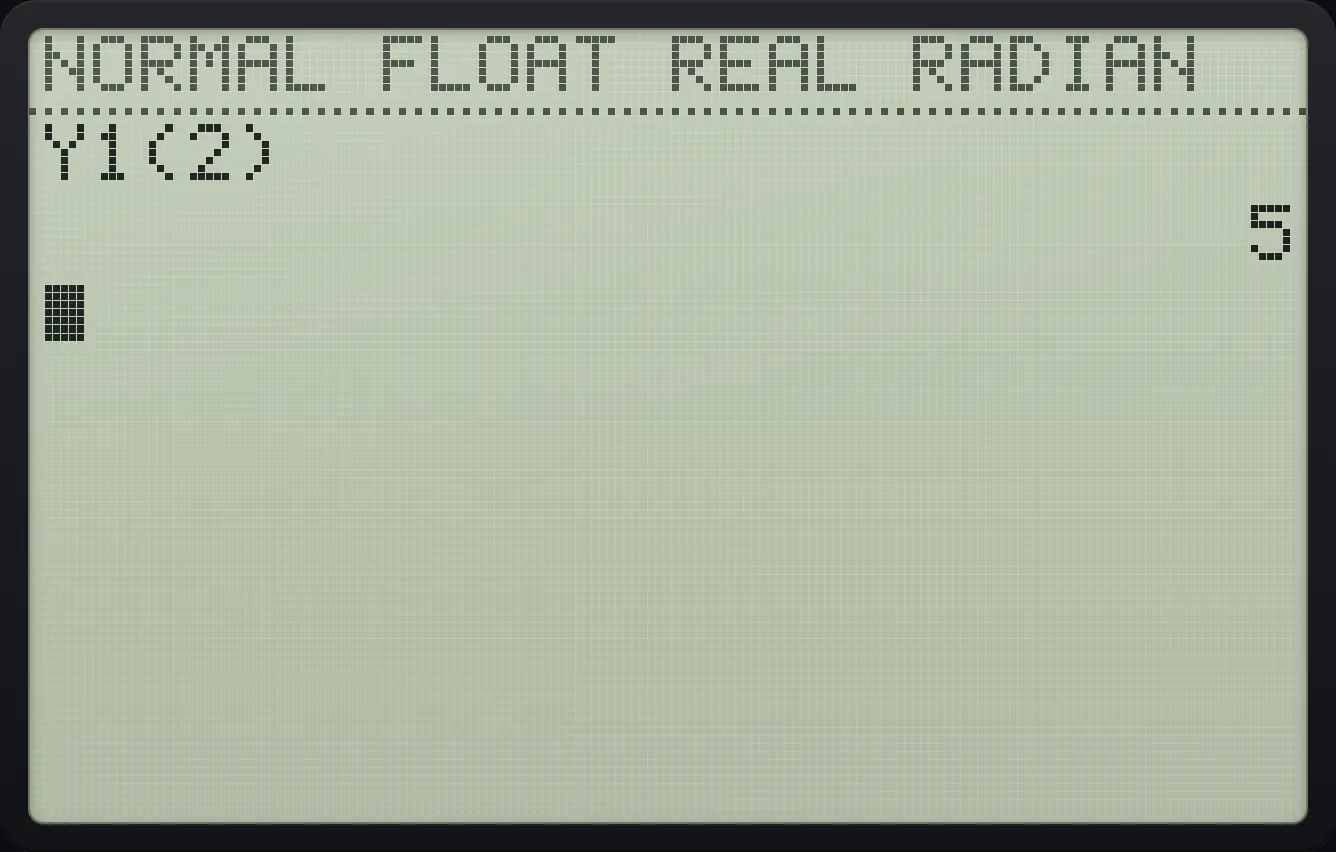
Y1(2) 5Store text into Y1
Type "2X" with the quote key (alpha add), press sto and paste Y1 with vars, right, 1, 1, then enter. Open Y= to see it.
alpha"+2X,T,θ,nalpha"+sto→vars▶11entery=
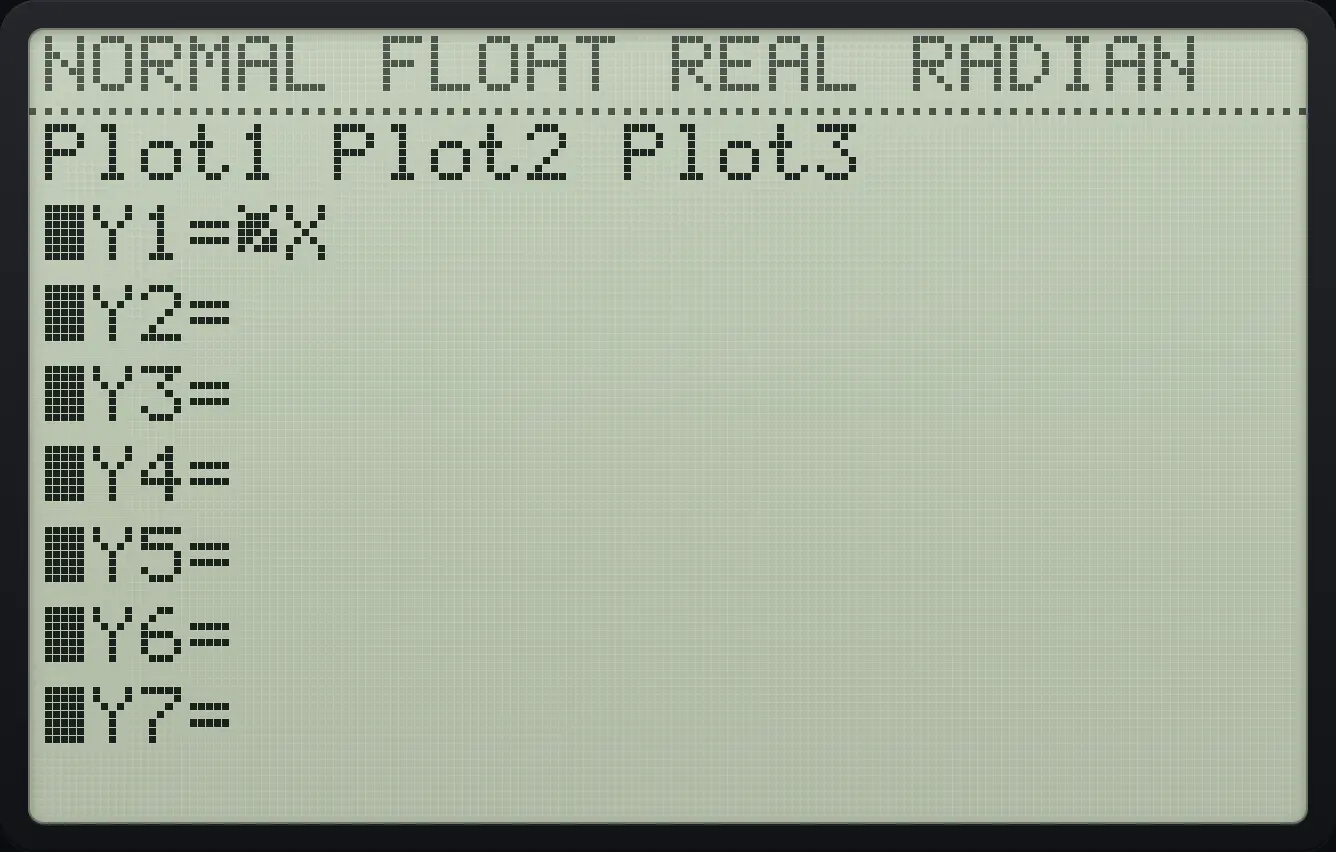
Y1=2X8.5Graph parametric equations#
In parametric mode a point moves with a parameter t: and . Set MODE to PAR (fourth row). The Y= editor then shows pairs X1T and Y1T, the WINDOW screen asks for Tmin, Tmax and Tstep, and X,T,θ,n types T.
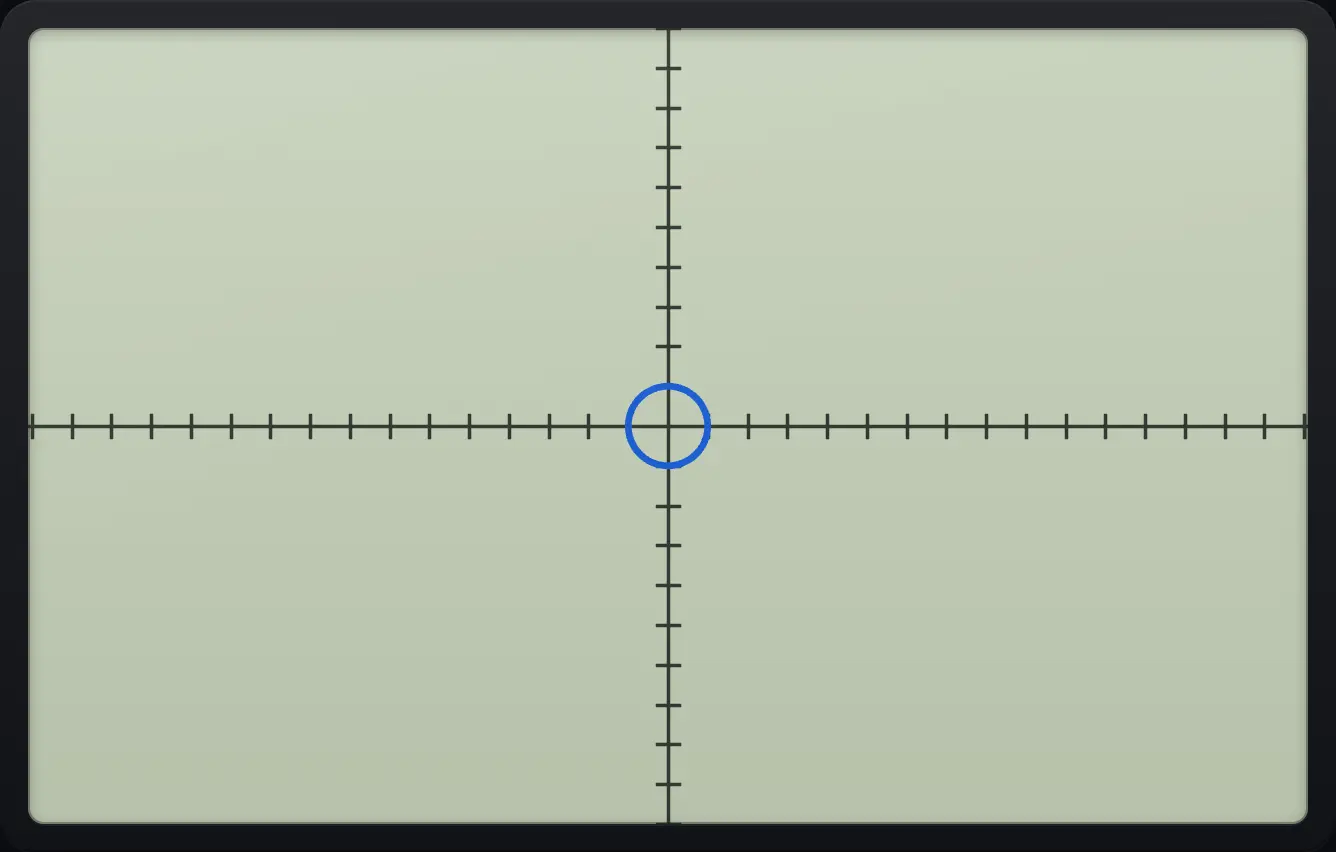
Graph a circle
Choose PAR in MODE.
mode▼▼▼▶enterIn Y= type cos(T) for X1T, press down, type sin(T) for Y1T.
y=cosX,T,θ,n)▼sinX,T,θ,n)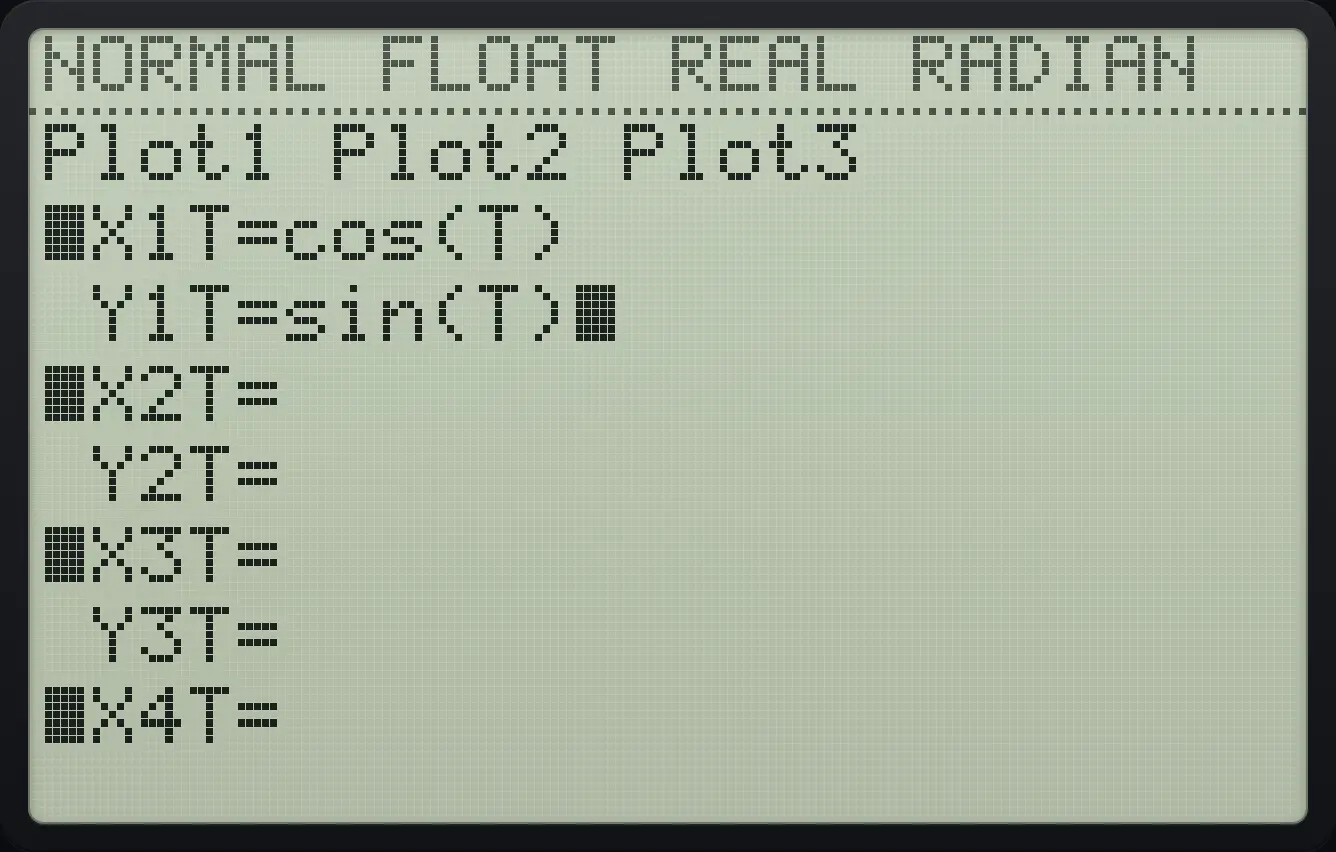
Press graph, then trace. The screen shows the value of T and the point.
graphtrace
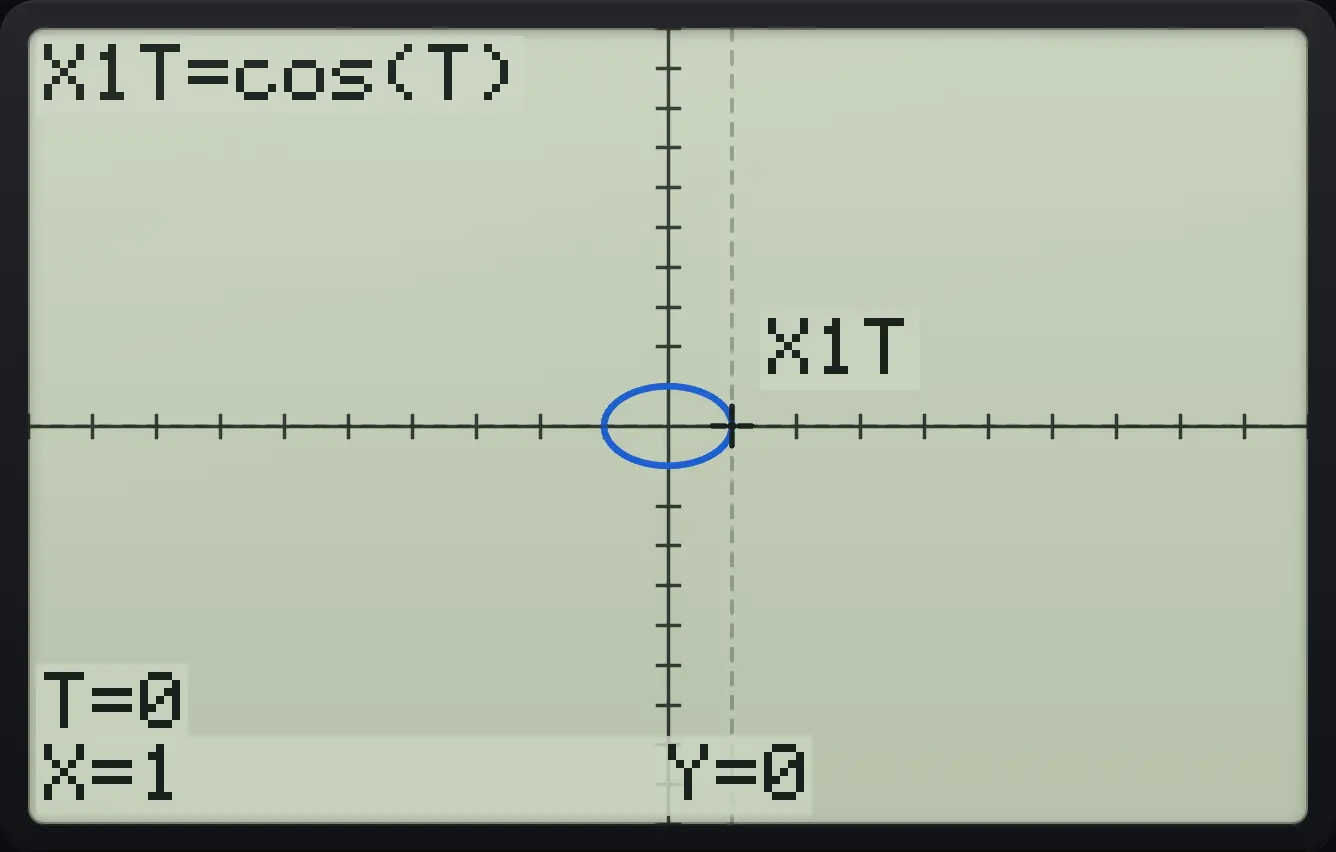
T=0 X=1 Y=0The WINDOW screen in parametric mode
In PAR mode press window.
mode▼▼▼▶enterwindow
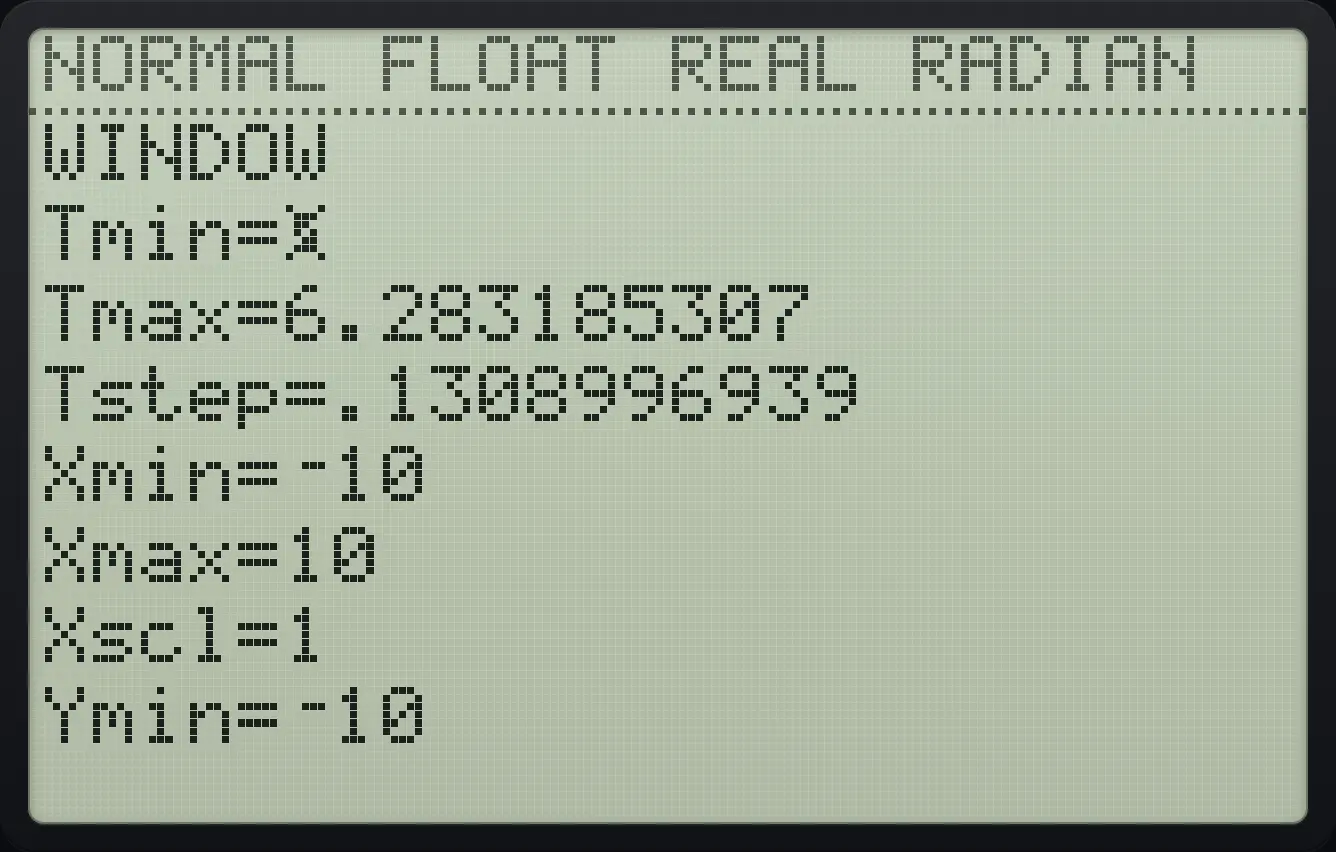
Tmin=0 Tmax=6.283185307 Tstep=.13089969398.6Graph polar equations#
In polar mode you give the distance from the centre as a function of the angle . Choose POL in MODE. Y= shows r1 to r6, WINDOW asks for θmin, θmax and θstep, and X,T,θ,n types θ.
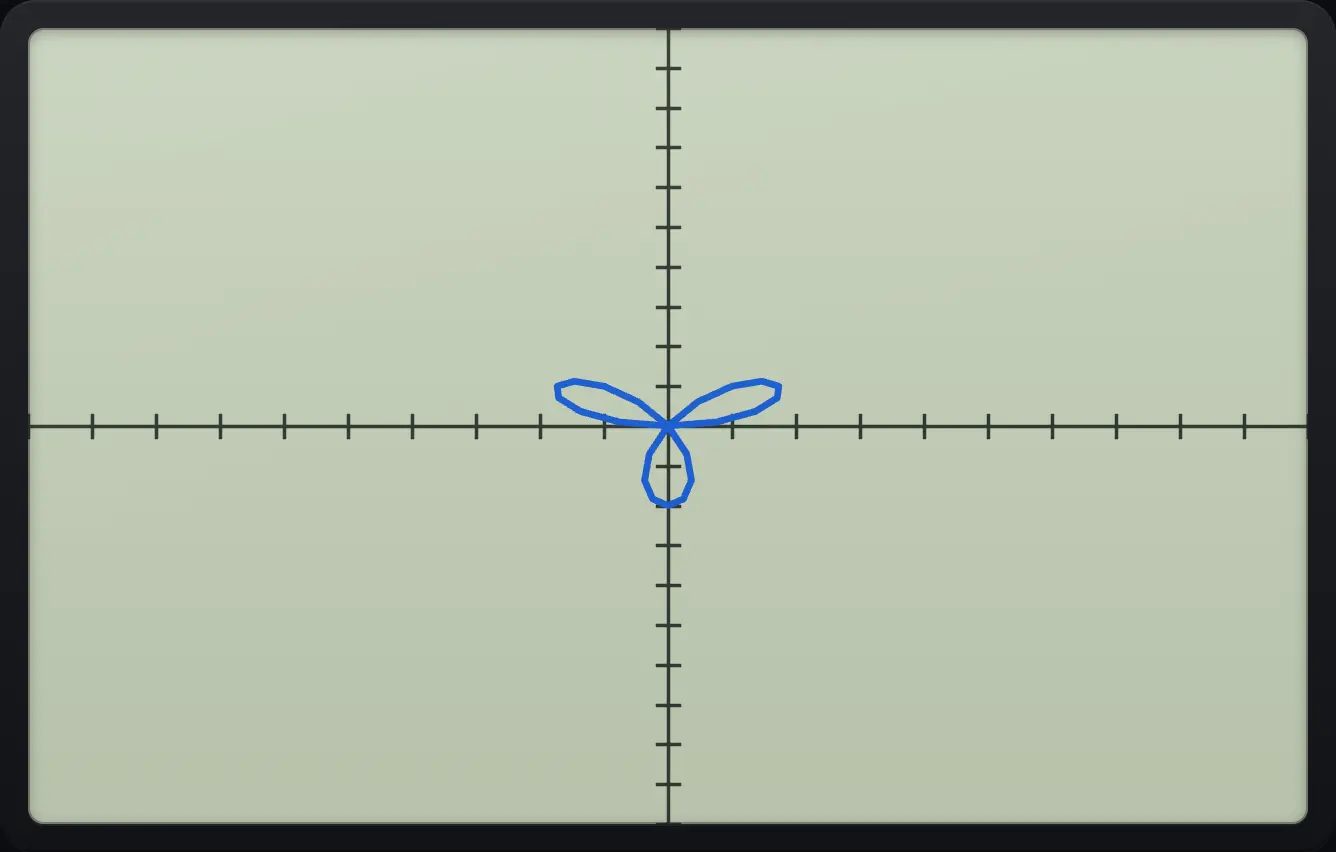
Graph a rose
Choose POL in MODE.
mode▼▼▼▶▶enterIn Y= type 2 sin(3θ), using the X,T,θ,n key for θ.
y=2sin3X,T,θ,n)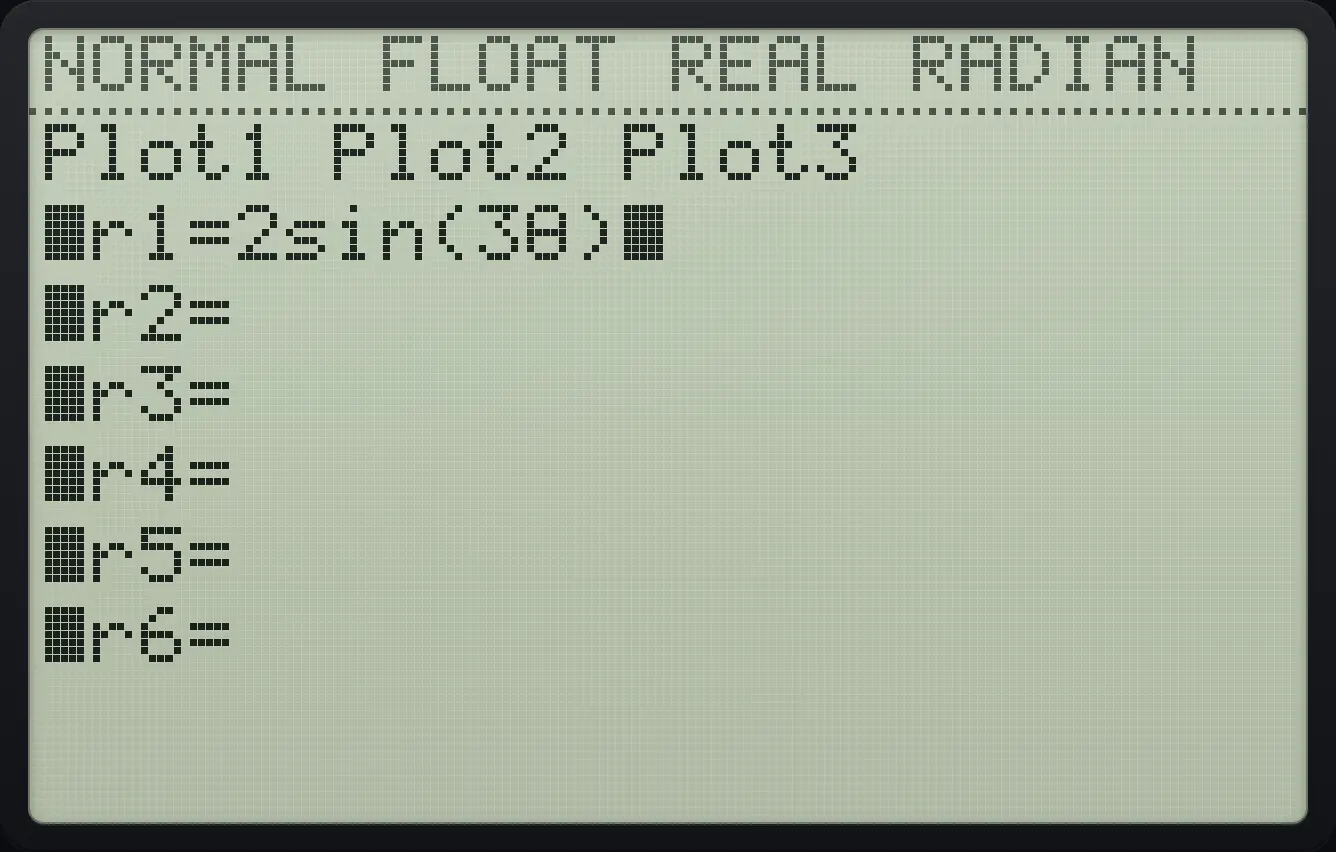
Press graph and then trace.
graphtrace
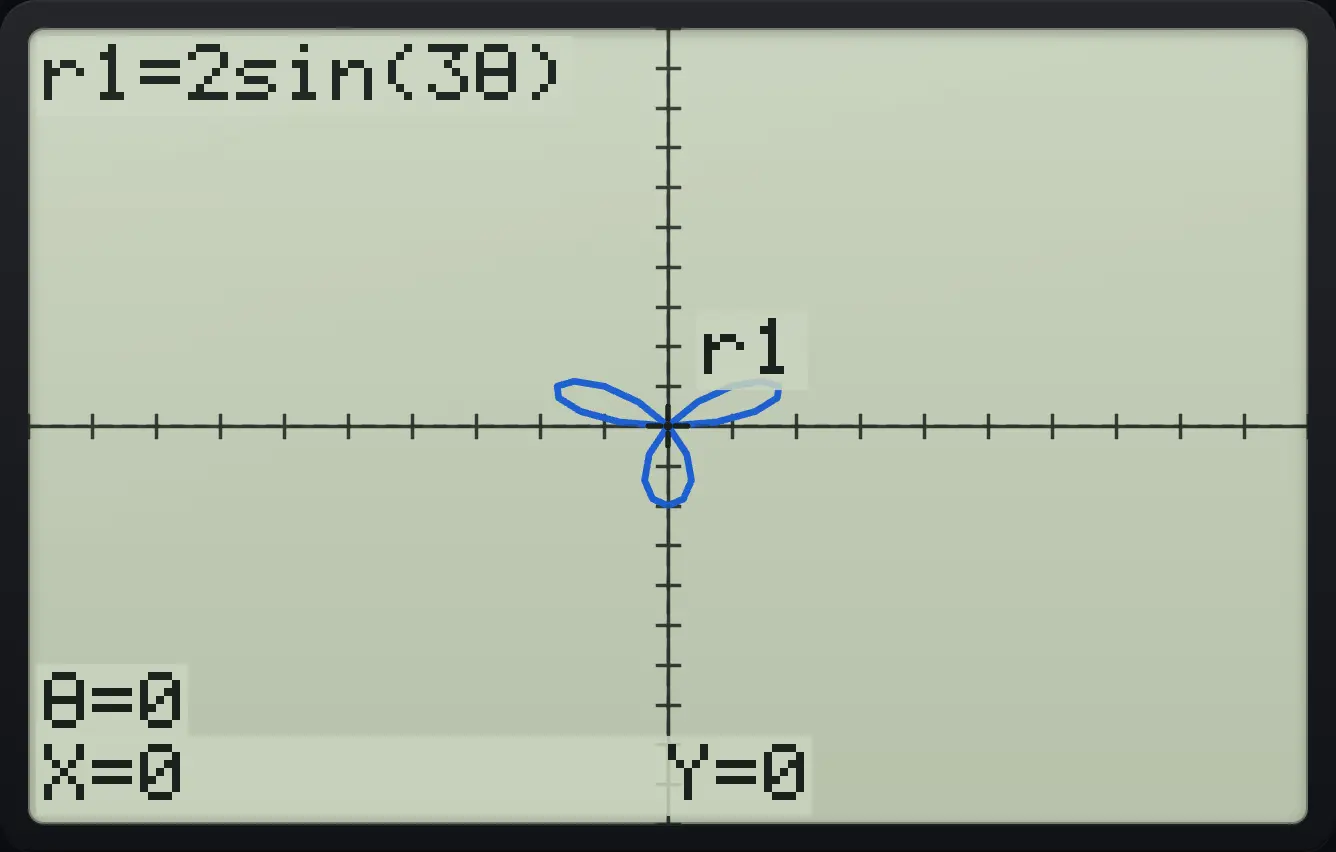
r1=2sin(3θ) θ=08.7Grid, axes, labels and coordinates (FORMAT)#
Press 2ndFORMATzoom for FORMAT. Each row has two choices, with the current one in brackets. Choose with ◀ and ▶ and press enter.
![The FORMAT screen. The display shows: [RectGC] PolarGC / [CoordOn] CoordOff / [GridOff] GridOn / [AxesOn] AxesOff / [LabelOff] LabelOn / [ExprOn] ExprOff.](/trident/app/help/manual/img/3e81bc6cs.webp)
| Row | Choices | Effect |
|---|---|---|
| 1 | RectGC / PolarGC | Cursor coordinates shown as x, y or as r, θ. |
| 2 | CoordOn / CoordOff | Show or hide the coordinates at the bottom of the graph. |
| 3 | GridOff / GridOn | Draw a grid at each tick mark. |
| 4 | AxesOn / AxesOff | Draw or hide the axes. |
| 5 | LabelOff / LabelOn | Name the axes. |
| 6 | ExprOn / ExprOff | Show the equation at the top while you trace. |
Turn the grid on
Open FORMAT, move down two rows, right to GridOn and enter.
2ndFORMATzoom▼▼▶enter
![Result of the example "Turn the grid on" The display shows: [RectGC] PolarGC / [CoordOn] CoordOff / GridOff [GridOn] / [AxesOn] AxesOff / [LabelOff] LabelOn / [ExprOn] ExprOff.](/trident/app/help/manual/img/055cf244s.webp)
GridOff [GridOn]TI-84 Plus CE is a trademark of Texas Instruments Incorporated. Trident Calculator is an independent product by South View Studios and is not affiliated with, sponsored by or endorsed by Texas Instruments. The name is used only to describe the kind of calculator this model resembles; Trident's names, keys, display, fonts and software are its own clean-room design.