
Classic Graphing 84 manual · Chapter 14 of 25
Regression: fitting curves to data
Fit lines, polynomials, exponentials, powers, logarithms, logistic and sine curves to data, store the equation in Y= and read r and R².
14.1The regression commands#
Regression finds the curve of a chosen type that fits the data best. All the commands are in STAT, CALC. They need an Xlist and a Ylist of equal length (L1 and L2 by default), an optional frequency list and an optional place to store the equation.
![The CALC tab of the STAT menu. The display shows: EDIT [CALC] TESTS / 1:1-Var Stats / 2:2-Var Stats / 3:Med-Med / 4:LinReg(ax+b) / 5:QuadReg / 6:CubicReg / 7↓QuartReg.](/trident/app/help/manual/img/49896bc9s.webp)
| Item | Command | Fits |
|---|---|---|
| 3 | Med-Med | through medians (resists outliers) |
| 4 | LinReg(ax+b) | |
| 5 | QuadReg | |
| 6 | CubicReg | |
| 7 | QuartReg | |
| 8 | LinReg(a+bx) | |
| 9 | LnReg | |
| 0 | ExpReg | |
| A | PwrReg | |
| B | Logistic | |
| C | SinReg |
14.2Fit a straight line#
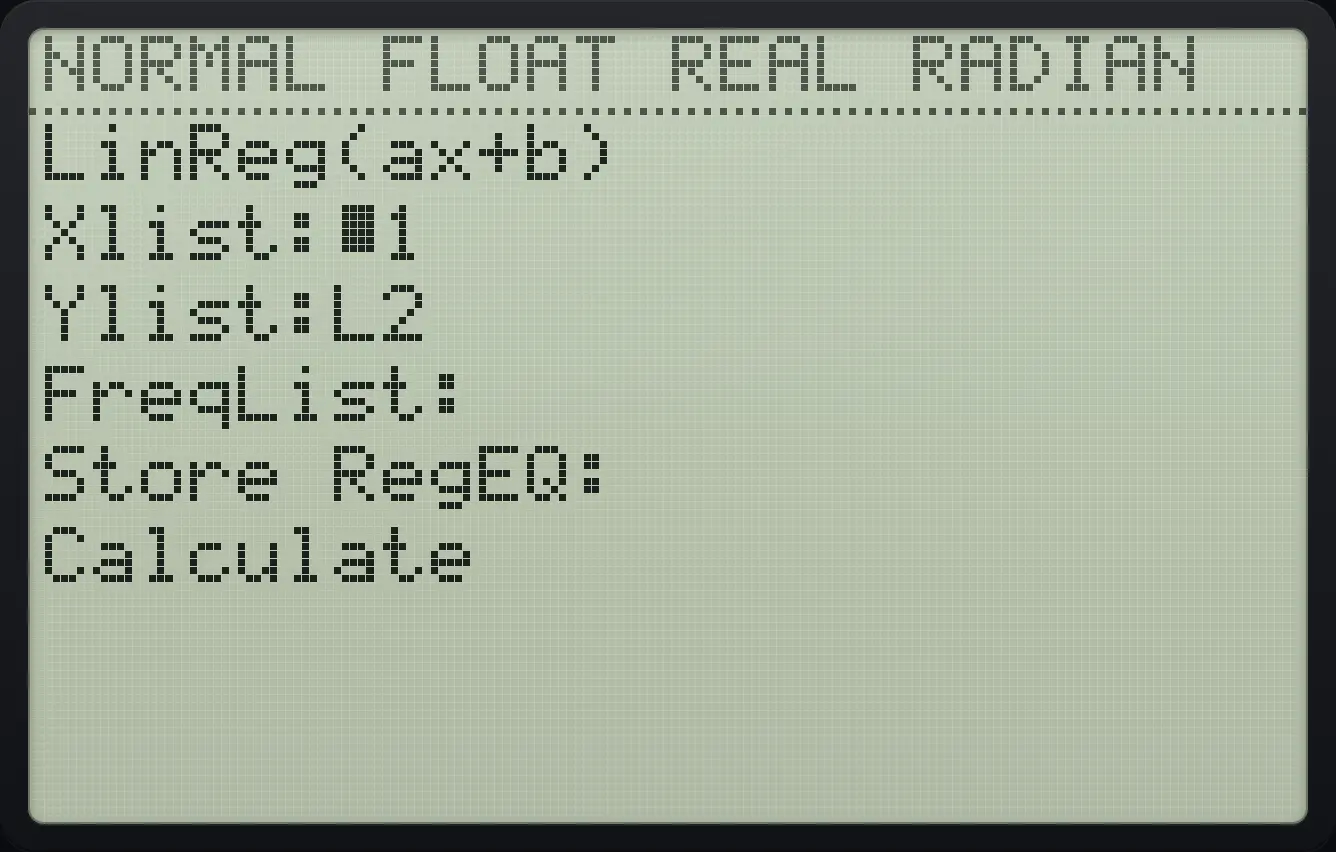
A line through exact data
L1 = 1, 2, 3, 4 and L2 = 3, 5, 7, 9.
stat11enter2enter3enter4enter▶3enter5enter7enter9enterOpen STAT, CALC, 4 (LinReg(ax+b)), move down four times to Calculate and press enter.
stat▶4▼▼▼▼enter
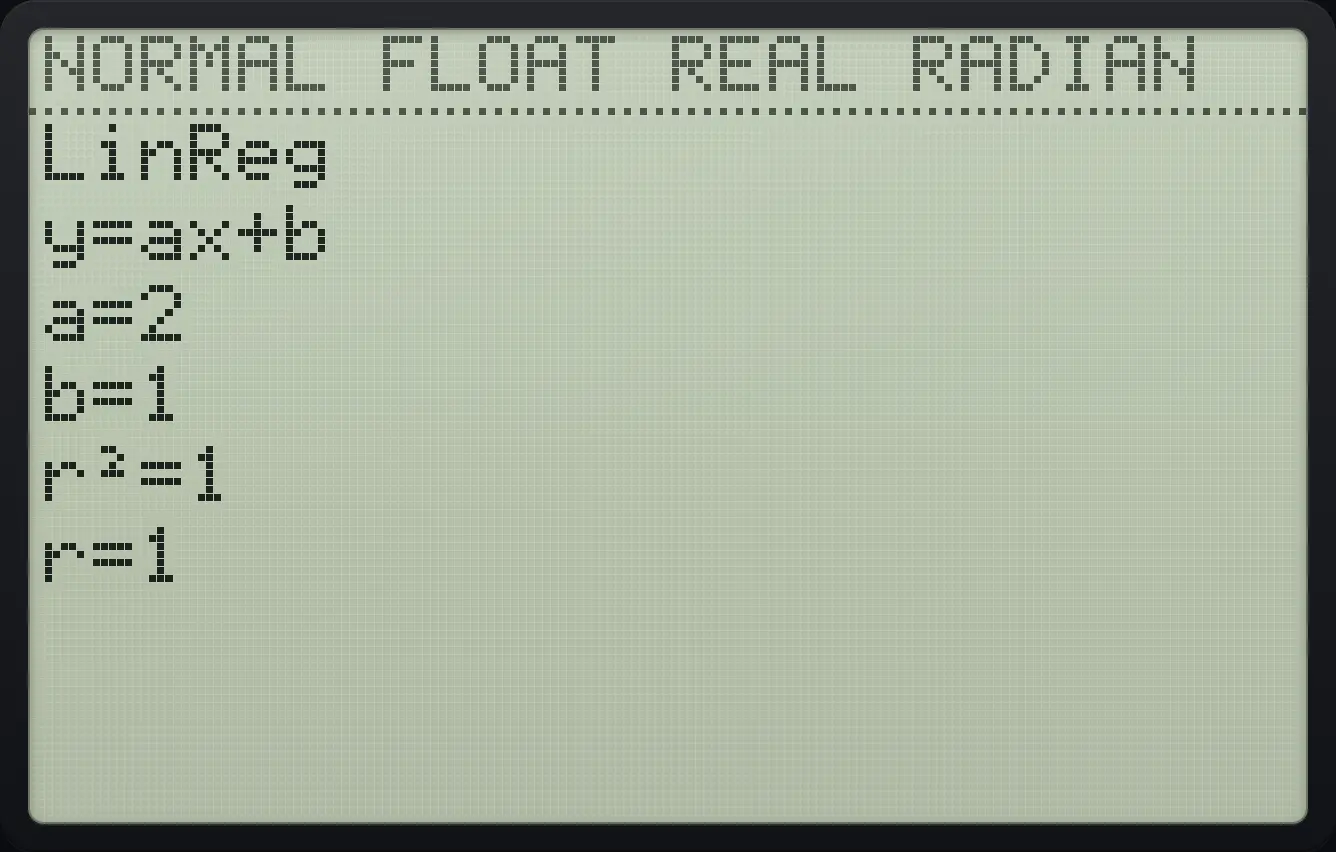
y=ax+b a=2 b=1 r²=1 r=1A line through scattered data
L1 = 1 to 5, L2 = 2, 4, 5, 4, 5.
stat11enter2enter3enter4enter5enter▶2enter4enter5enter4enter5enterRun LinReg(ax+b).
stat▶4▼▼▼▼enter
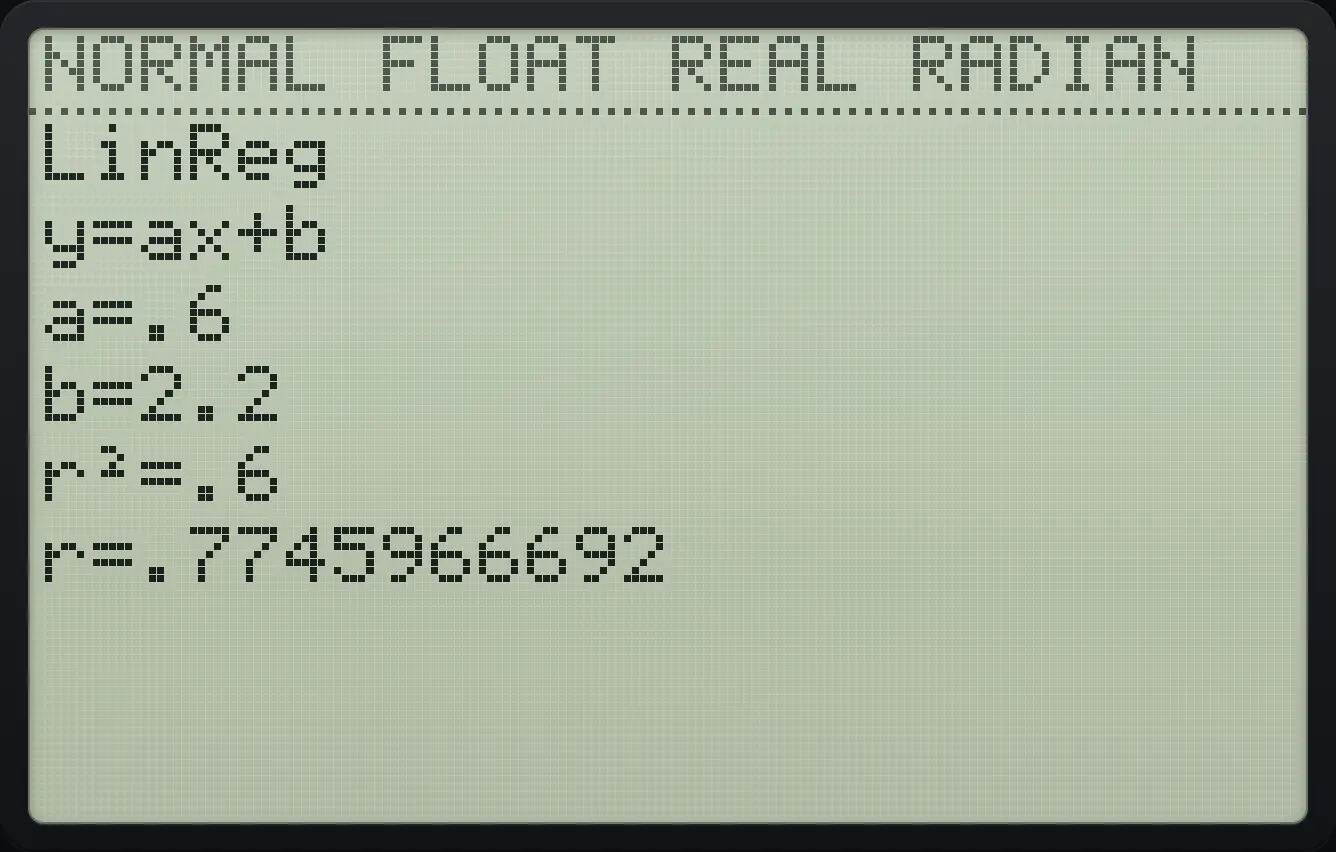
a=.6 b=2.2 r²=.6 r=.7745966692r is the correlation coefficient: close to 1 or −1 means a strong straight-line pattern, close to 0 means none. r² is the share of the variation the line explains. These lines appear when STAT DIAGNOSTICS is ON in MODE.
The other form y = a + bx
Use the same L1 and L2 as above (exact data), and choose item 8.
stat11enter2enter3enter4enter▶3enter5enter7enter9enterstat▶8▼▼▼▼enter
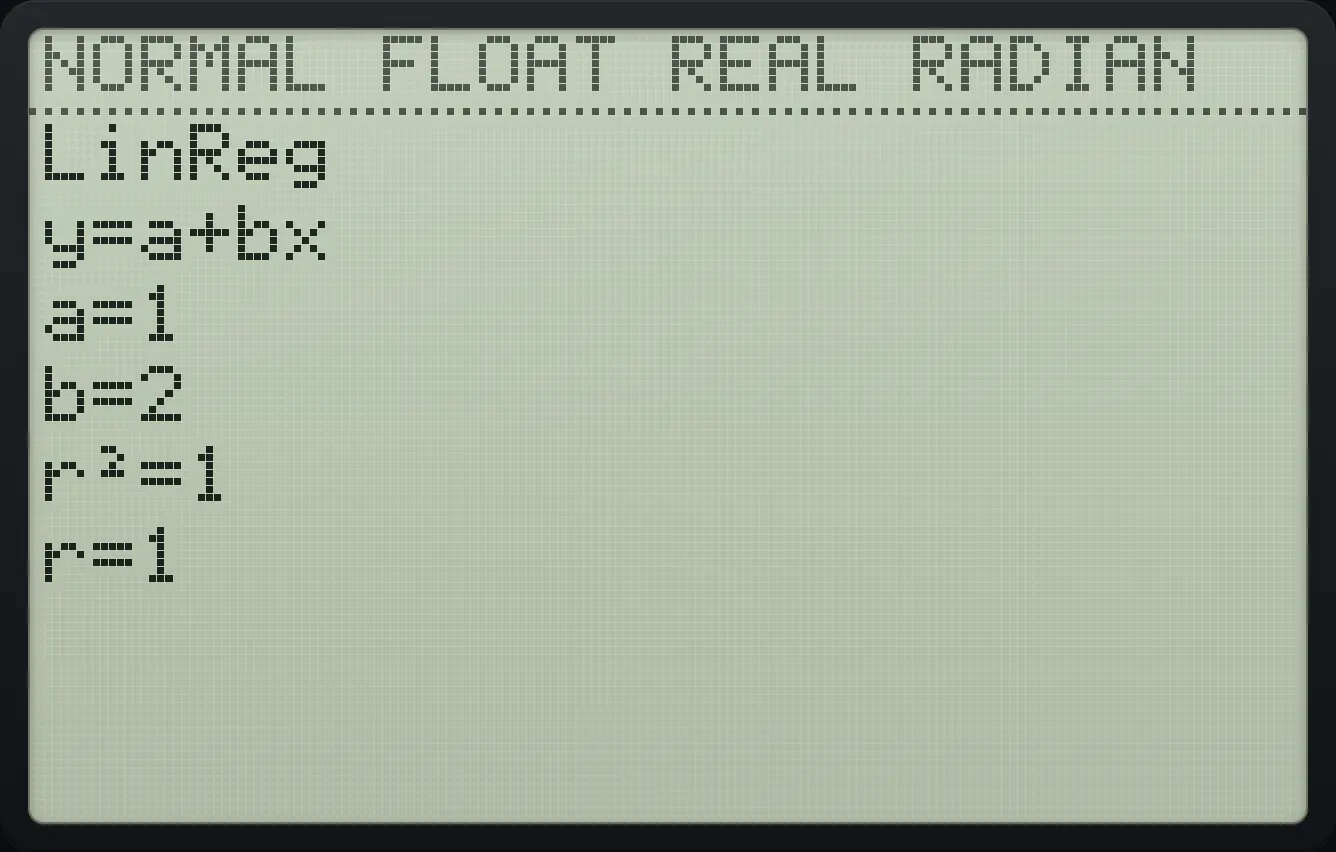
y=a+bx a=1 b=2A resistant line (Med-Med)
L1 = 1 to 6, L2 = 2, 4, 6, 8, 10, 12, then item 3.
stat11enter2enter3enter4enter5enter6enter▶2enter4enter6enter8enter10enter12enterstat▶3▼▼▼▼enter
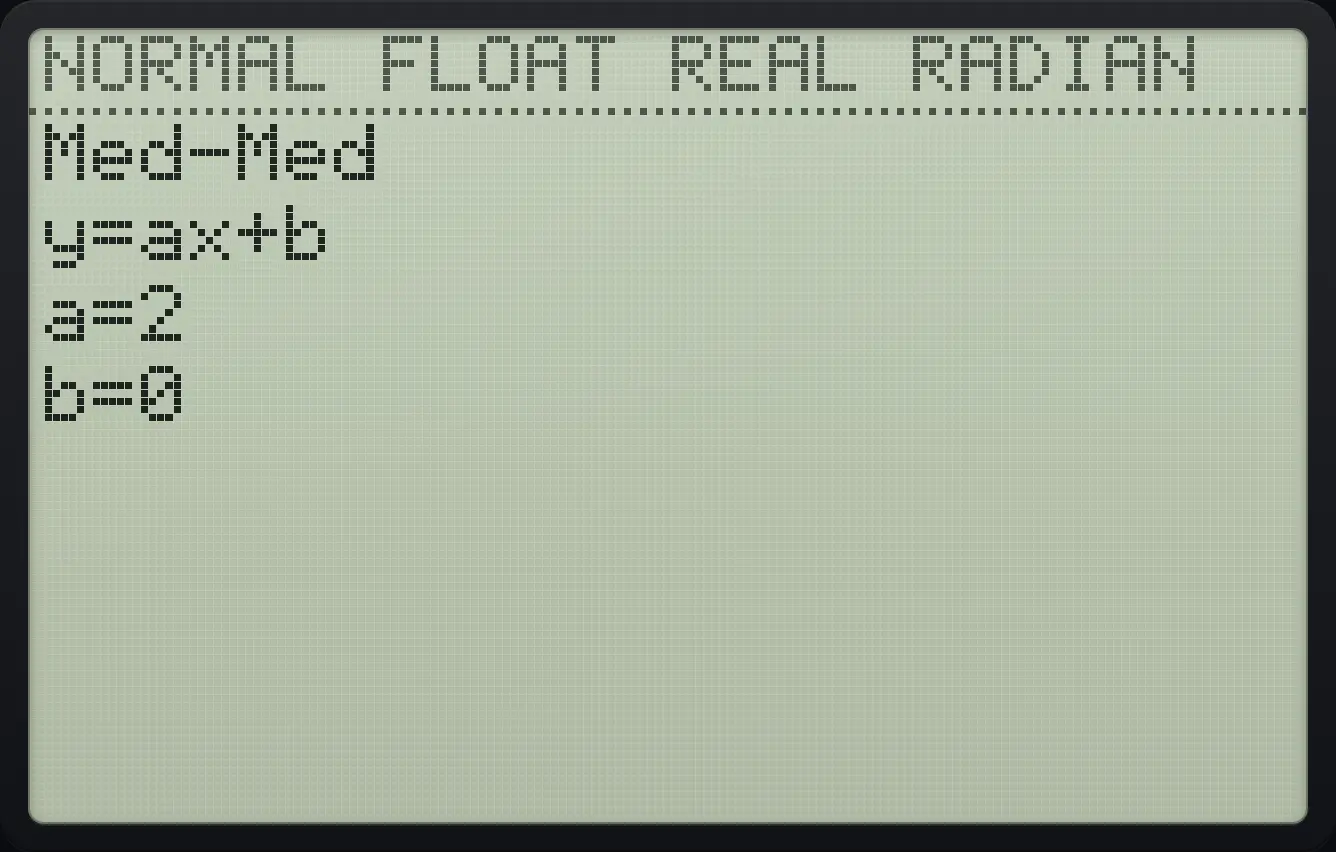
y=ax+b a=2 b=014.3Store the regression equation in Y=#
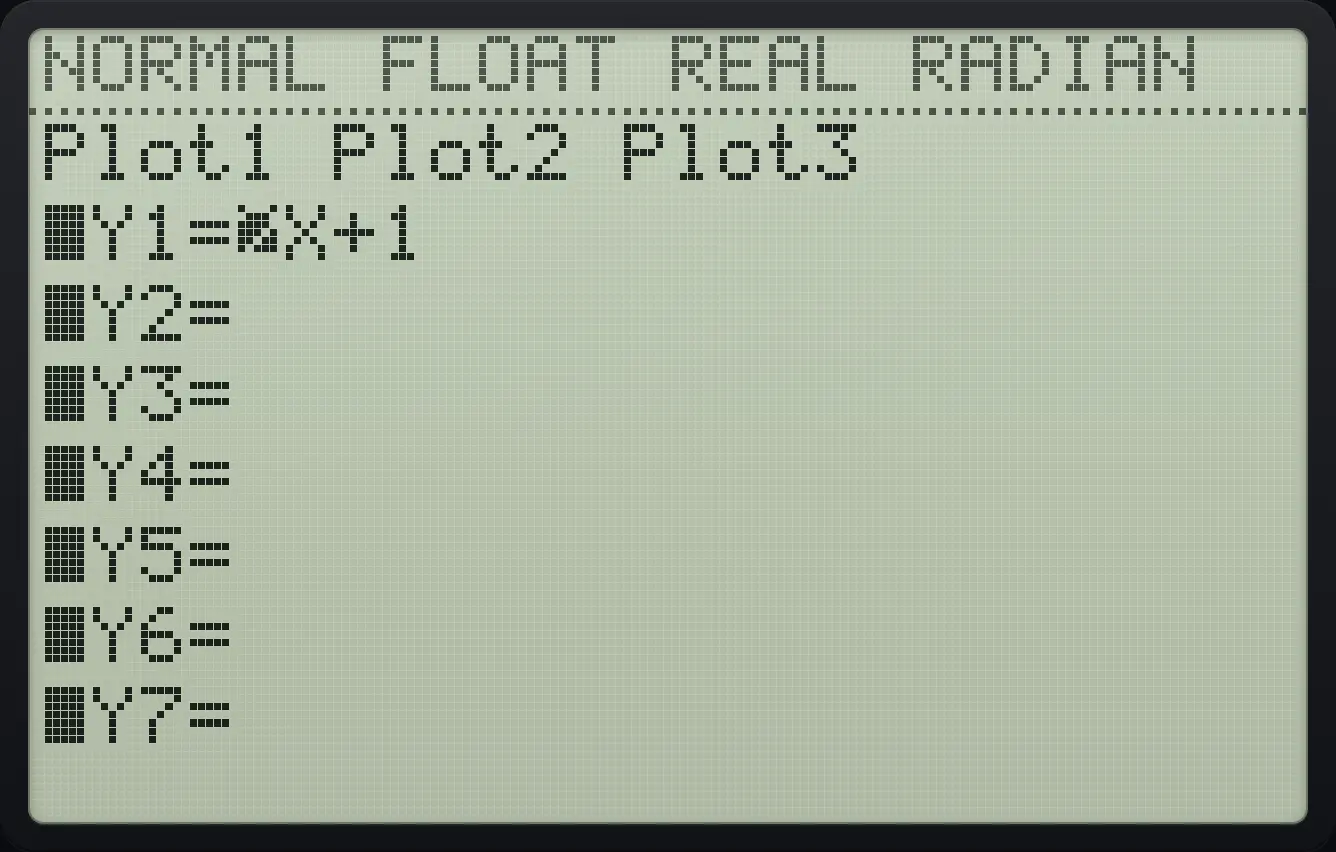
The Store RegEQ field puts the equation into a Y= slot so you can graph it. Move down to that field, press vars, ▶, 1, 1 to paste Y1, then move down and run the command. Even without storing, the last equation is available as RegEQ in vars, 5 (Statistics…), EQ tab.
Put the line into Y1
Enter the data L1 = 1…4 and L2 = 3, 5, 7, 9. Open LinReg(ax+b) and move down to Store RegEQ.
stat11enter2enter3enter4enter▶3enter5enter7enter9enterstat▶4▼▼▼Paste Y1 with vars, right, 1, 1, then down and enter to calculate.
vars▶11▼enterOpen Y=.
y=
■Y1=2X+1Predict with RegEQ
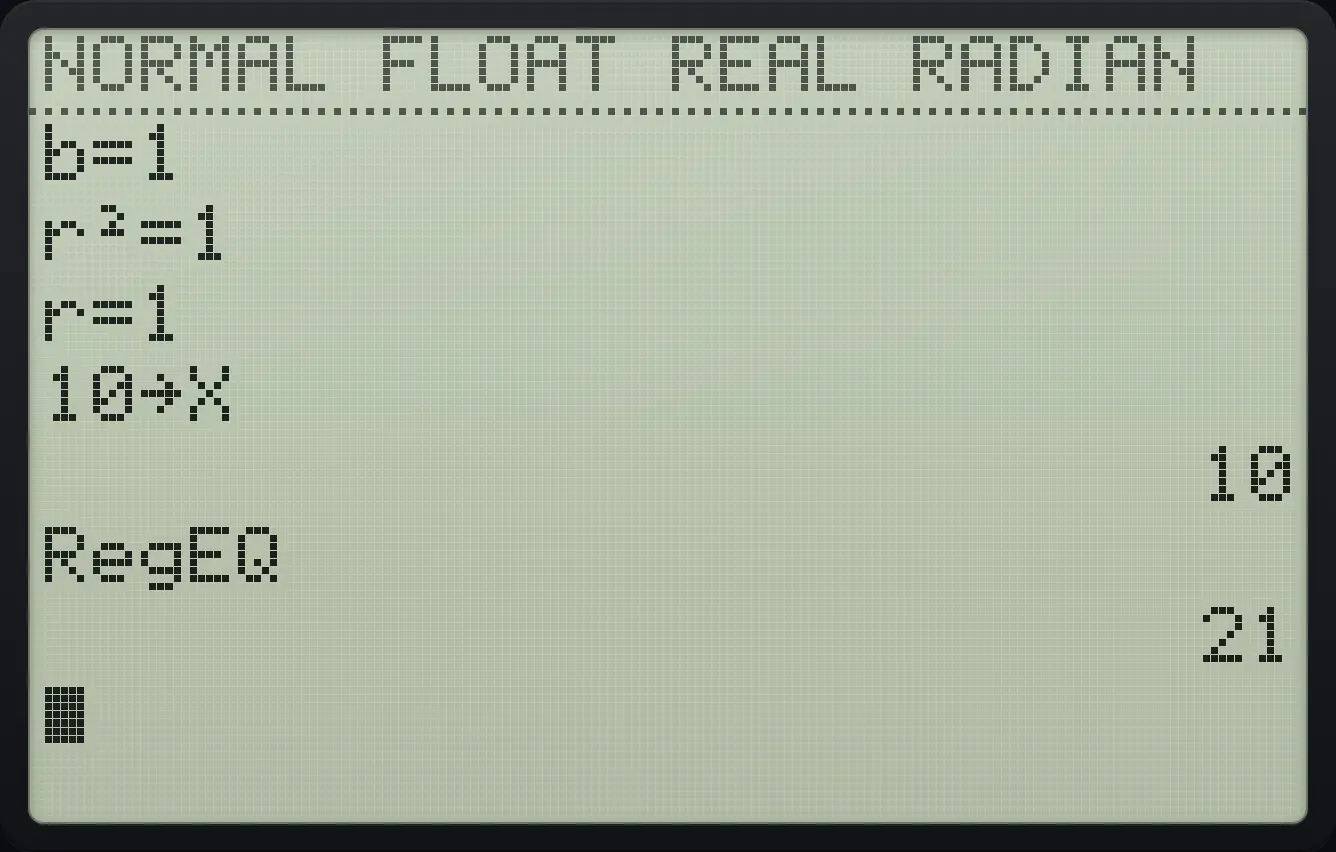
Run LinReg(ax+b) on the same data and leave with clear.
stat11enter2enter3enter4enter▶3enter5enter7enter9enterstat▶4▼▼▼▼enterclearStore 10 in X. Press vars, 5, right, right, 1 (RegEQ) and enter.
10sto→X,T,θ,nentervars5▶▶1enter
2114.4Fit a parabola, cubic, exponential, power or logarithm#
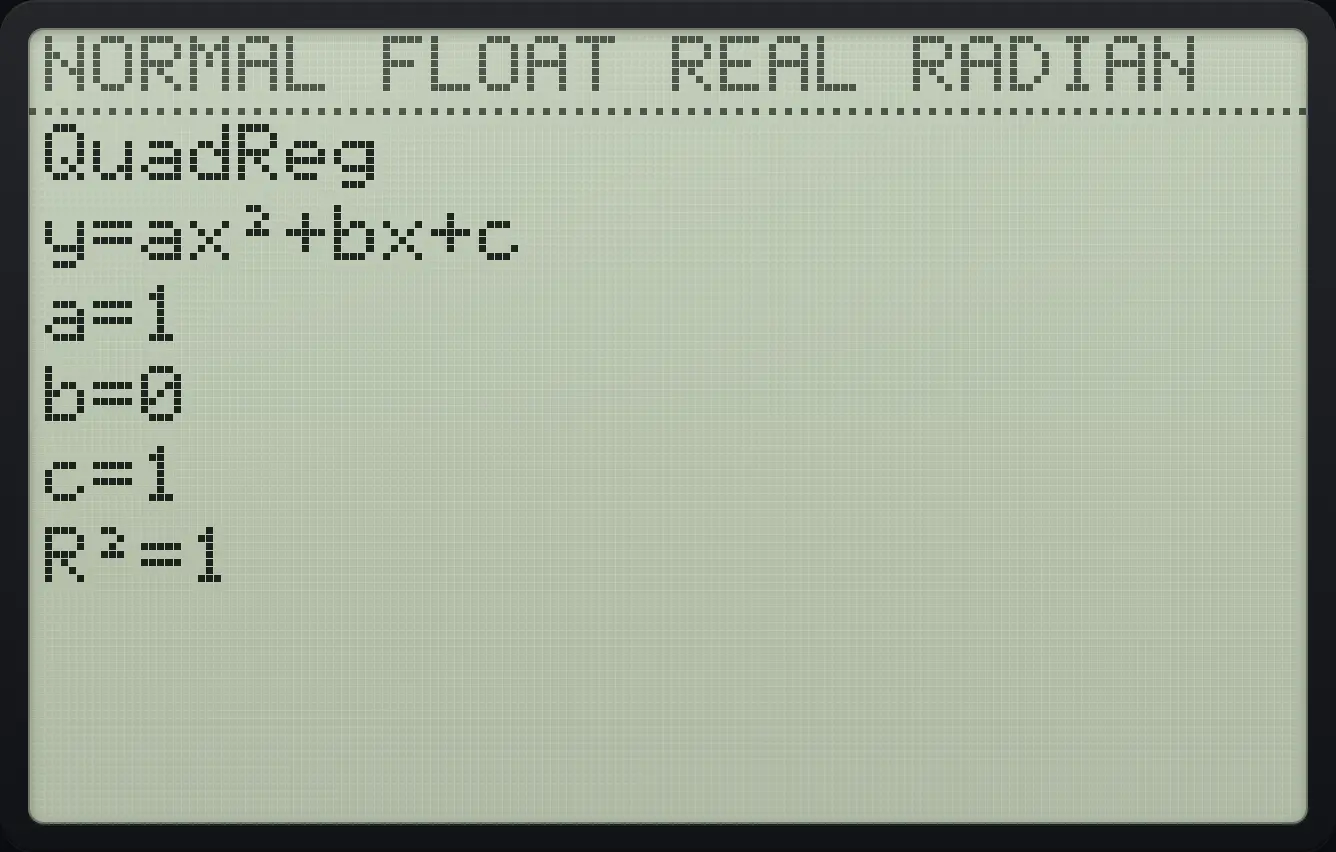
Quadratic regression
L1 = 0, 1, 2, 3 and L2 = 1, 2, 5, 10, then CALC item 5.
stat10enter1enter2enter3enter▶1enter2enter5enter10enterstat▶5▼▼▼▼enter
y=ax²+bx+c a=1 b=0 c=1 R²=1Cubic regression
L1 = 0 to 4 and L2 = 0, 1, 8, 27, 64, then item 6.
stat10enter1enter2enter3enter4enter▶0enter1enter8enter27enter64enterstat▶6▼▼▼▼enter
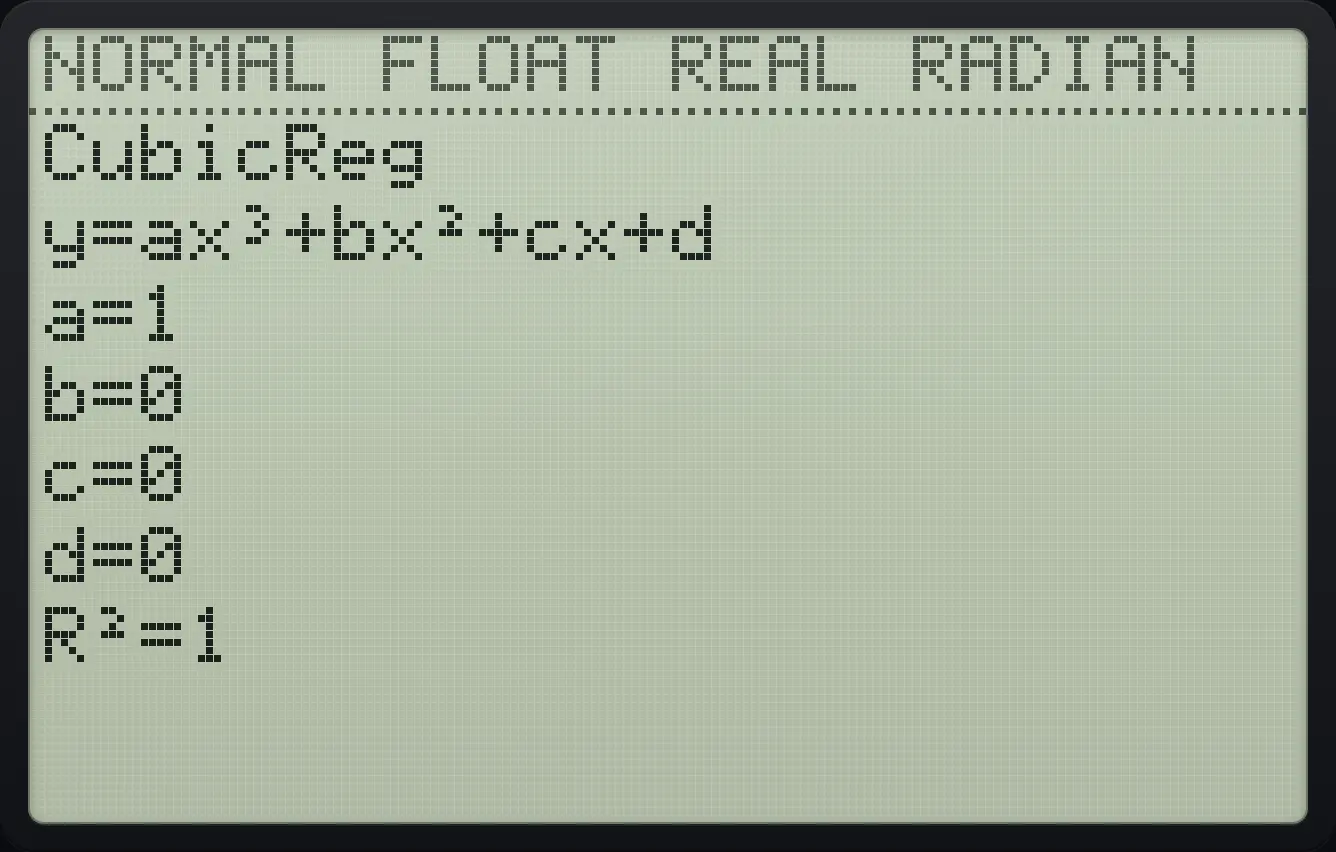
a=1 b=0 c=0 d=0Exponential regression
L1 = 0 to 3 and L2 = 3, 6, 12, 24, then item 0.
stat10enter1enter2enter3enter▶3enter6enter12enter24enterstat▶0▼▼▼▼enter
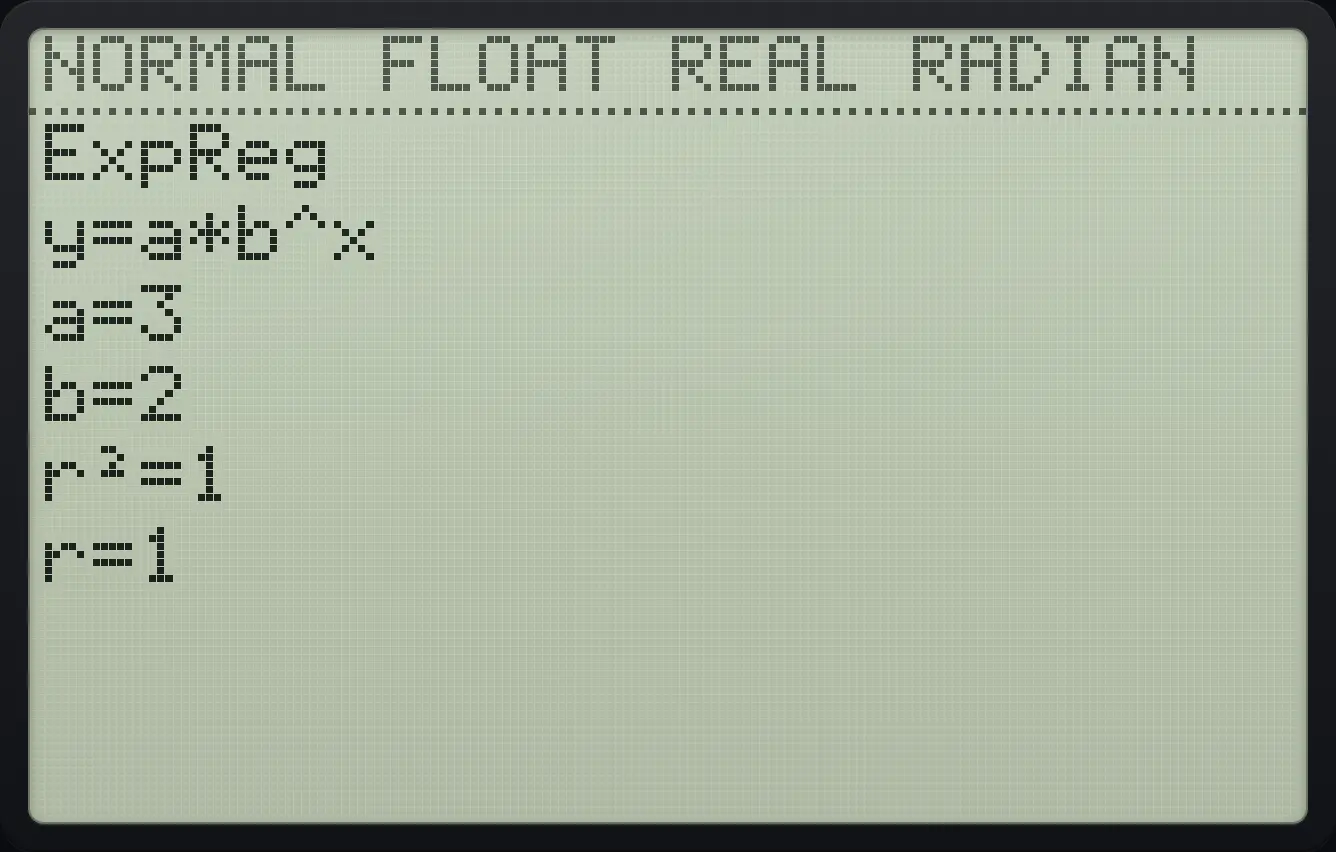
y=a*b^x a=3 b=2Power regression
L1 = 1 to 4 and L2 = 2, 8, 18, 32, then alpha math (item A).
stat11enter2enter3enter4enter▶2enter8enter18enter32enterstat▶alphaAmath▼▼▼▼enter
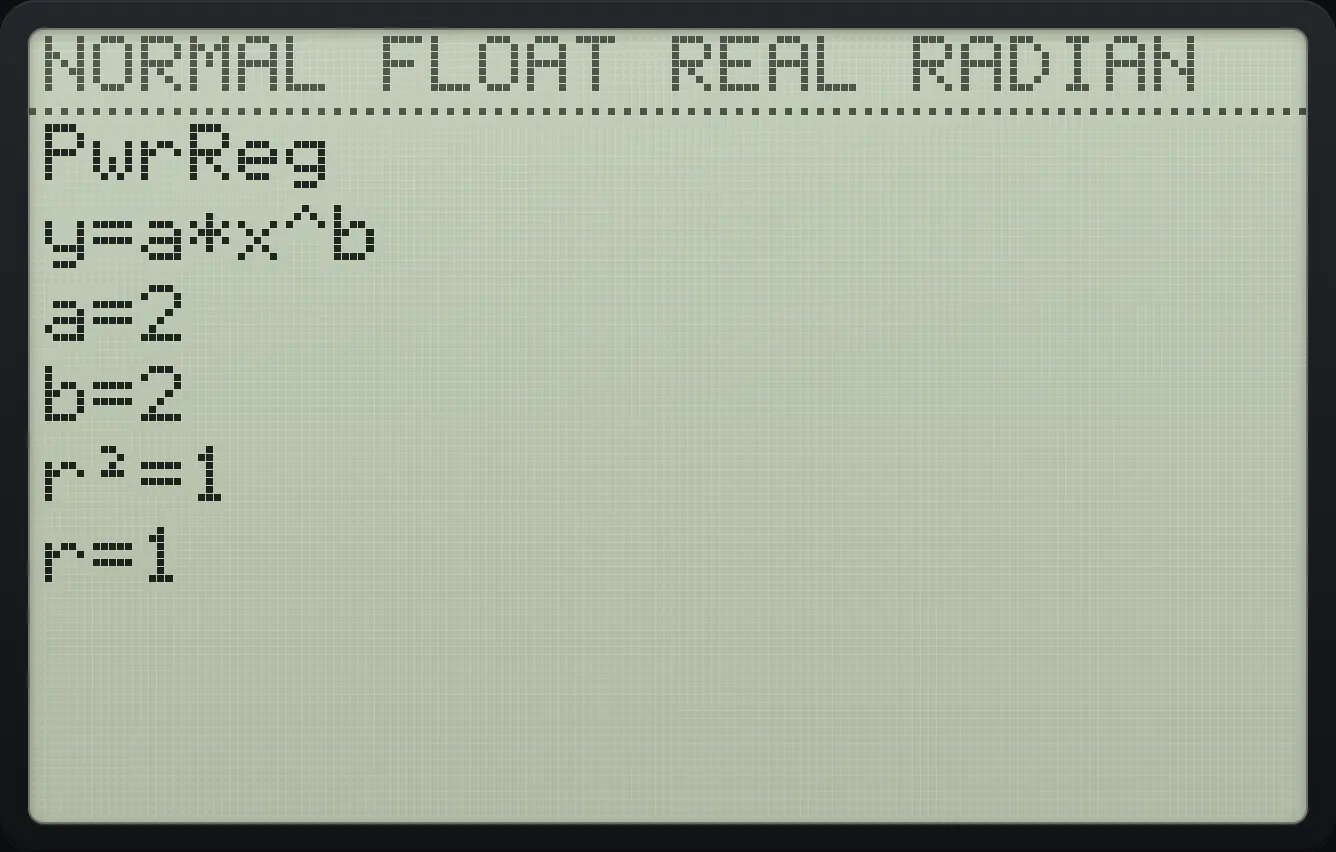
y=a*x^b a=2 b=2Logarithmic regression
L1 = 1, 2, 4, 8 and L2 = 1, 3, 5, 7, then item 9.
stat11enter2enter4enter8enter▶1enter3enter5enter7enterstat▶9▼▼▼▼enter
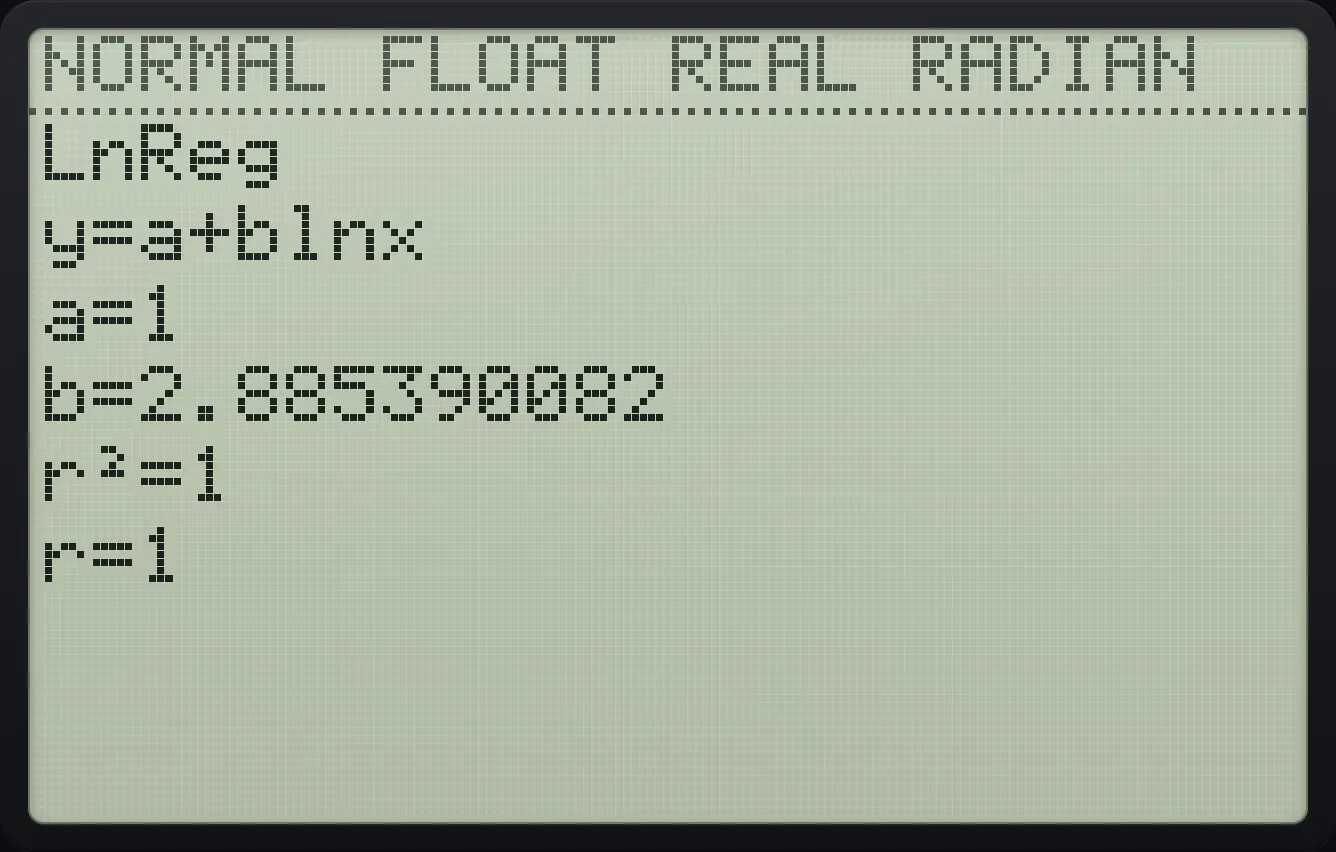
y=a+blnx a=1 b=2.885390082Lists of unequal length
L1 has three values but L2 only two. The regression refuses.
stat11enter2enter3enter▶1enter2enterstat▶4▼▼▼▼enter
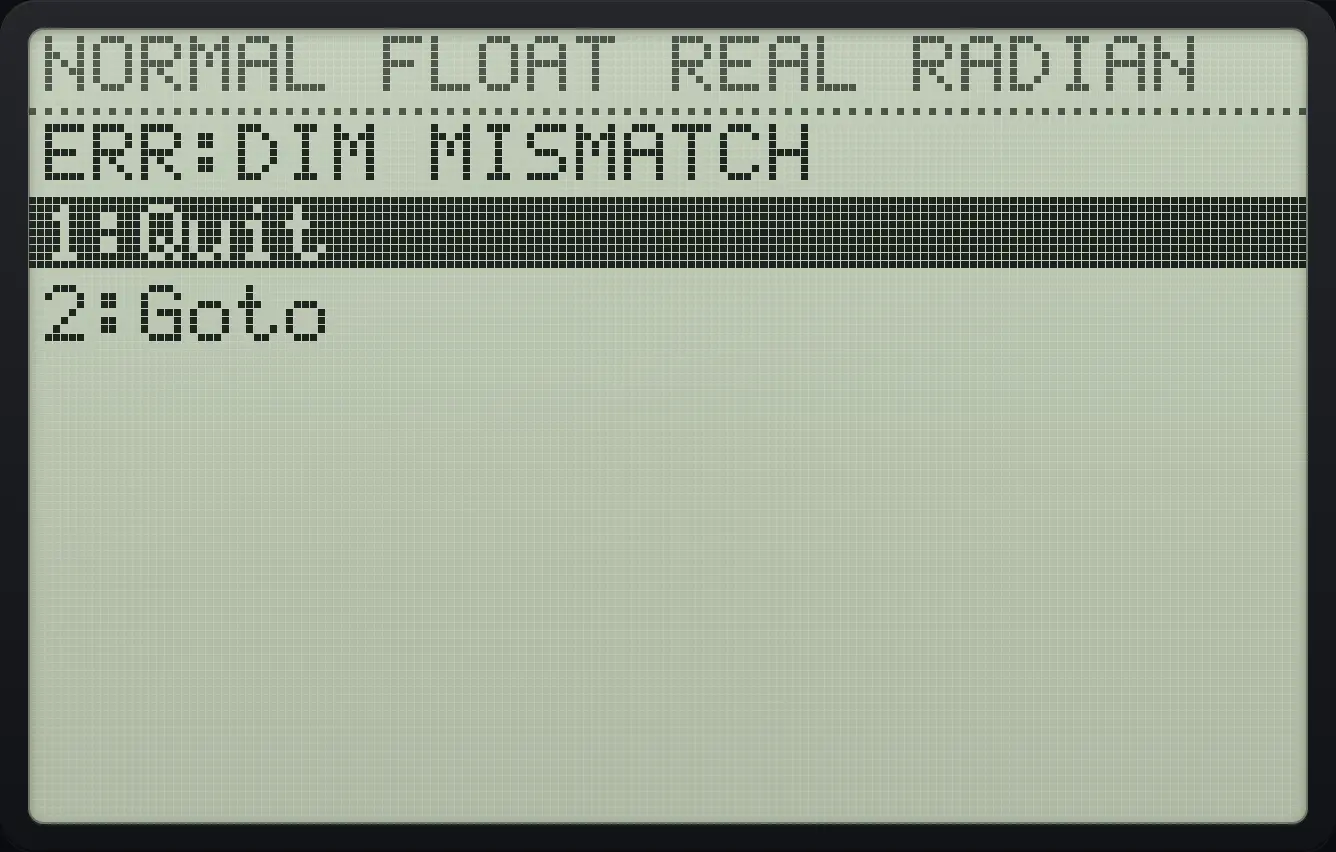
ERR:DIM MISMATCHTI-84 Plus CE is a trademark of Texas Instruments Incorporated. Trident Calculator is an independent product by South View Studios and is not affiliated with, sponsored by or endorsed by Texas Instruments. The name is used only to describe the kind of calculator this model resembles; Trident's names, keys, display, fonts and software are its own clean-room design.