
Classic Graphing 84 manual · Chapter 15 of 25
Statistics plots
Draw scatter plots, line plots, histograms and box plots of your lists, and fit the window to the data with ZoomStat.
15.1Set up a statistics plot#
Press 2ndSTAT PLOTy= (STAT PLOT). Choose Plot1, Plot2 or Plot3 to edit it; 4 PlotsOff and 5 PlotsOn switch all three. On the setup screen choose On, the plot Type, the lists to use, the mark and the colour. Turn the plot on, then press graph or use ZoomStat so the data fits the window.
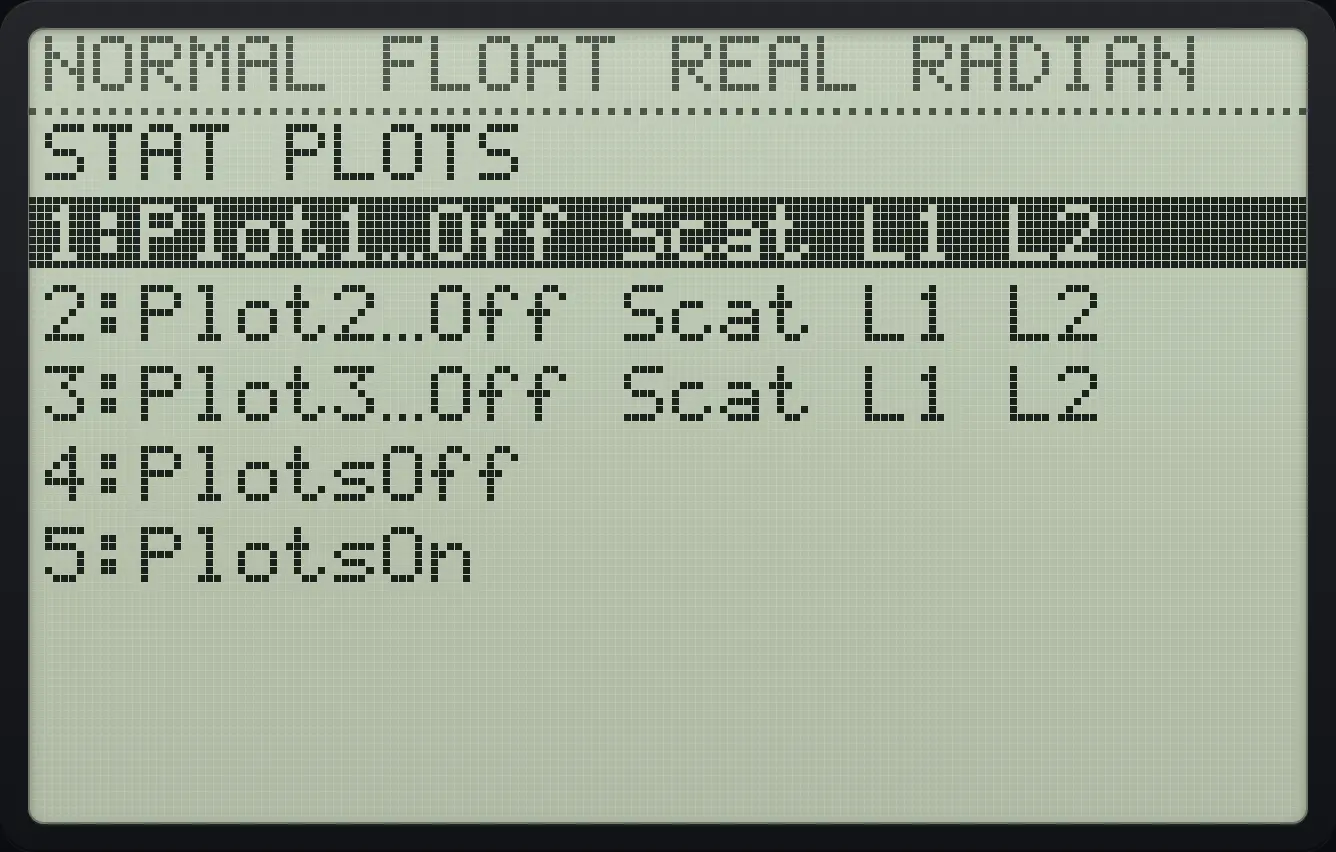
![Setting up Plot1. The display shows: [Plot1] Plot2 Plot3 / On [Off] / Type:[Sct] xyL Hst MBx Box / Xlist:L1 / Ylist:L2 / Mark:[□] + · / Color:◀BLUE▶.](/trident/app/help/manual/img/d2dc5489s.webp)
| Type | Draws |
|---|---|
| Sct (scatter) | One mark per (x, y) pair from Xlist and Ylist. |
| xyL (xy line) | The same points joined by lines. |
| Hst (histogram) | Bars of the data in Xlist; bar width is Xscl in WINDOW. Needs only an Xlist (and optional Freq). |
| MBx (modified box) | A box plot that marks outliers as separate points. |
| Box | A box plot from minimum to maximum. |
15.2Draw a scatter plot#
Scatter plot of three points
Store {1,2,3} in L1 and {2,4,5} in L2.
2nd{(1,2,32nd})sto→2ndL11enter2nd{(2,4,52nd})sto→2ndL22enterOpen STAT PLOT, choose 1, move left to On and press enter.
2ndSTAT PLOTy=1◀enter![After step 2: Open STAT PLOT, choose 1, move left to On and press enter. The display shows: [Plot1] Plot2 Plot3 / [On] Off / Type:[Sct] xyL Hst MBx Box / Xlist:L1 / Ylist:L2 / Mark:[□] + · / Color:◀BLUE▶.](/trident/app/help/manual/img/c9849b74s.webp)
Press zoom and 9 (ZoomStat), then open WINDOW to see the fitted window.
zoom9window
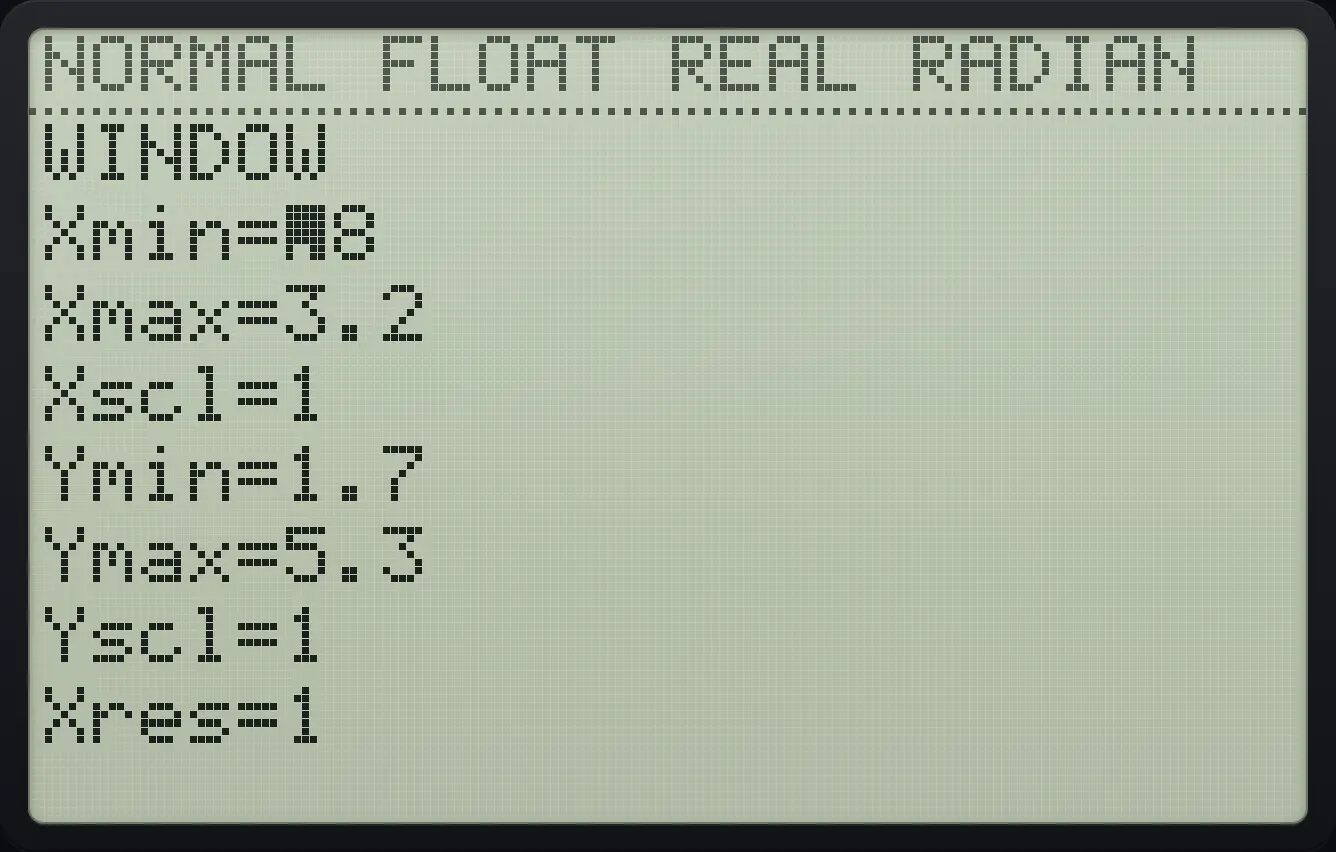
Xmin=.8
15.3Draw a histogram#
Choose Hst as the type. The width of each bar is Xscl and the first bar starts at Xmin, so set both in WINDOW (ZoomStat chooses them for you).
Choose the histogram type
Open Plot1, switch it on, move down to Type and choose Hst.
2ndSTAT PLOTy=1◀enter▼▶▶enter
![Result of the example "Choose the histogram type" The display shows: [Plot1] Plot2 Plot3 / [On] Off / Type:Sct xyL [Hst] MBx Box / Xlist:L1 / Freq:1 / Color:◀BLUE▶.](/trident/app/help/manual/img/286d41b4s.webp)
Hst]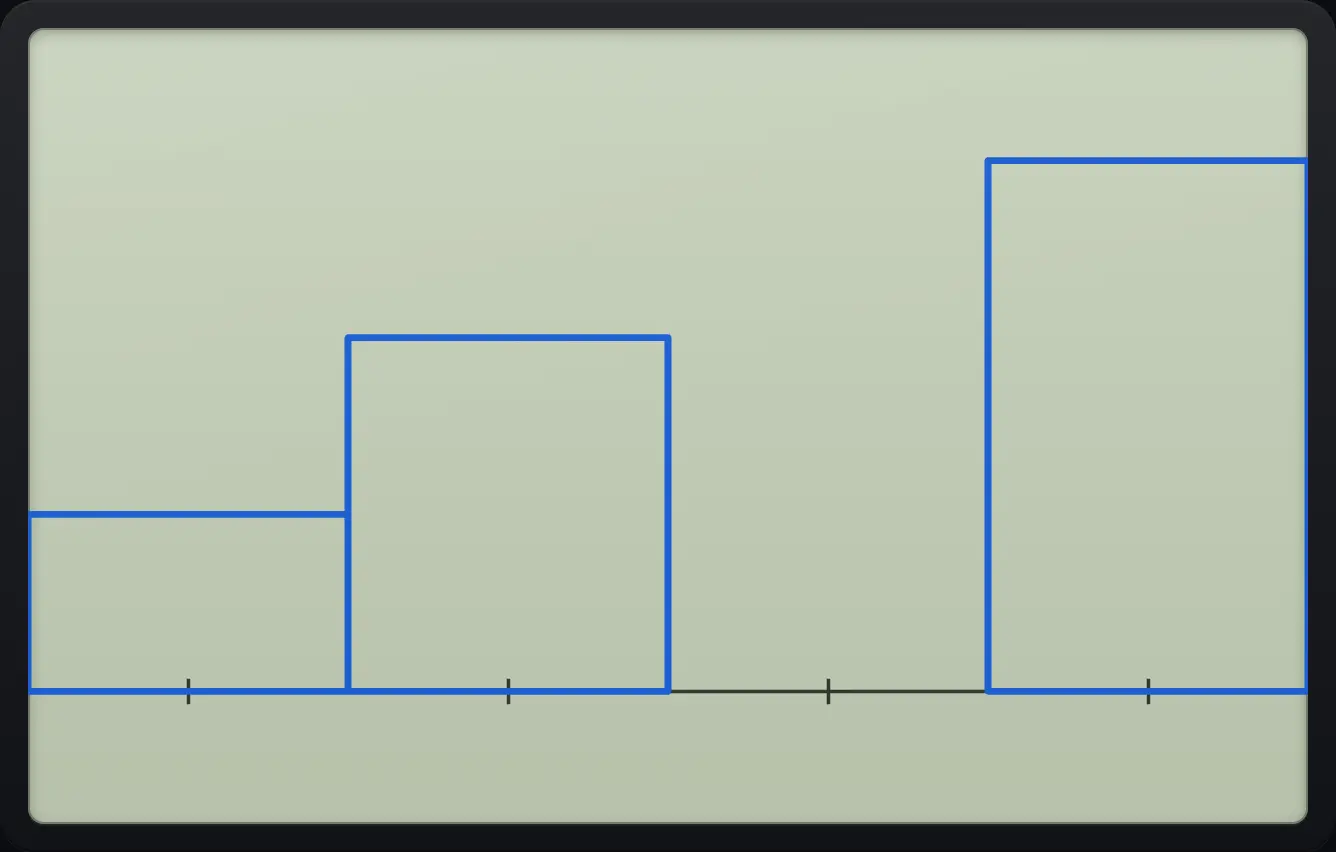
15.4Draw a box plot#
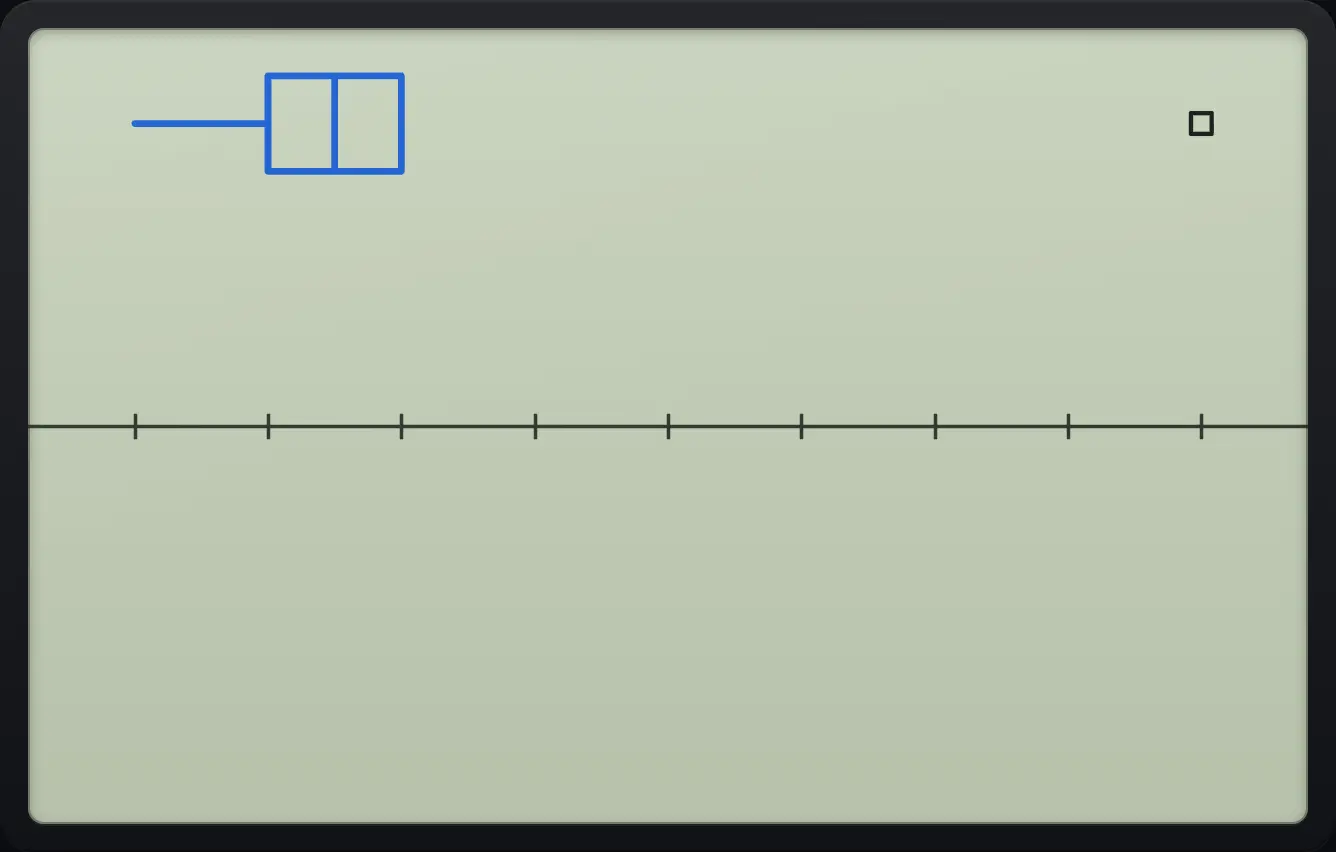
A box plot shows the minimum, first quartile Q1, median, third quartile Q3 and maximum. Use MBx to see outliers (values more than beyond the box) as separate dots.
15.5Switch all plots on or off#
PlotsOn
Press 2nd yeq then 5 (PlotsOn), then open the menu again.
2ndSTAT PLOTy=52ndSTAT PLOTy=
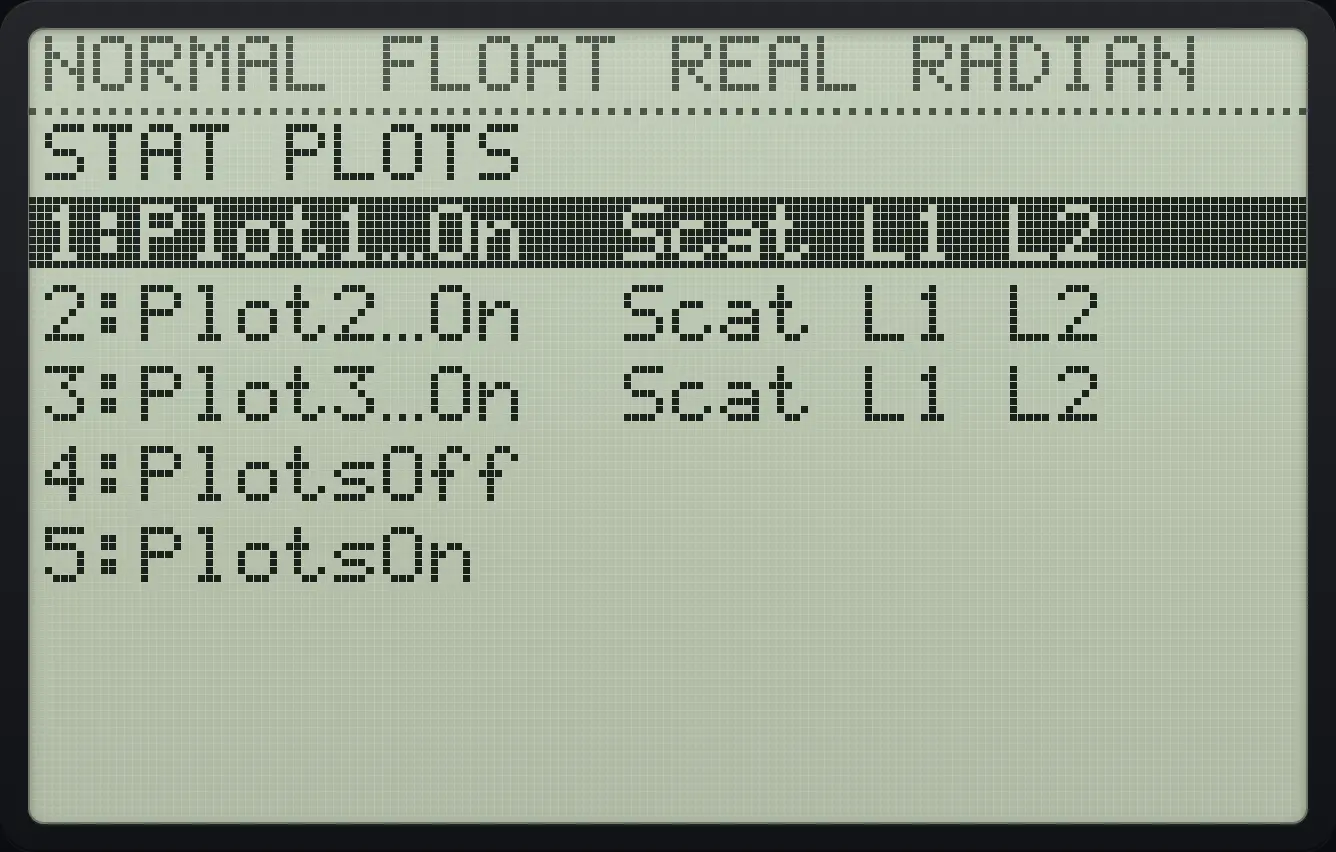
3:Plot3…OnTI-84 Plus CE is a trademark of Texas Instruments Incorporated. Trident Calculator is an independent product by South View Studios and is not affiliated with, sponsored by or endorsed by Texas Instruments. The name is used only to describe the kind of calculator this model resembles; Trident's names, keys, display, fonts and software are its own clean-room design.