
Classic Graphing 84 manual · Chapter 10 of 25
Trace and the CALCULATE tools
Move along a graph with TRACE, jump to an x value, and use CALCULATE to find values, zeros, minimums, maximums, intersections, slopes and areas.
10.1Trace a graph#
Press trace to put a cursor on the graph at the centre of the window. The equation is shown at the top and the coordinates at the bottom. ◀ and ▶ move one pixel step; ▲ and ▼ jump to another function. If you move past the edge the window scrolls with you.
Trace a curve
Graph Y1 = X²−4 and press trace.
y=X,T,θ,nx²−4▼trace
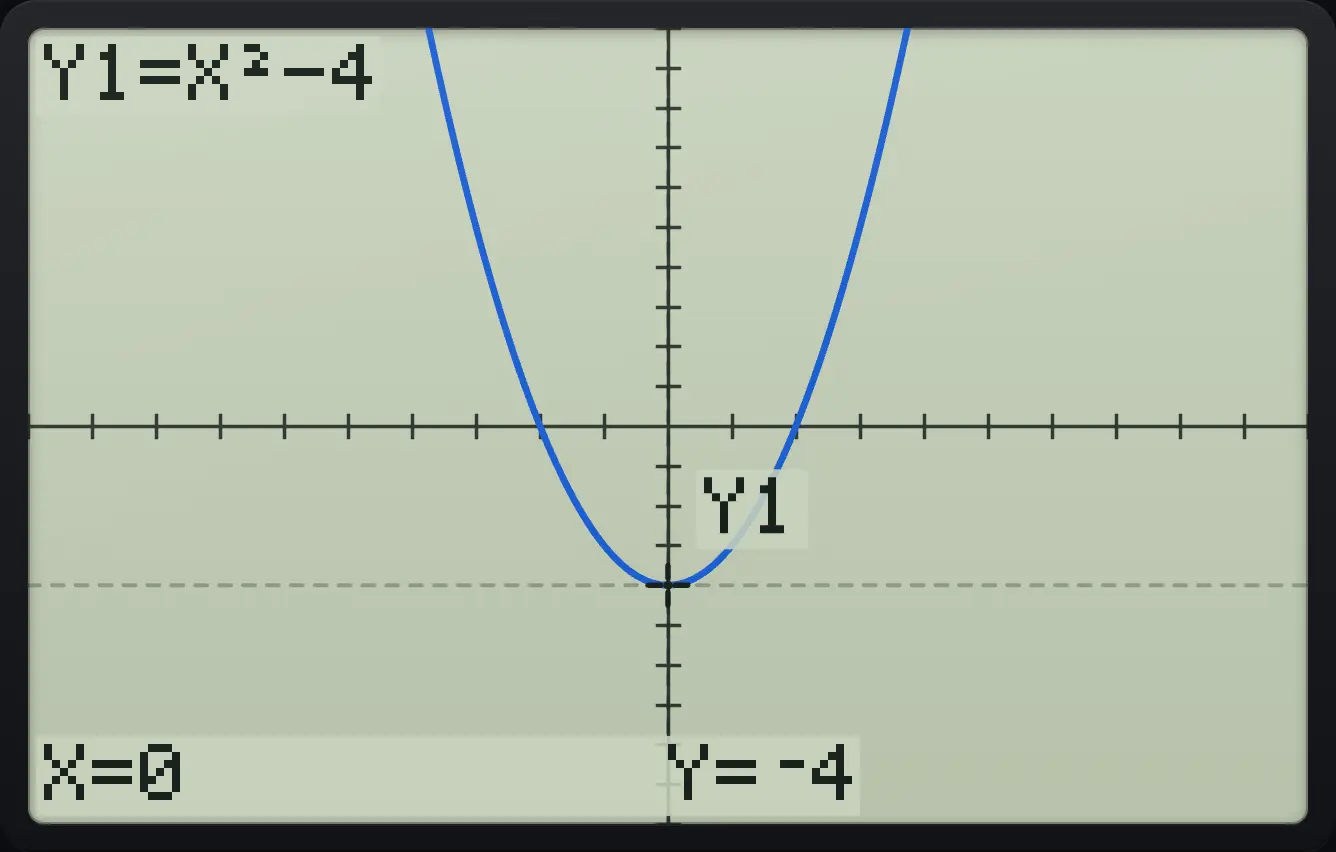
Y1=X²−4 X=0 Y=⁻4Take one step
Graph Y1 = X, press trace, then right.
y=X,T,θ,n▼trace▶
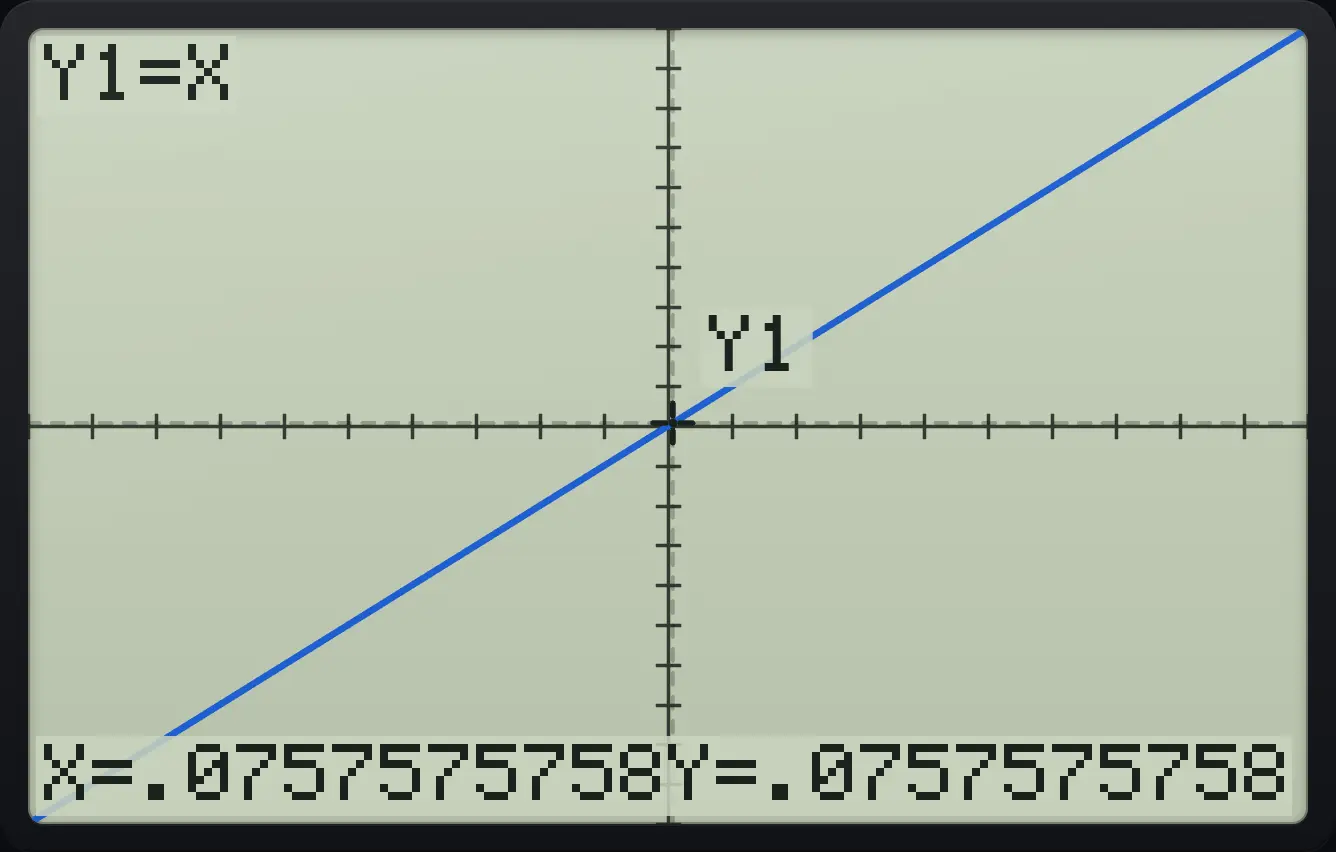
X=.0757575758Steps of exactly 0.1 in ZDecimal
Graph Y1 = X², zoom to ZDecimal, trace and press right twice.
y=X,T,θ,nx²▼zoom4trace▶▶
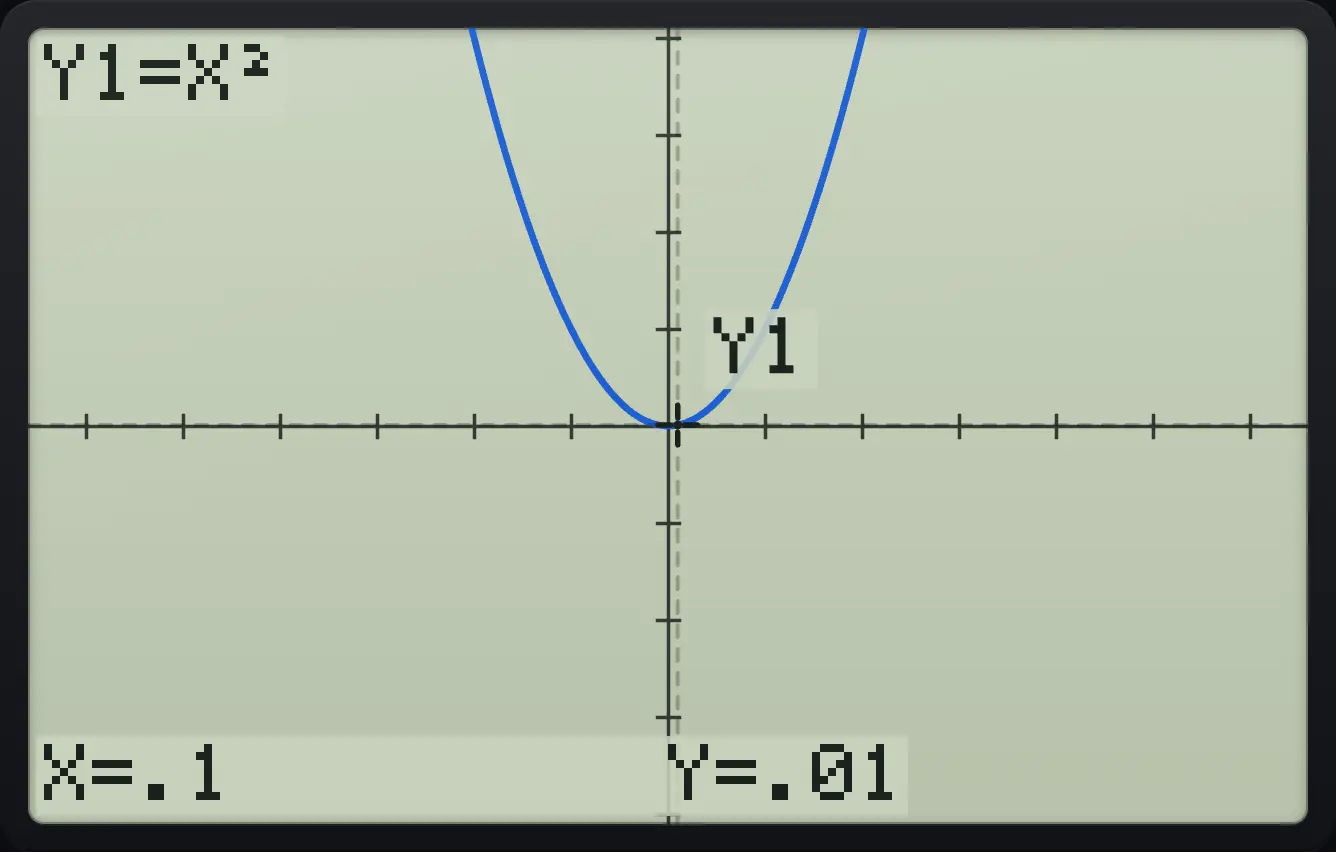
X=.1 Y=.01Jump to a value of X
Press trace, then simply type 1.5 and press enter.
y=X,T,θ,nx²−4▼trace1.5enter
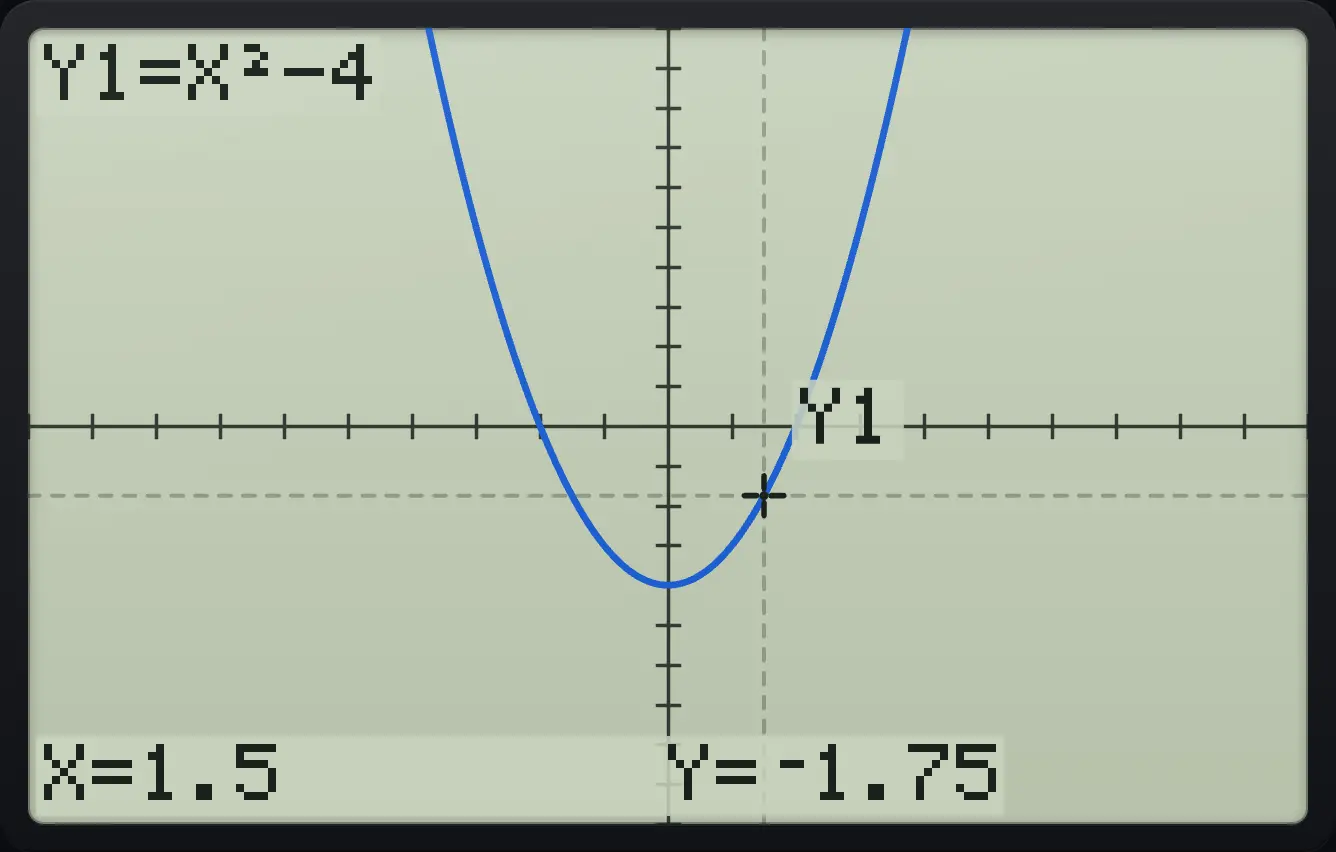
X=1.5 Y=⁻1.75Switch to the second function
Graph X² and X+2, trace to X = 1 and press down.
y=X,T,θ,nx²▼X,T,θ,n+2▼trace1enter▼
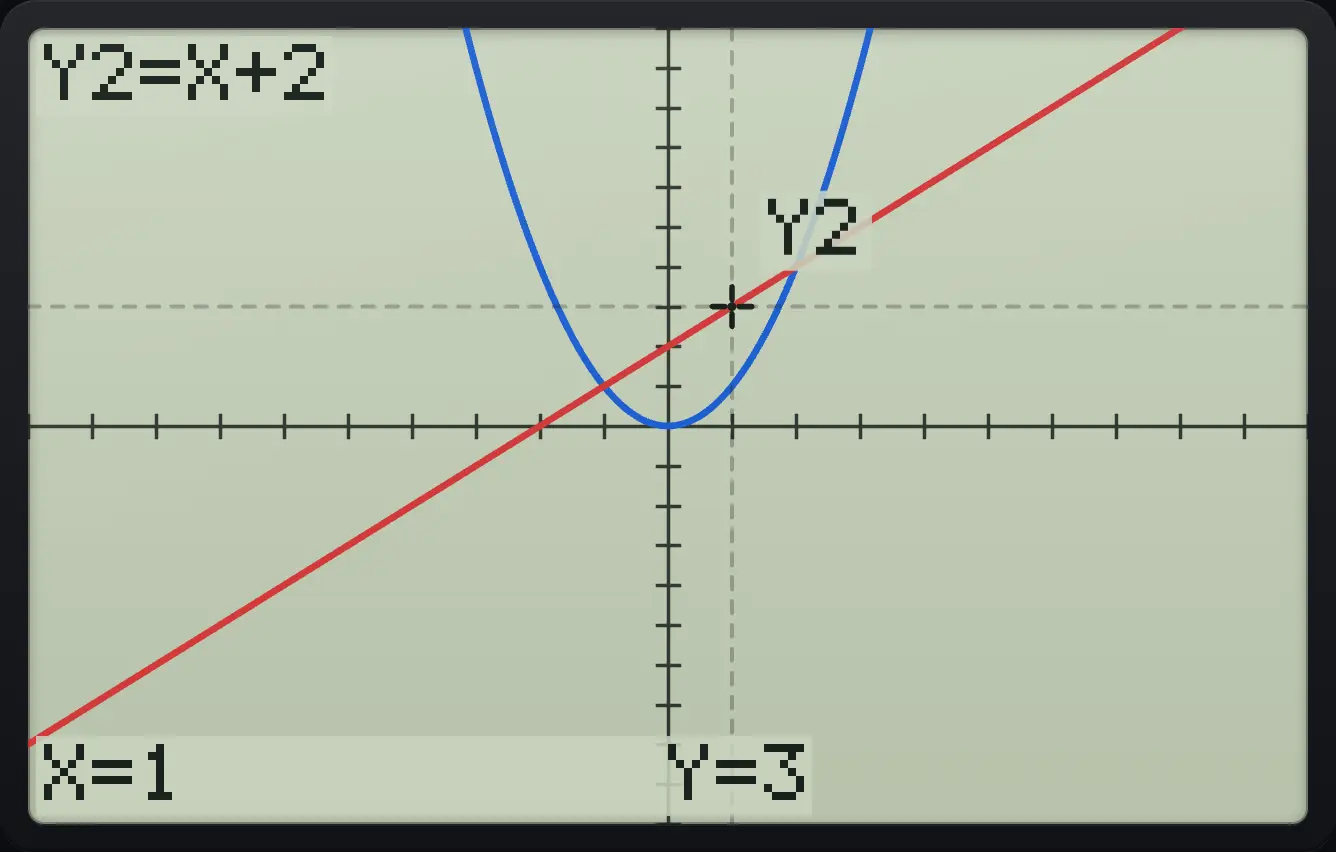
Y2=X+2 X=1 Y=3While tracing, the value of the cursor is stored in X and Y, so you can use them on the home screen afterwards. Press enter while tracing to centre the window on the cursor.
Use the traced Y afterwards
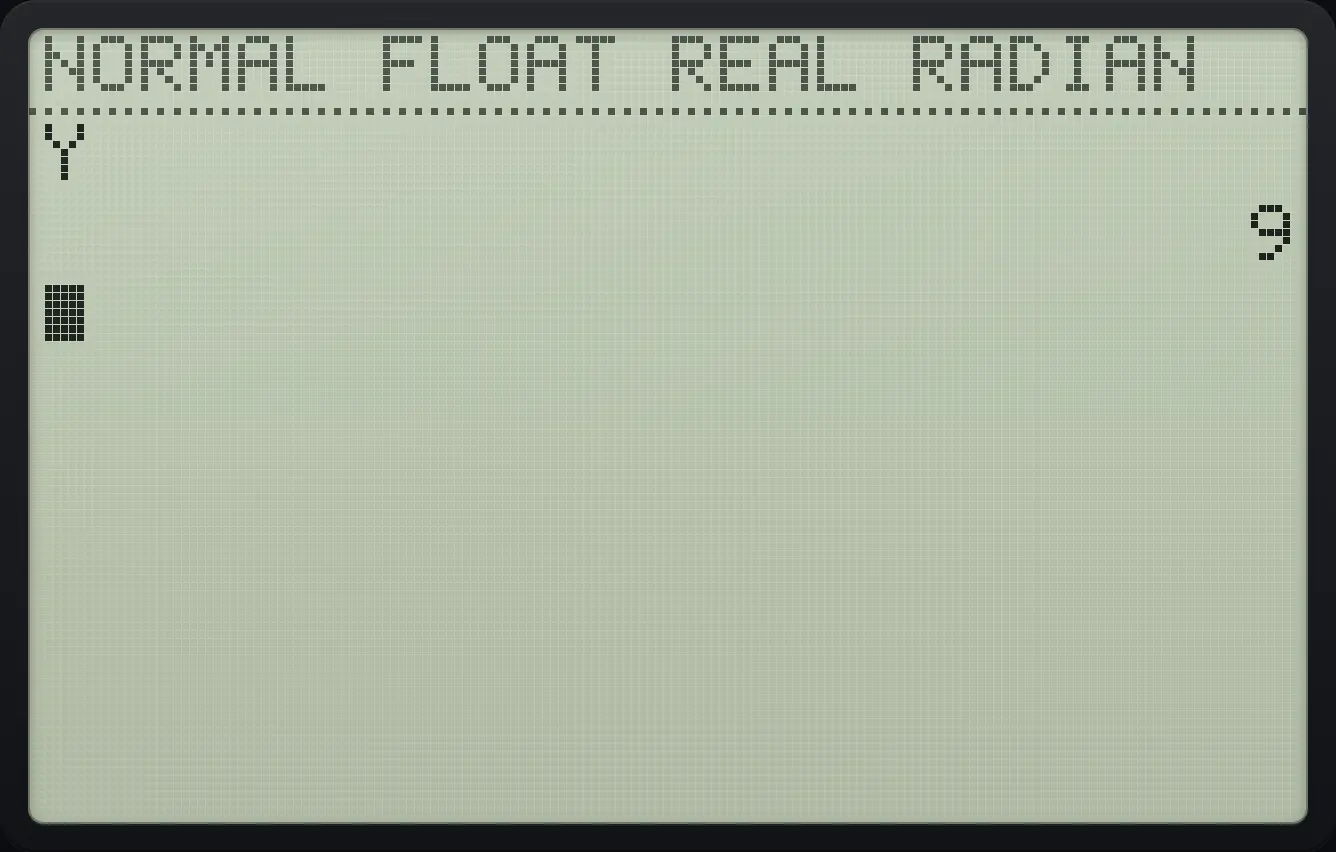
Trace Y1 = X² at X = 3.
y=X,T,θ,nx²▼trace3enterGo home and type Y.
2ndQUITmodealphaY1enter
910.2The CALCULATE menu#
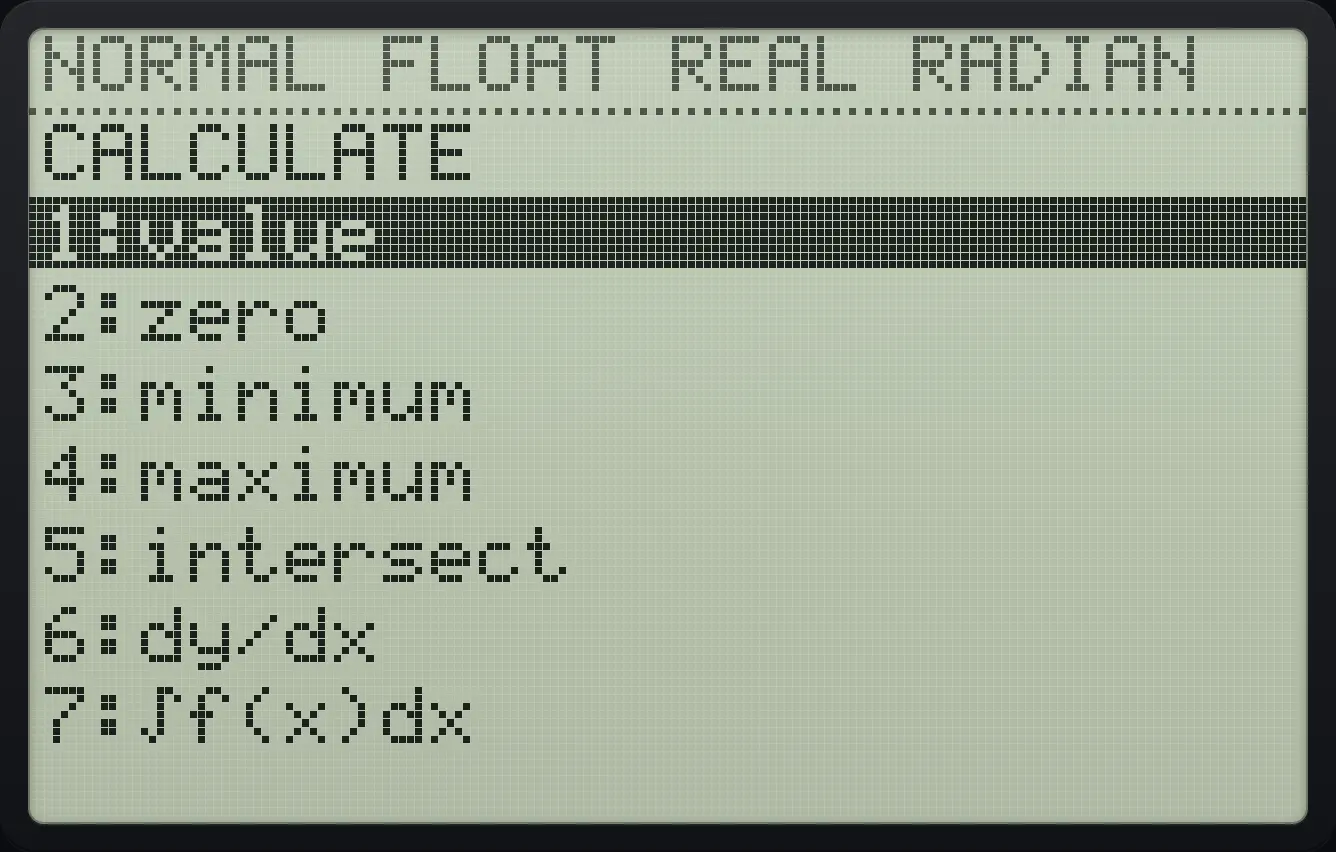
Press 2ndCALCtrace to open CALCULATE. Each tool works on the function that is shown at the top; use ▲ and ▼ to choose another one.
| Item | What it finds |
|---|---|
| 1: value | The value of the function at an x you type. |
| 2: zero | A point where the graph crosses the x-axis. |
| 3: minimum | The lowest point in an interval. |
| 4: maximum | The highest point in an interval. |
| 5: intersect | A point where two graphs cross. |
| 6: dy/dx | The slope of the curve at a point. |
| 7: ∫f(x)dx | The area under the curve between two x values. |
10.3Find the value of a function#
Value at x = 3
Graph Y1 = X²−4, press 2nd trace, 1, type 3 and press enter.
y=X,T,θ,nx²−4▼2ndCALCtrace13enter
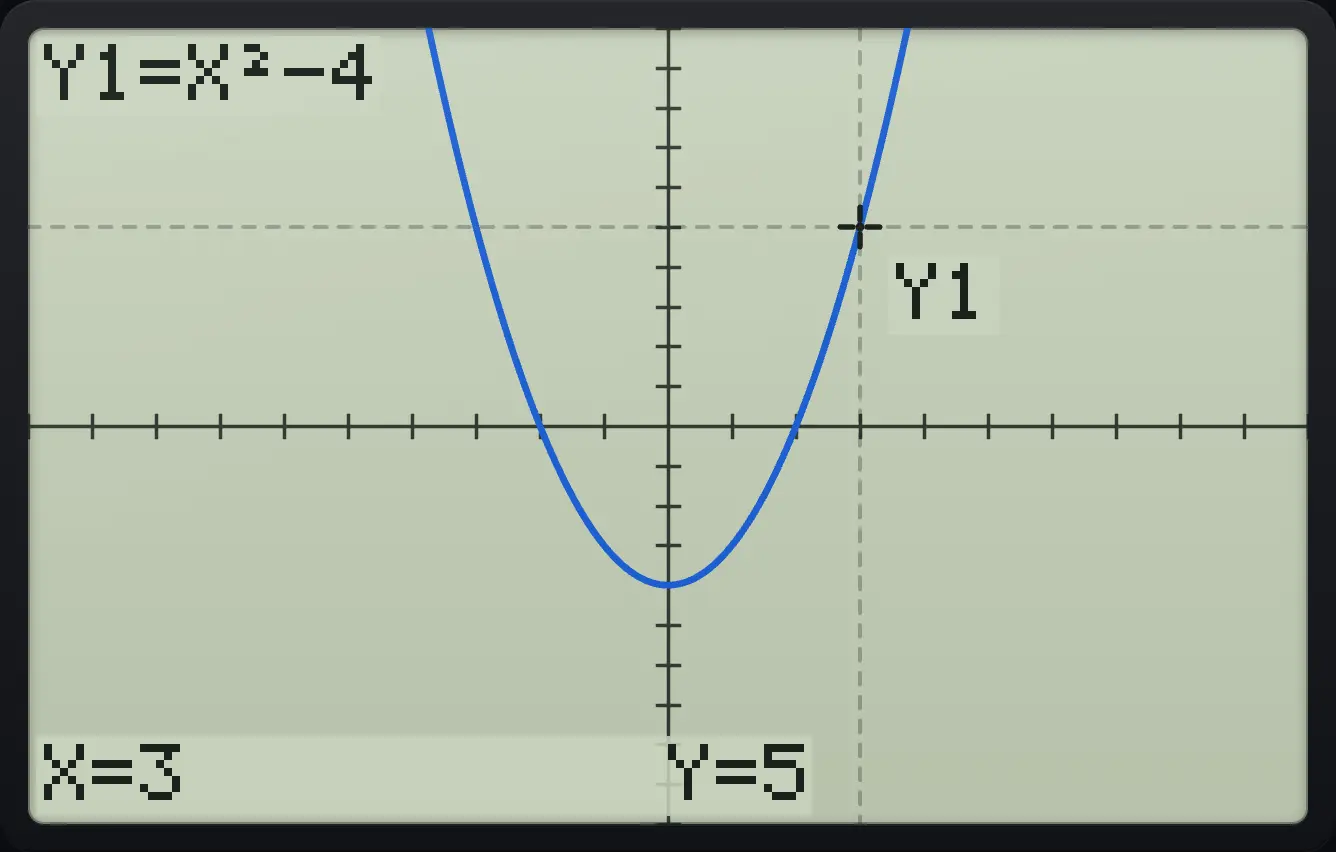
X=3 Y=510.4Find a zero (x-intercept)#
A zero is where . The calculator asks for a Left Bound, a Right Bound and a Guess: the root must lie between the bounds. Move the cursor with the arrows, or type an x value, and press enter at each prompt.
- 2ndCALCtrace
- 2:zero
- Left bound enter
- Right bound enter
- Guess enter
The negative zero of x² − 4
Graph Y1 = X²−4, press 2nd trace and 2. Type −5 for the left bound and press enter.
y=X,T,θ,nx²−4▼2ndCALCtrace2(−)5enter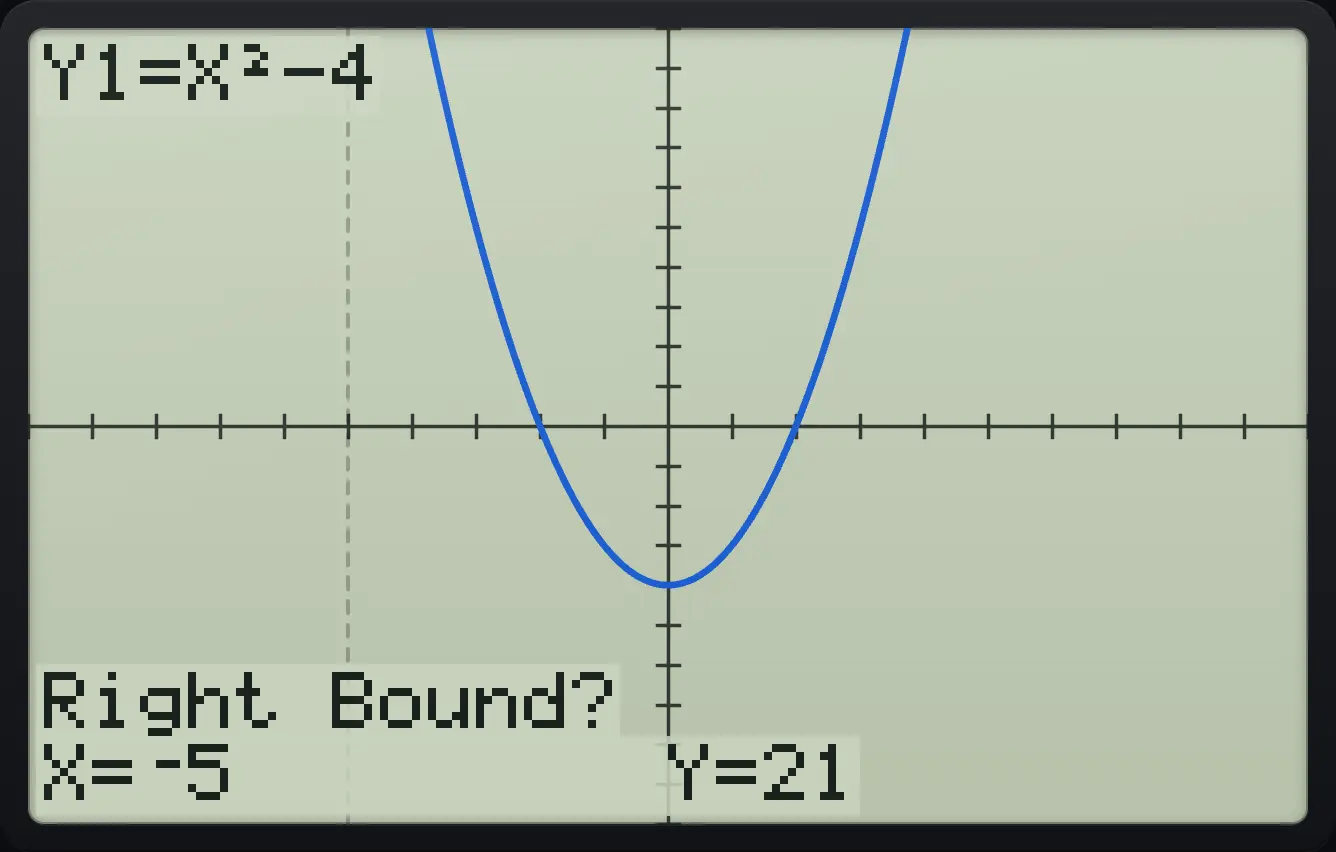
Type 0 for the right bound, enter, then enter for the guess.
0enterenter
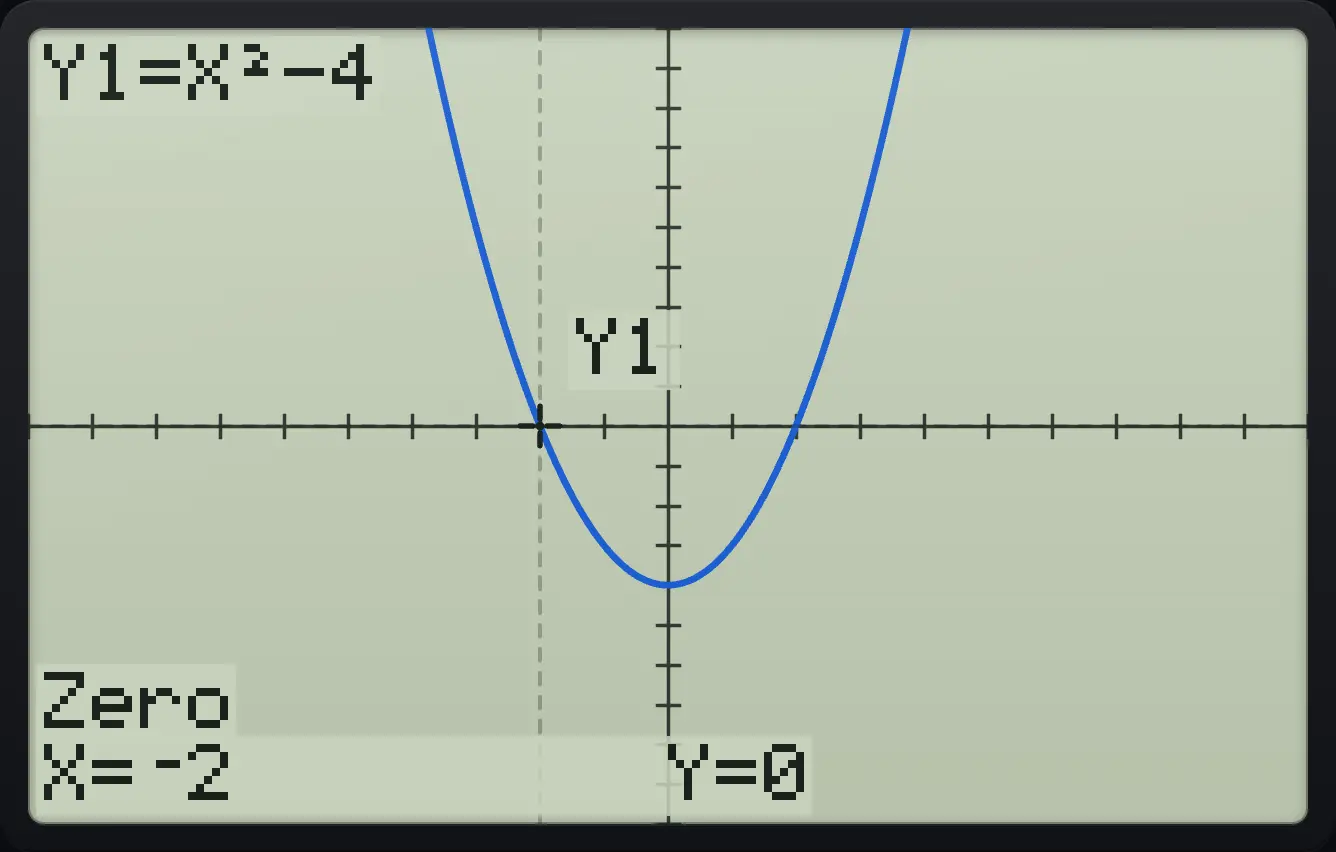
Zero X=⁻2 Y=0The positive zero
Use bounds 0 and 5.
y=X,T,θ,nx²−4▼2ndCALCtrace20enter5enterenter
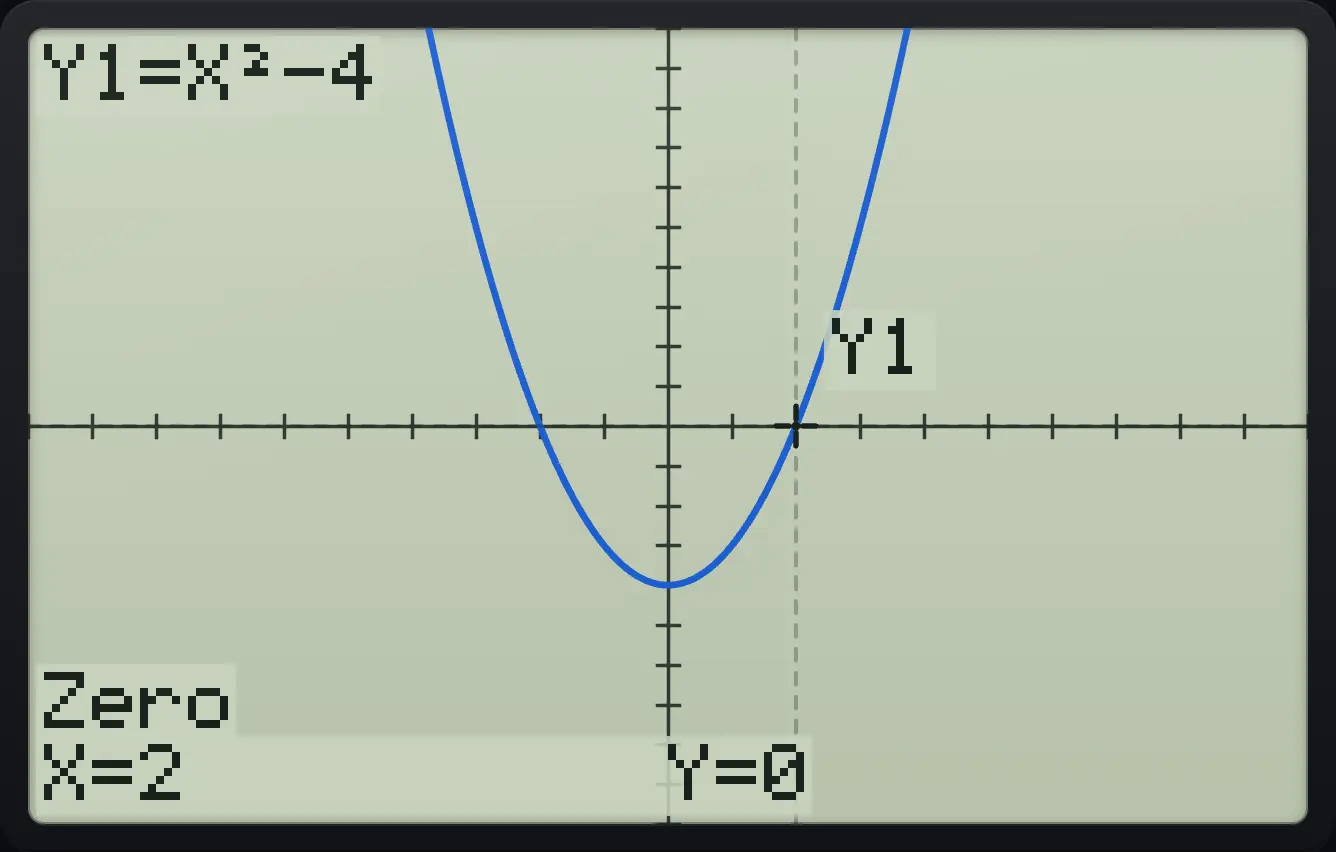
Zero X=2 Y=0A zero of sin(x)
Graph sin(X) in radians and use bounds 3 and 4.
y=sinX,T,θ,n)▼2ndCALCtrace23enter4enterenter
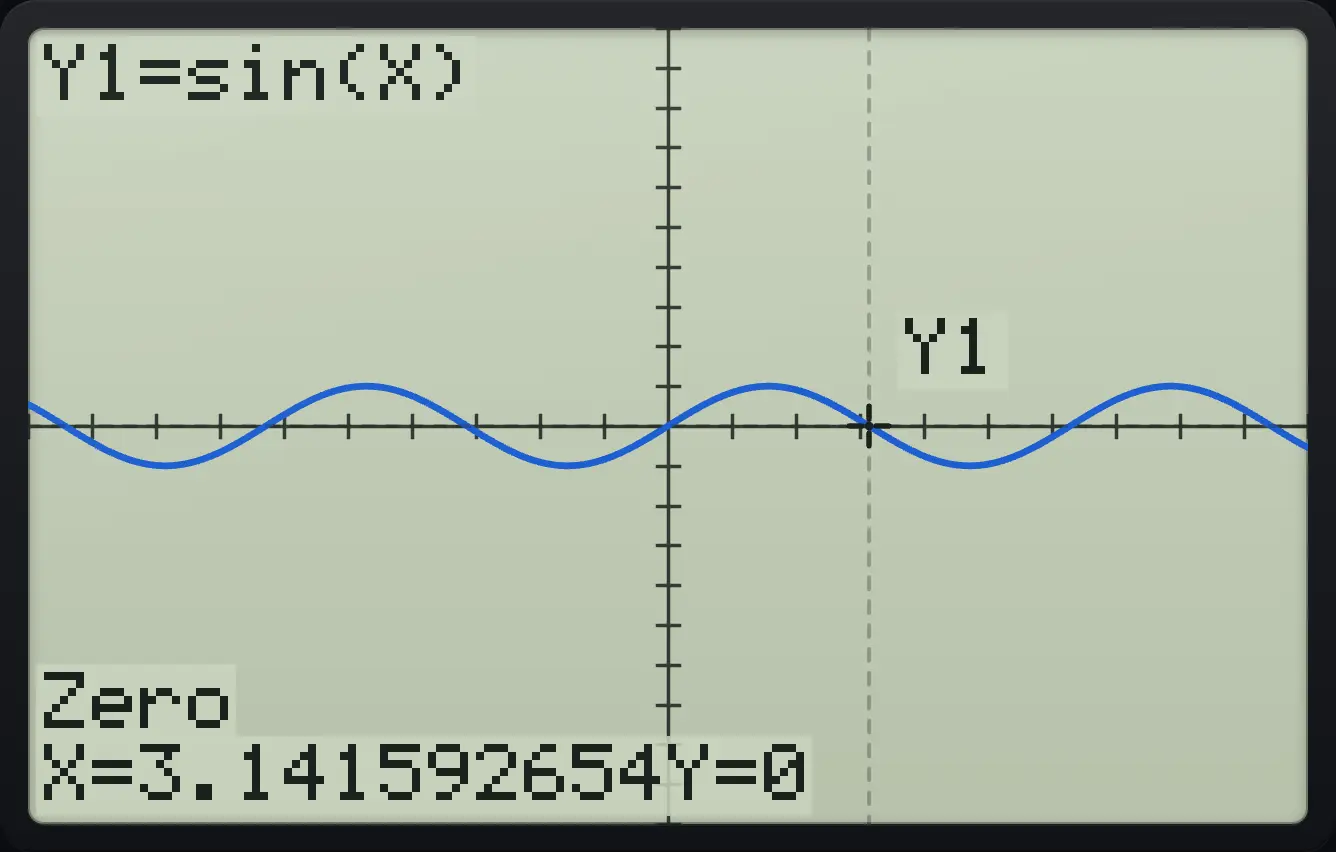
X=3.141592654No zero in the interval
Graph X²+1, which never crosses the axis, and ask for a zero between 1 and 2.
y=X,T,θ,nx²+1▼2ndCALCtrace21enter2enterenter
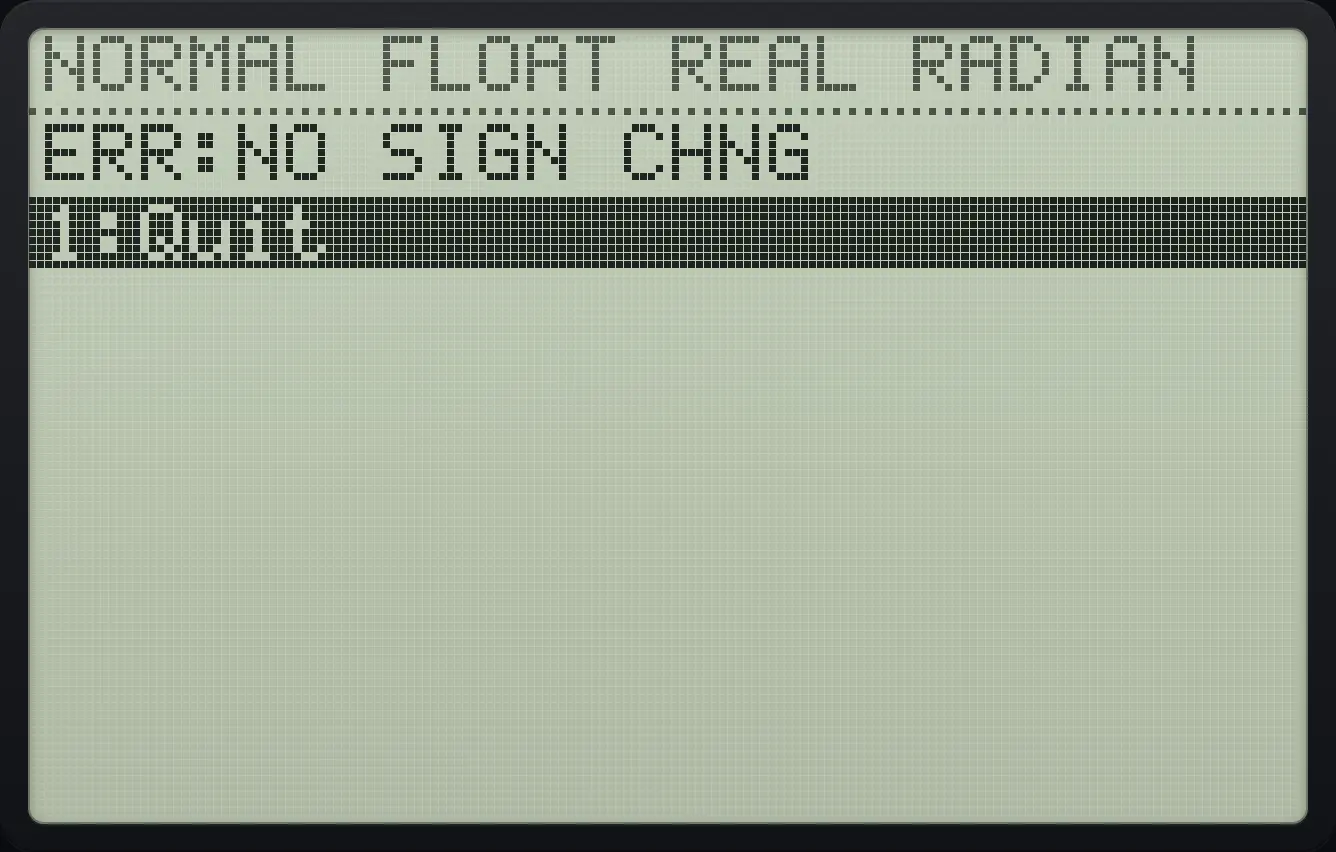
ERR:NO SIGN CHNG10.5Find a minimum or maximum#
Minimum and maximum work like zero: give a left bound, a right bound and a guess. They find the lowest or highest point of the graph between the bounds.
Minimum of x² − 2x
Graph Y1 = X²−2X, press 2nd trace and 3. Use bounds −5 and 5.
y=X,T,θ,nx²−2X,T,θ,n▼2ndCALCtrace3(−)5enter5enterenter
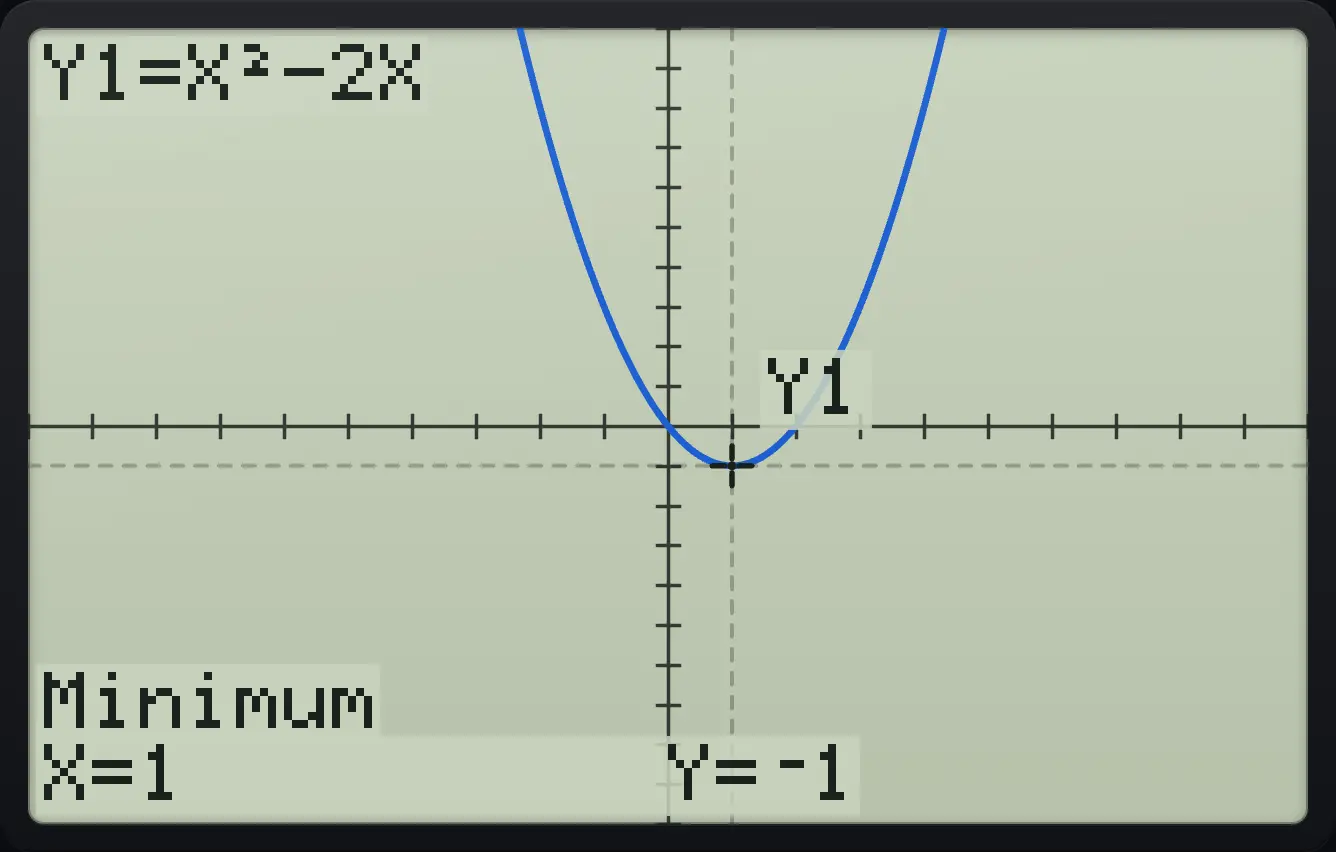
Minimum X=1 Y=⁻1Maximum of −x² + 2x
Graph Y1 = −X²+2X, press 2nd trace and 4. Use bounds −5 and 5.
y=(−)X,T,θ,nx²+2X,T,θ,n▼2ndCALCtrace4(−)5enter5enterenter
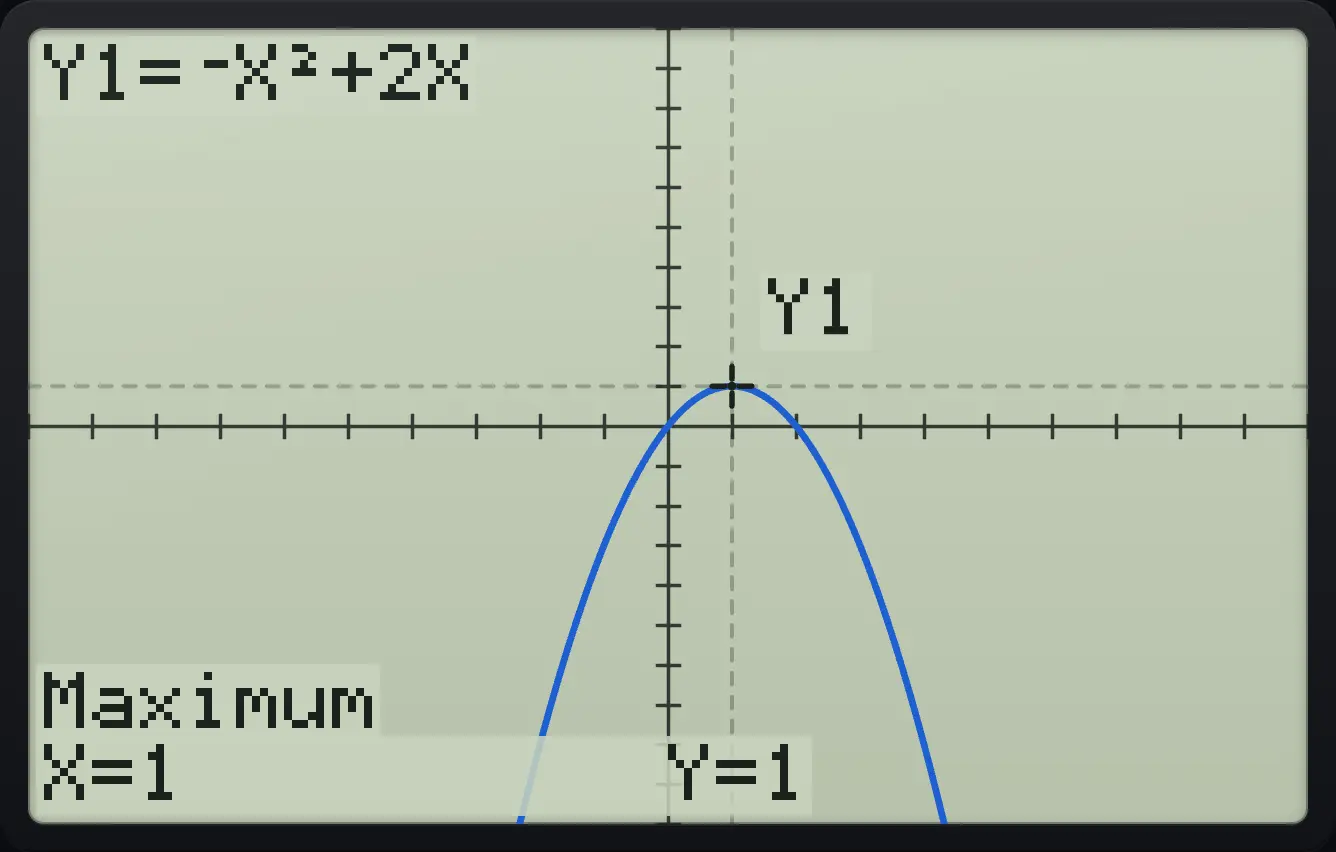
Maximum X=1 Y=110.6Find where two graphs intersect#
Graph both functions. Intersect first shows the first curve, then the second curve; press enter on each, then move to a guess near the intersection and press enter.
Where does y = x² meet y = x + 2?
Graph X² and X+2, press 2nd trace, 5, enter twice, then type 3 for the guess and press enter.
y=X,T,θ,nx²▼X,T,θ,n+2▼2ndCALCtrace5enterenter3enter
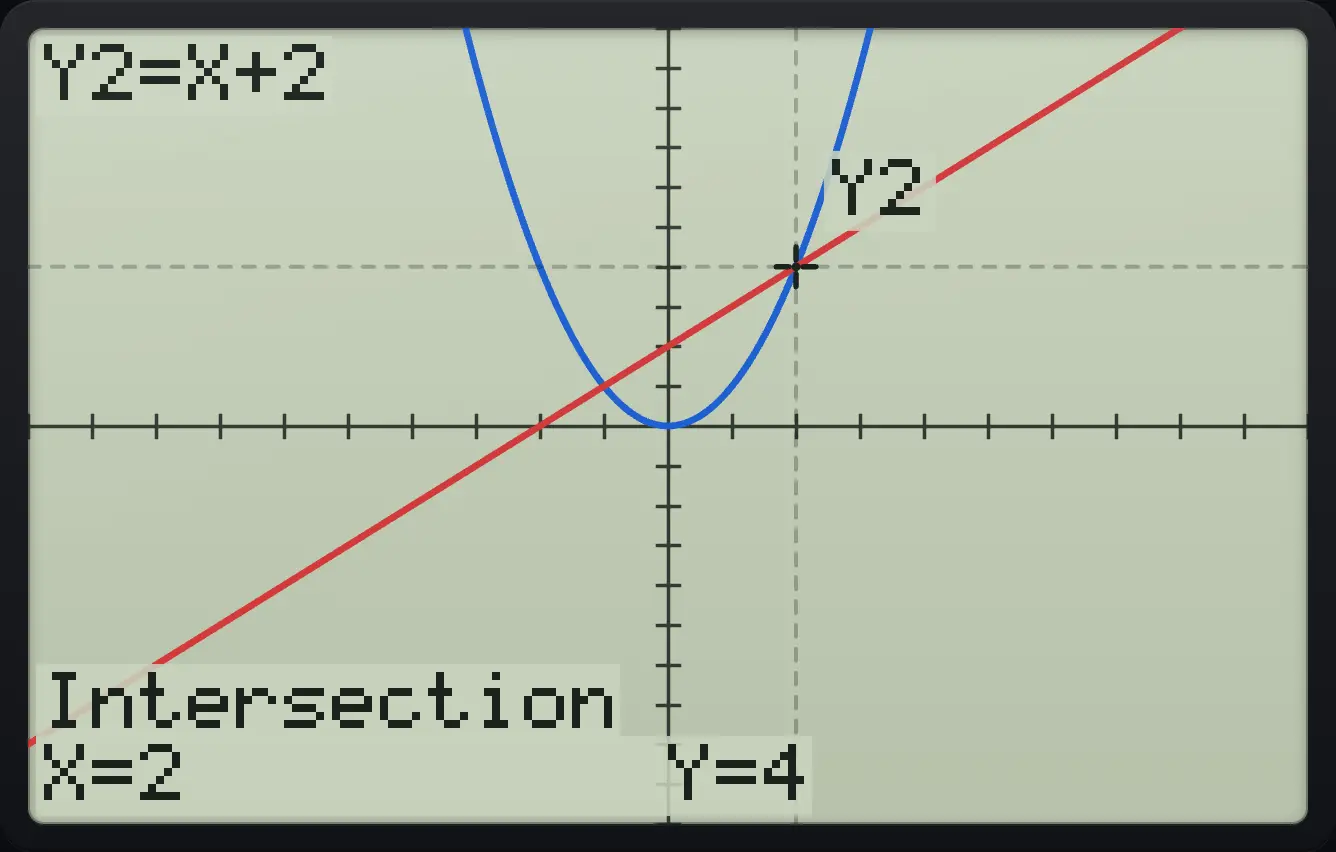
Intersection X=2 Y=4The other intersection
Give −2 as the guess instead.
y=X,T,θ,nx²▼X,T,θ,n+2▼2ndCALCtrace5enterenter(−)2enter
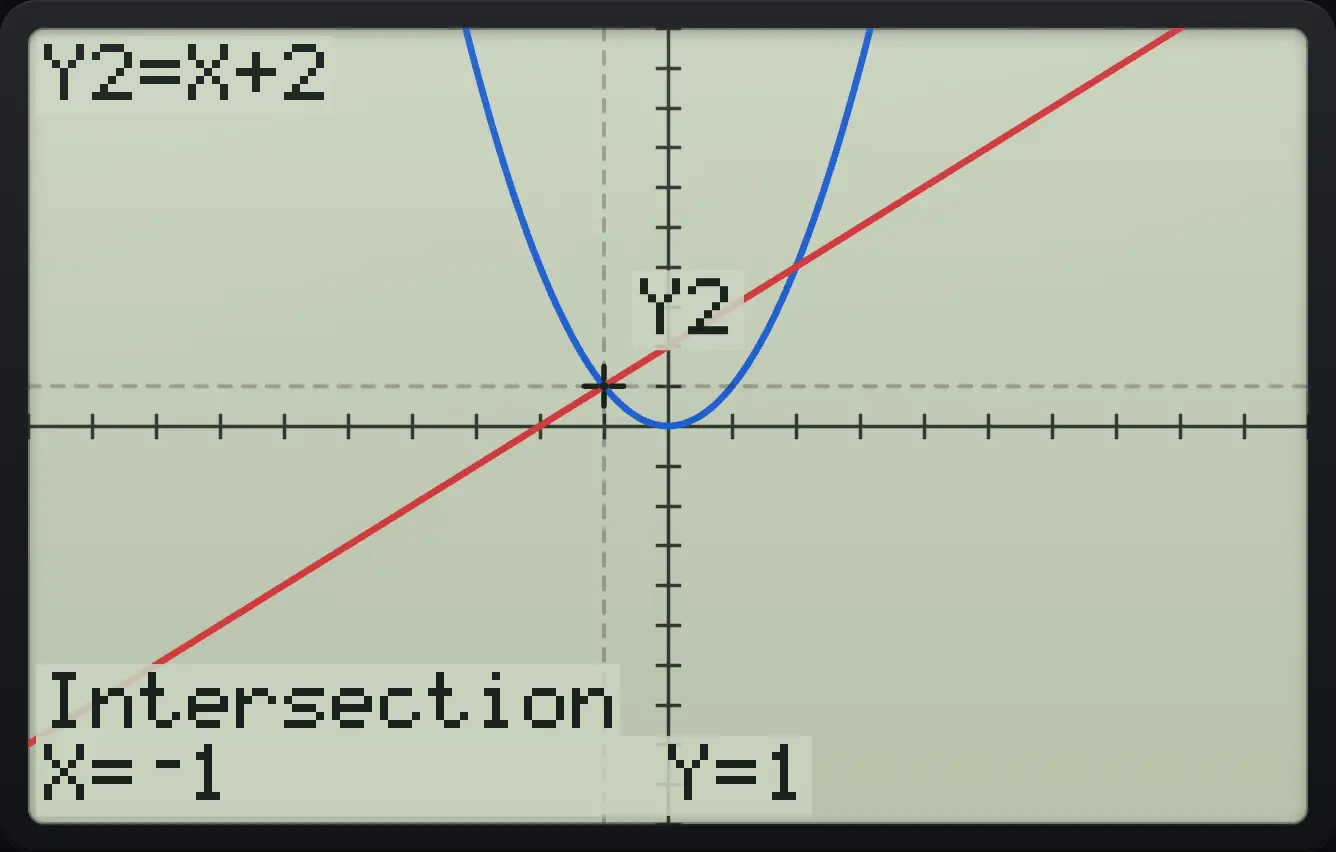
Intersection X=⁻1 Y=110.7Find the slope at a point (dy/dx)#
Choose 6:dy/dx, type the x value and press enter. Because the slope is estimated numerically the result can differ from the exact answer in the last digits.
Slope of x² at x = 1
Graph X², press 2nd trace, 6, type 1 and press enter.
y=X,T,θ,nx²▼2ndCALCtrace61enter
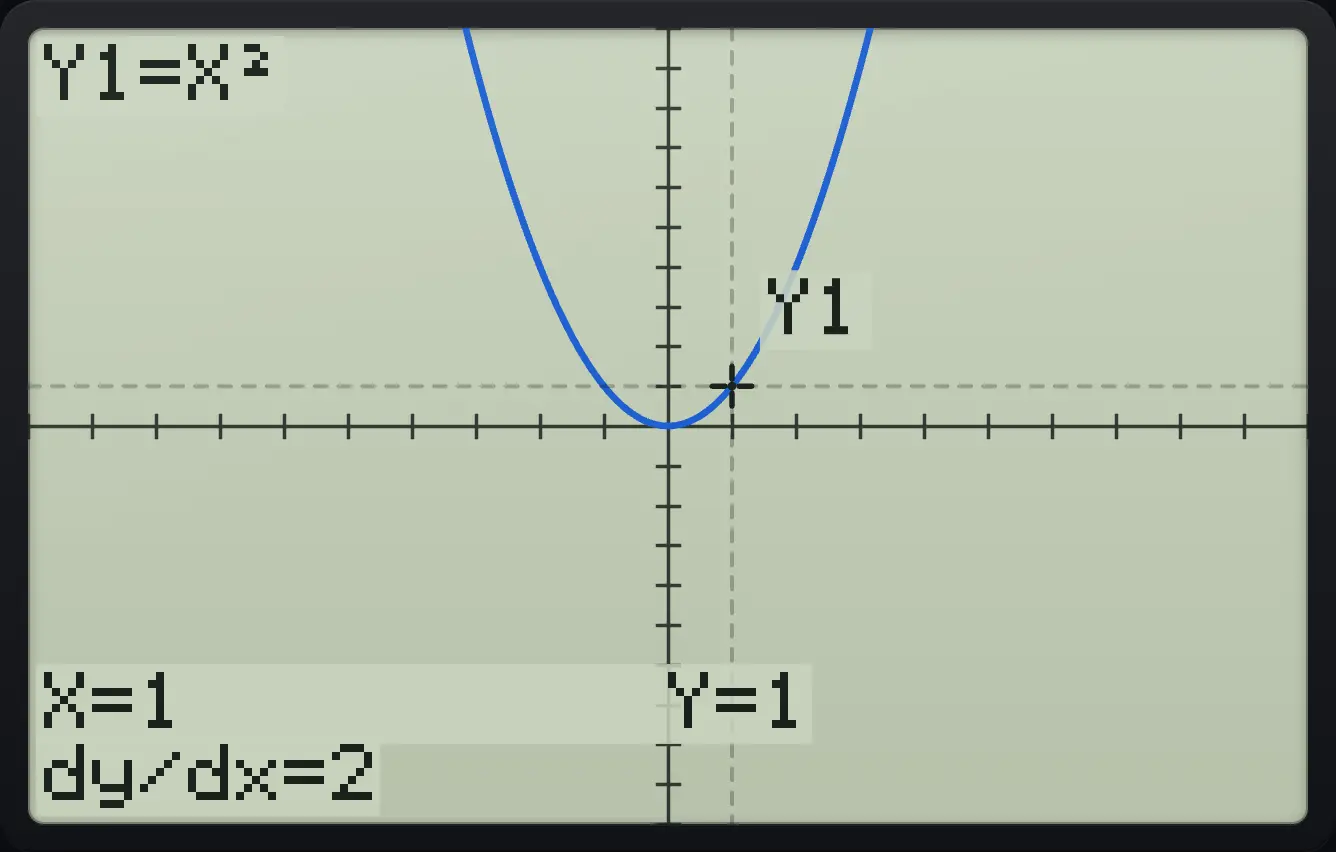
X=1 dy/dx=210.8Find the area under a curve#
Area under x² from 0 to 1
Graph X², press 2nd trace and 7. Type 0 for the lower limit and press enter.
y=X,T,θ,nx²▼2ndCALCtrace70enter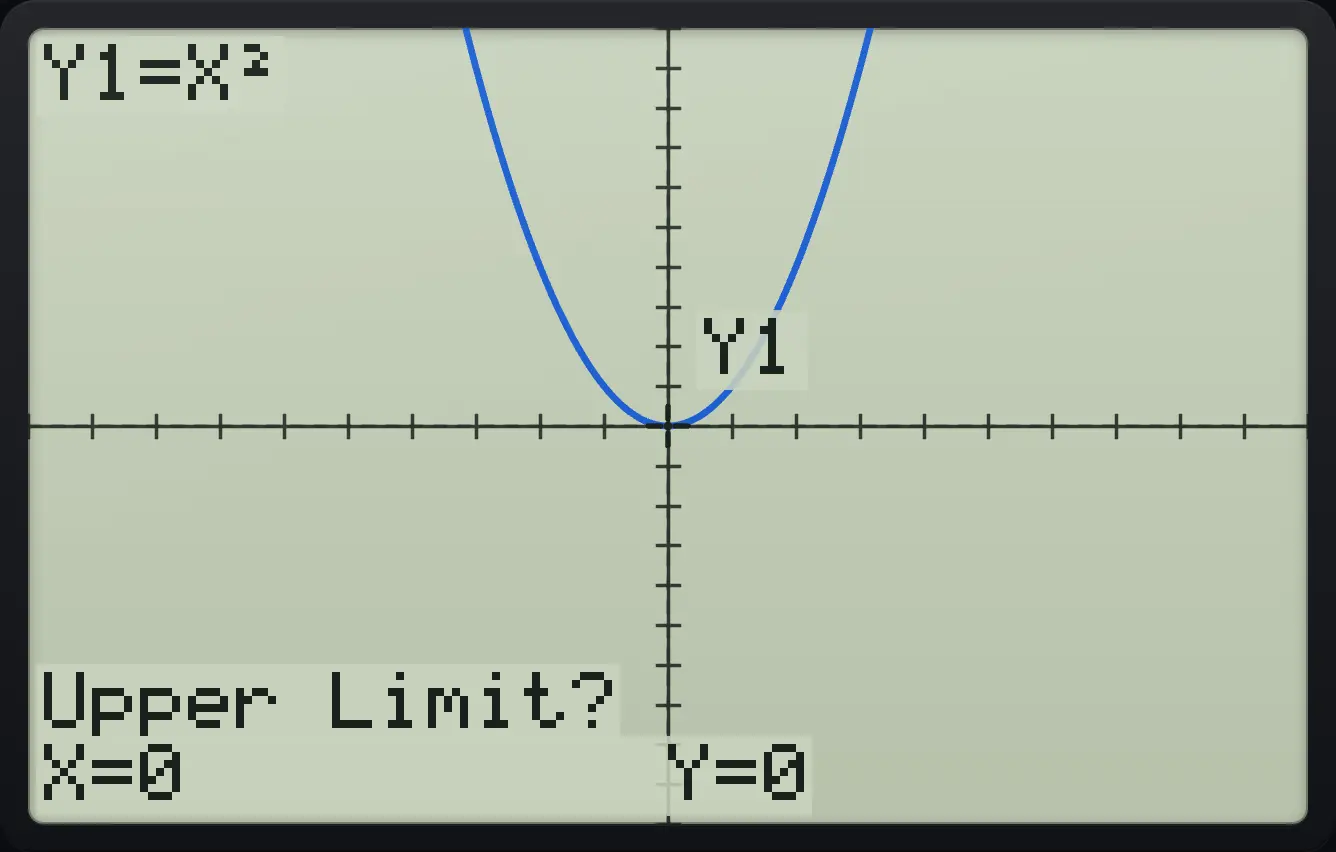
Type 1 for the upper limit and press enter. The area is shaded.
1enter
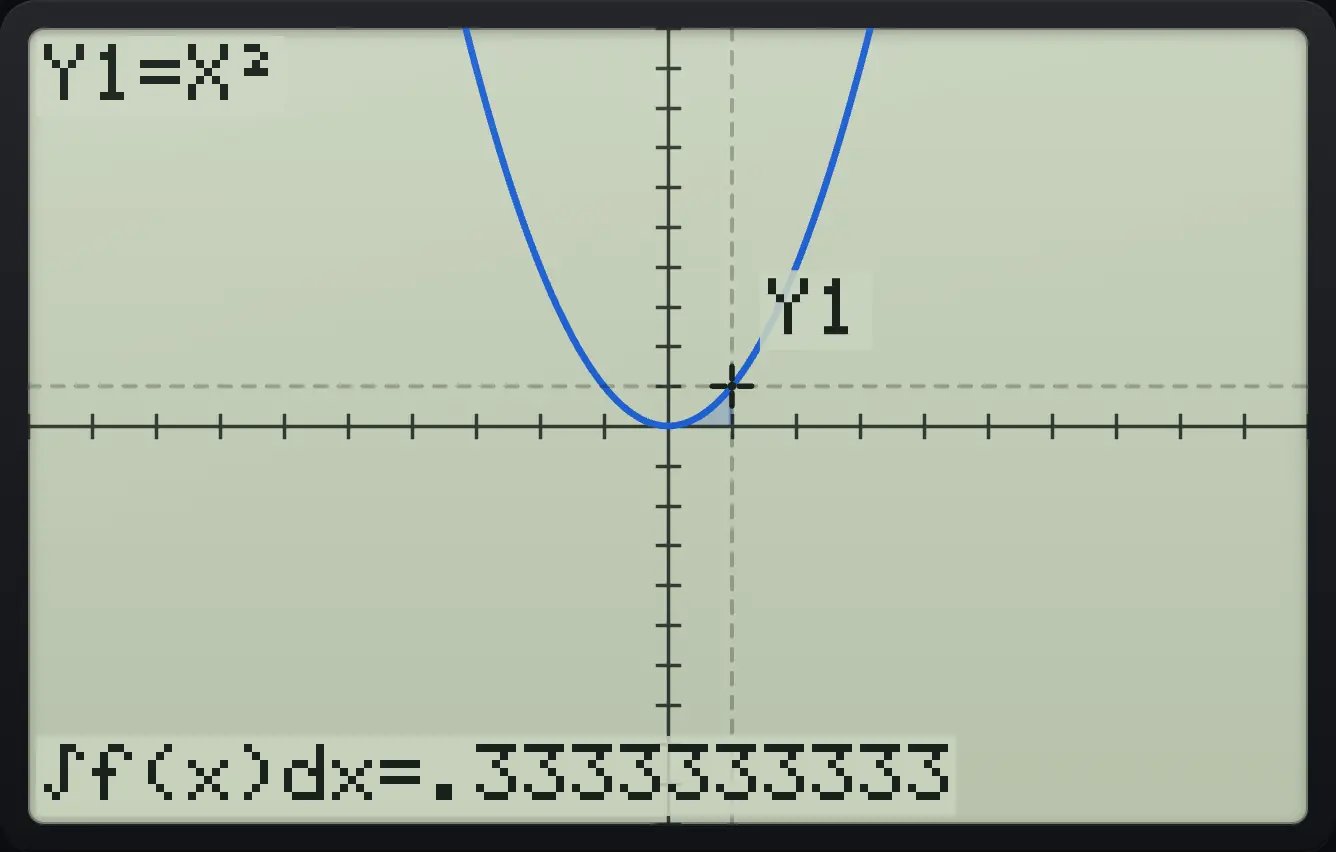
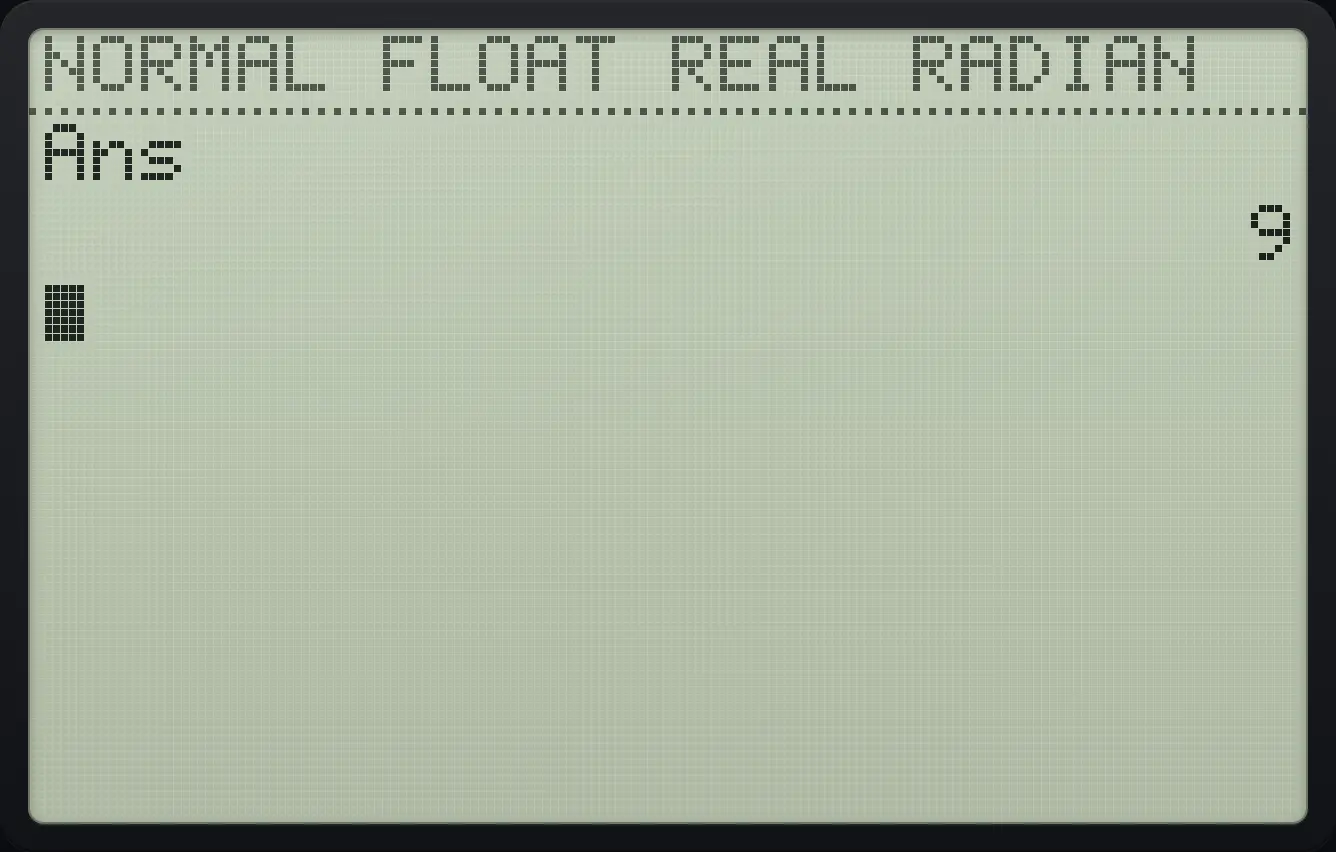
∫f(x)dx=.3333333333The value is also stored in Ans, so you can use it straight away on the home screen.
Use the integral as Ans
Integrate 2X from 0 to 3.
y=2X,T,θ,n▼2ndCALCtrace70enter3enterGo home and type Ans.
2ndQUITmode2ndANS(−)enter
Ans 9TI-84 Plus CE is a trademark of Texas Instruments Incorporated. Trident Calculator is an independent product by South View Studios and is not affiliated with, sponsored by or endorsed by Texas Instruments. The name is used only to describe the kind of calculator this model resembles; Trident's names, keys, display, fonts and software are its own clean-room design.